BTC/USDT
Bitcoin has left behind a week in which it entered a correction after its attack towards six-digit levels in Bitcoin. In the week when the interest of institutional investors increased, Bitcoin spot ETFs signed the highest weekly net inflow of all time with a net inflow of $ 3.38 billion last week. In the week when SEC Chairman Gary Gensler submitted his resignation, President D. Trump’s consideration of Howard Lutnick for the Treasury Department created a recovery in the market. When we look at this week, Tether’s $2 billion USDT printing brings up the claim that MicroStrategy will continue to buy Bitcoin intensively.
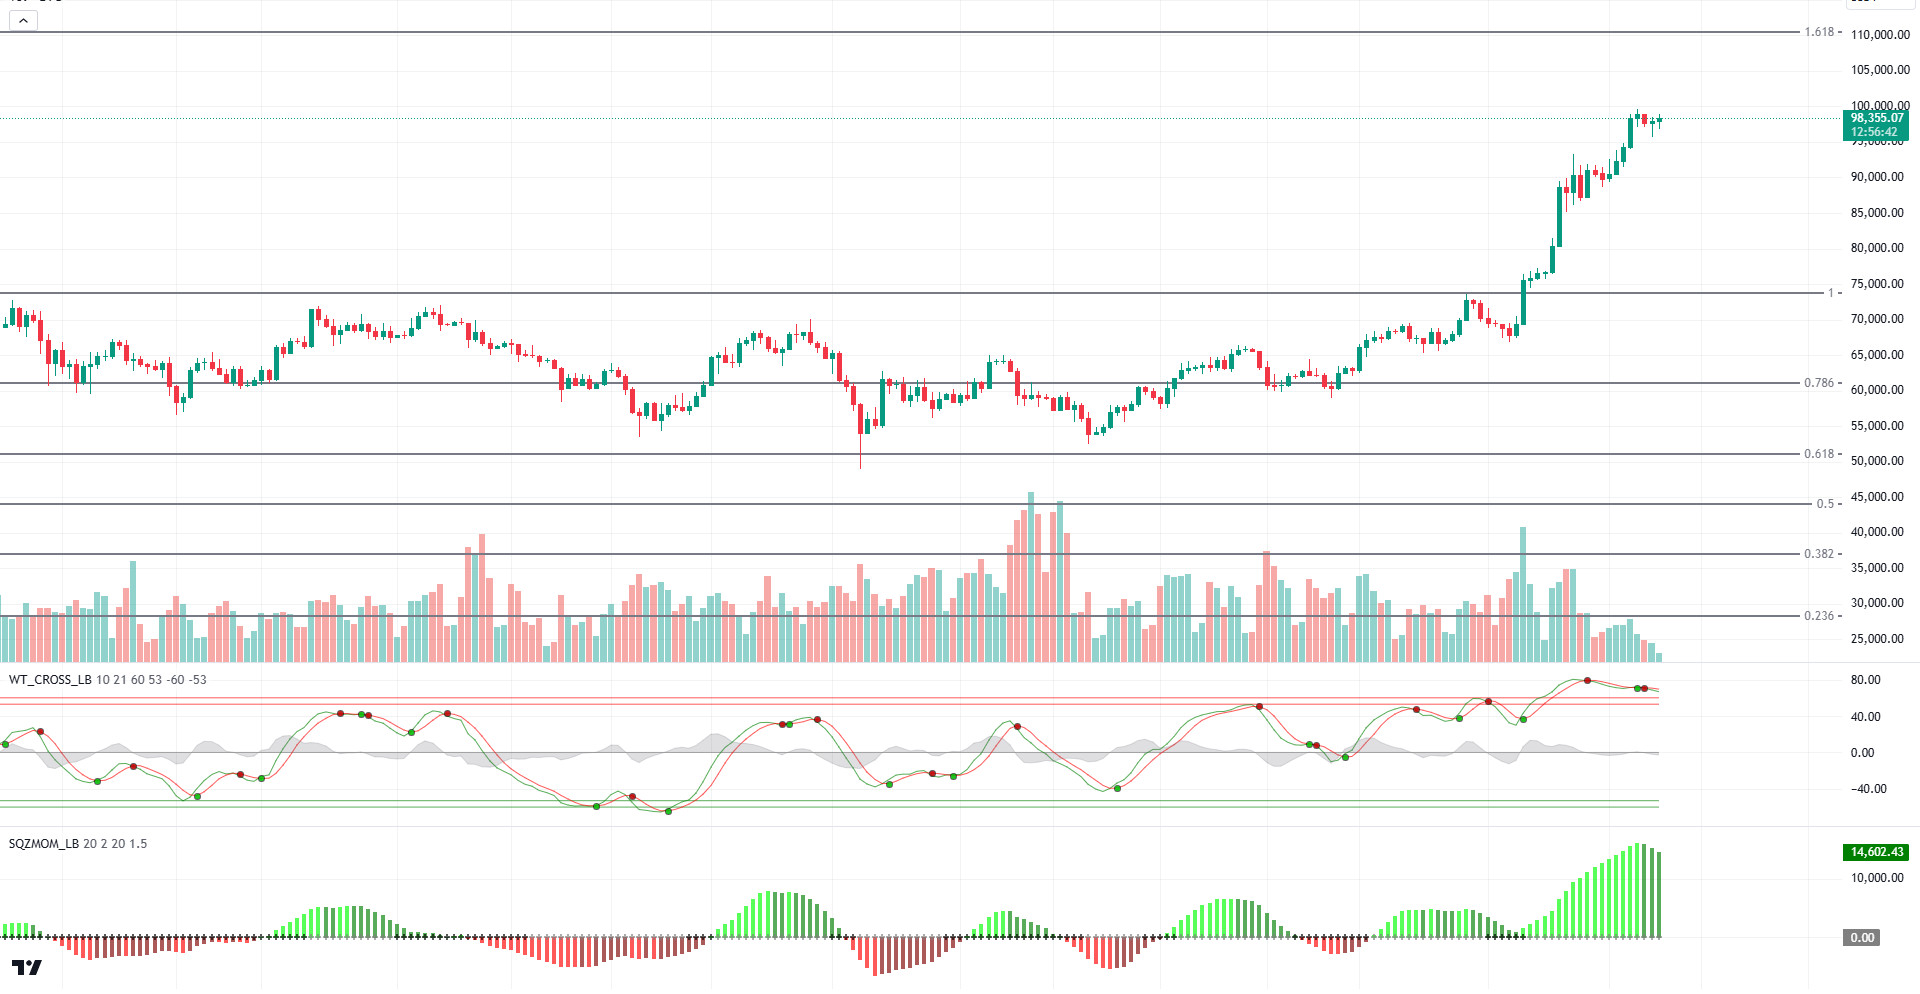
When we look at the technical outlook of BTC with all these developments, it continues to add new peaks to its bullish movement. Finally, BTC, which tested the ATH level of 99,655, retreated to 95,700 before reaching six-digit levels. With the market dynamics pointing to a bull period, the increase in risk appetite limits the pullbacks. The target for Bitcoin, which quickly completed the correction phase, is to exceed the psychological resistance level of 100,000 again. Once this level is exceeded, the resistance level of Fibonacci 1.618 (110,500) may meet us. Technical oscillators continue to give buy and sell signals in the overbought zone on the daily chart, while the squeeze momentum indicator points to the continuation of the trend.
Supports 95,000 – 90,000 – 83,000
Resistances 99,955 – 100,000 – 110,000
ETH/USDT
Ethereum, which has experienced a correction after the rise in recent weeks, broke through important resistance levels again and rose to 3,500 levels. According to Dune data, the increase in on-chain activity and the high volumes entering L2s in particular attract attention. As mentioned in last week’s analysis, it is also clear that liquidity flows from other networks have started. On the other hand, Beacon Chain transfers and the increase in the number of validators may be a harbinger of medium to long-term increases. We see that Ethereum, which has been bleeding against Bitcoin for a long time, may enter a recovery process with this data.
After the last weeks of ETH outflows on Eigen layer, seeing ETH inflows to LRT protocols again, especially last week, can be listed as one of the positive factors.
When we examine it technically, it can be said that
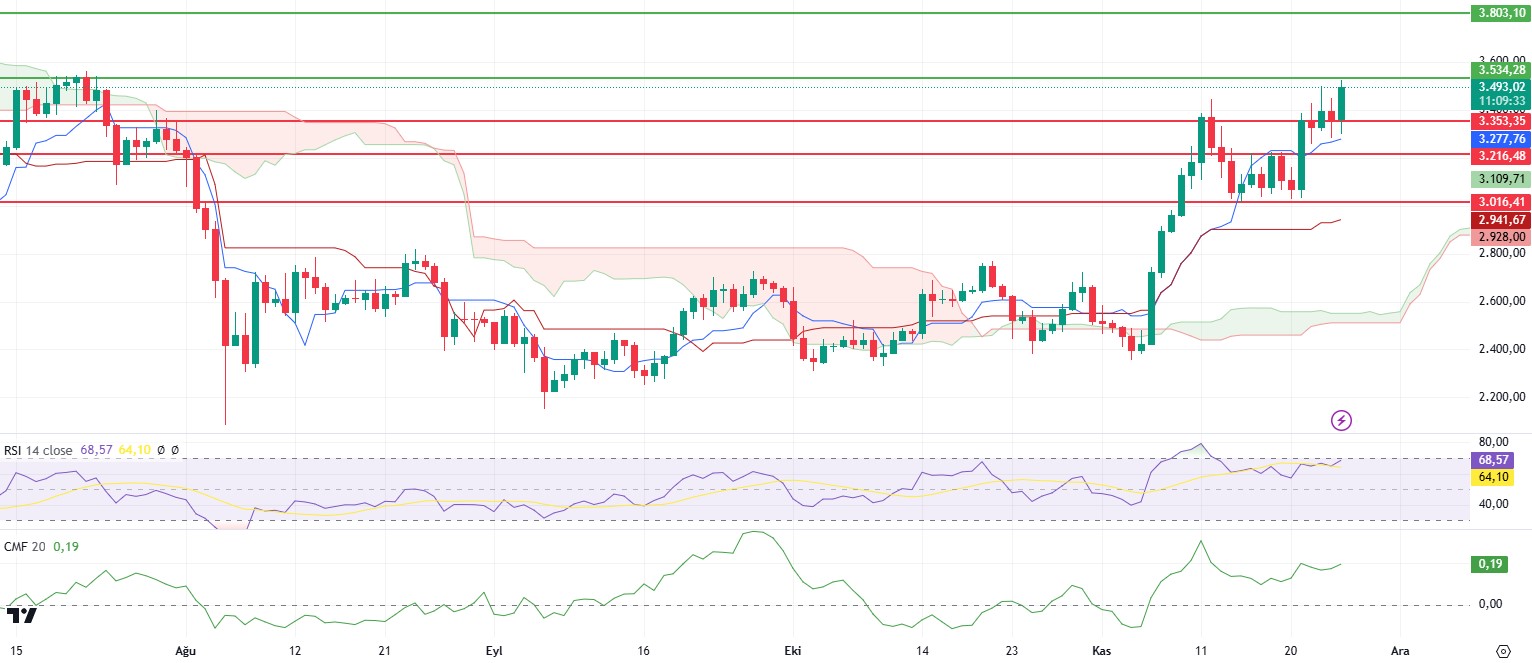
the first phenomenon that catches the eye is the disappearance of the negative divergence on the Relative Strength Index (RSI) and the formation of a positive structure. It is also seen that the rise from the 3,000 level to this region is supported by momentum. Chaikin Money Flow (CMF) exceeding the 0.15 level again can be listed as another positive factor. Looking at the Ichimoku indicator, exceeding the kumo cloud in the weekly time interval and the tenkan approaching the kijun level can be seen as a medium-term buy signal.
In the light of all this data, it seems very likely that ETH will rise towards 4,000 levels, provided that the 3,140 main support is not violated. However, the loss of the 3,140 level may disrupt the positive structure and bring more drastic declines.
Supports 3,353 – 3,216 – 3,016
Resistances 3,534 – 3,803 – 4,090
XRP/USDT
In partnership with Ripple Archax and Abrdn Plc, XRP Ledger also announced the first tokenized money market fund. With this news, XRP experienced a serious rise by exceeding the 1.56 level. It is pricing at 1.46 levels with the reaction it received from this region. Relative Strength Index (RSI) continues its horizontal movement in the overbought zone. Negative divergences on the RSI and above the 85 level may mean that XRP traders should be prepared for a possible correction. On the other hand, we see that momentum is also weakening and giving a sell signal. Besides all these, Chaikin Money Flow (CMF) still maintains its positive outlook.
The 1.23 level remains valid as the main support level in possible declines. A break of this level could start a downtrend for XRP. The 1.56 level stands out as the first resistance zone. Closures above this level can ensure that the rise continues with hard candles.
Supports 1.2333 – 1.3486 – 1.4235
Resistances 1.5618 – 1.7117 – 1.9710
SOL/USDT
If we take a brief look at the developments in the Blockchain ecosystem last week, Trump said he was considering crypto lawyer Teresa Goody Guillén to be the head of the SEC. On the other hand, another 1 billion USDT was printed. The American stock exchange Nasdaq listed BlackRock’s Bitcoin ETF options yesterday. Bitcoin mining difficulty reached an all-time high of 102.29T.
Bitwise, a leading asset manager in the Solana ecosystem, has reportedly filed for a Solana ETF Trust in Delaware, according to multiple social media posts. Based on available data, the firm officially filed Form S-20 on November 20, 2024 with the United States Securities and Exchange Commission (SEC) under the name “BITWISE SOLANA ETF”. However, VanEck Crypto Assets President Matthew Sigel made striking statements about the Solana ETF. “I think a Solana ETF will start trading by the end of 2024,” Sigel said. Sigel’s words resonated widely in the cryptocurrency market. This exit has once again turned investors’ attention to Solana. Bitcoin’s surge above $99,655 raised the price of Solana and altcoin optimism. However, the price has been rising with bullish momentum amid market optimism, DeFi growth and ETF speculation. DeFi growth and stablecoin adoption have enabled Solana’s ecosystem to expand. On top of this, Solana has increased its stablecoin supply to over $4.5 billion, bringing its Total Value Market (TVL) to over $8.43 billion. This shows the growing interest in the decentralized finance (DeFi) area of blockchain. According to data from Santiment, 9.9 billion SOLs were traded on November 17, the second highest daily volume in the past 90 days since August 5. However, market demand for Solana has declined significantly following the rejection at the $250 resistance level. According to the latest data, investors traded only 6.7 billion SOL on November 19, a sharp 52% drop in trading volume in 48 hours. This means that Solana activity has reached record highs on many metrics, but the data suggests that its performance may be inorganic. Glassnode claimed that much of this activity was carried out by bots, according to its report. In a post published on X on November 19, Glassnode noted that Solana’s transfer volume reached an all-time high of $318 billion on November 16. This is almost three times SOL’s total market capitalization, which currently stands at $112.29 billion. The total number of active addresses on Solana rose to 22 million. However, the onchain analytics firm noted that average transaction volumes dropped at the same time. This raises questions about the accuracy of Solana’s metrics because if the growth is organic, there should be a similar rise in averages. According to DefiLlama data, Solana daily revenue hit a record high of almost $6 million on November 20, with network participants paying $7.63 million in transaction fees. As a result, Solana’s reported figures on network activity over the past few months may be artificially inflated due to trading in meme coins, leading to skepticism over the network’s true growth trajectory. In the coming week, Prelim GDP and Core PCE Price data from the US are among the data to follow.
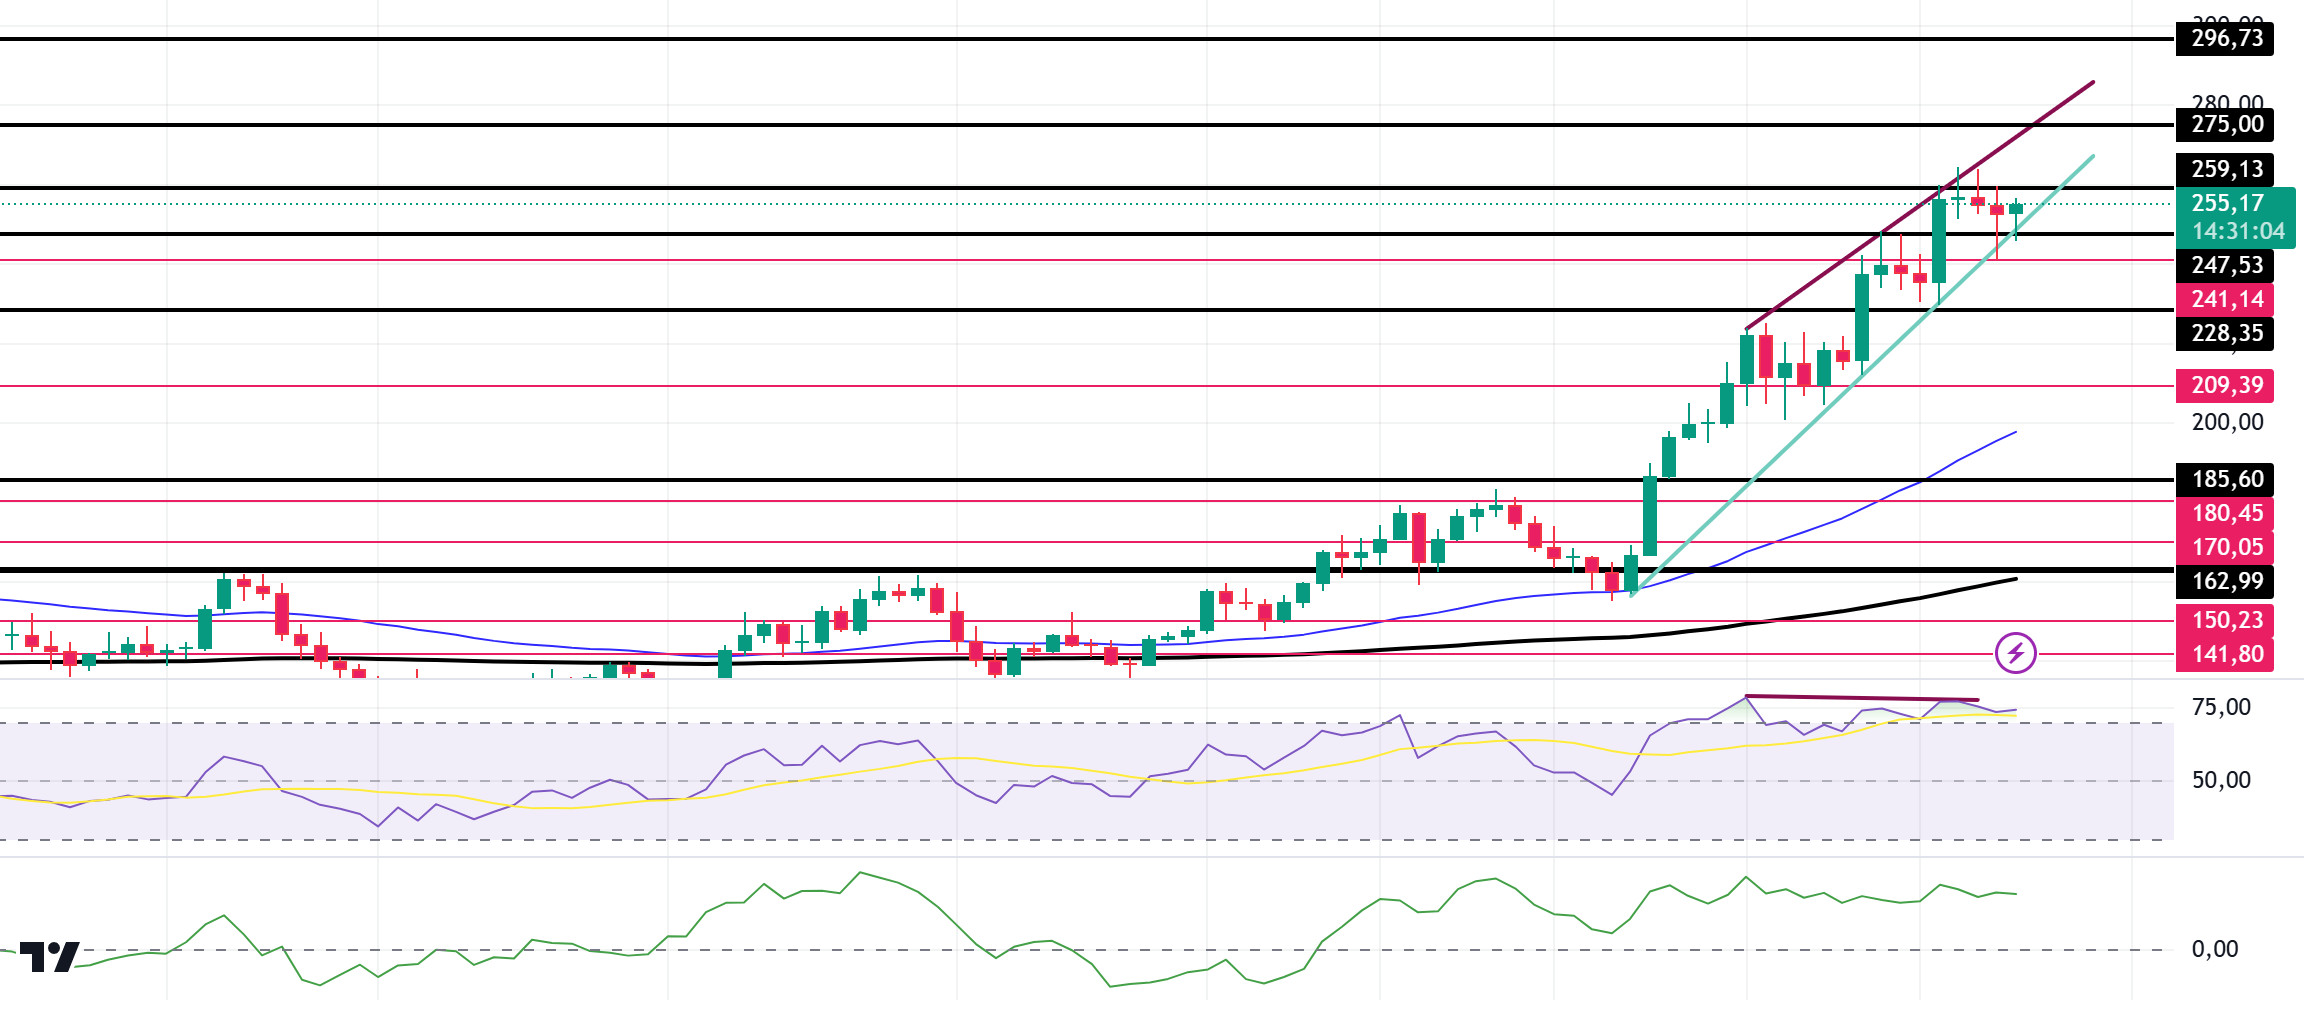
Technically, SOL is priced at 254.12, up 4.97% in the last week. It has broken the 247.53 resistance, which is a strong resistance place, and turned it into support. This is an important support level for the continuation of the rise. On our daily chart, the 50 EMA (Blue Line) continues to accelerate upwards from the 200 EMA (Black Line). This shows us that the trend is bullish. The Relative Strength Index (RSI) is at 14 overbought levels but there is a mismatch. We also have a falling wedge pattern on our chart. All this points to a pullback in the price. However, when we examine the Chaikin Money Flow (CMF)20 indicator, money inflows are positive, but inflows seem to be balanced. If the positive results in macroeconomic data and positive developments in the ecosystem continue, it may test the first major resistance level of 275.00. In case of declines due to political developments or negative news in the Solana ecosystem, the 185.60 level can be followed and a buying point can be determined.
Supports 247.53 – 241.14 – 228.35
Resistances 259.13 – 275.00 – 296.73
DOGE/USDT
If we take a brief look at the developments in the Blockchain ecosystem last week, Trump said he was considering crypto lawyer Teresa Goody Guillén to be the head of the SEC. On the other hand, another 1 billion USDT was printed. The American stock exchange Nasdaq listed BlackRock’s Bitcoin ETF options yesterday. Bitcoin mining difficulty reached an all-time high of 102.29T.
In the Doge ecosystem, tech entrepreneur Elon Musk was on the scene again. In a recent post on X with more than 14 million views, Musk shared a meme tagging himself as “The Dogefather”. The black-and-white meme was a classic movie adaptation of Mario Puzo’s iconic novel “The Godfather”. This could be interpreted as a signal that the Doge coin will go higher. On the other hand, US President-elect Donald Trump recently announced the creation of a new initiative known as the Department of Government Efficiency (DOGE), which will be led by Elon Musk and Vivek Ramaswamy. Its ultimate goal, he said, would be to streamline federal operations and reduce government spending by at least $2 trillion, a goal that various budget experts have deemed unrealistic. In a statement, Vivek Ramaswamy promised to revamp the American bureaucracy under the Department of Government Efficiency (DOGE), which he and Elon Musk had just established. Musk did not bring a chisel; he brought a chainsaw, Ramaswamy said. “We’re going to take this to the bureaucracy,” the biotech CEO added. “It’s going to be a lot of fun.” Dogecoin’s active addresses reached an all-time high, surpassing 1.33 million daily participants. This increase reflects growing network demand, which is a bullish indicator for the cryptocurrency. The expanding trading volume touts DOGE as a safe haven. Rising network activity has historically supported price gains. Investor confidence, coupled with broader market cues, increases the likelihood of continued upward pressure on the price. There has been a significant increase in whale trading. In the coming week, Prelim GDP and Core PCE Price data from the US are among the data to be monitored.
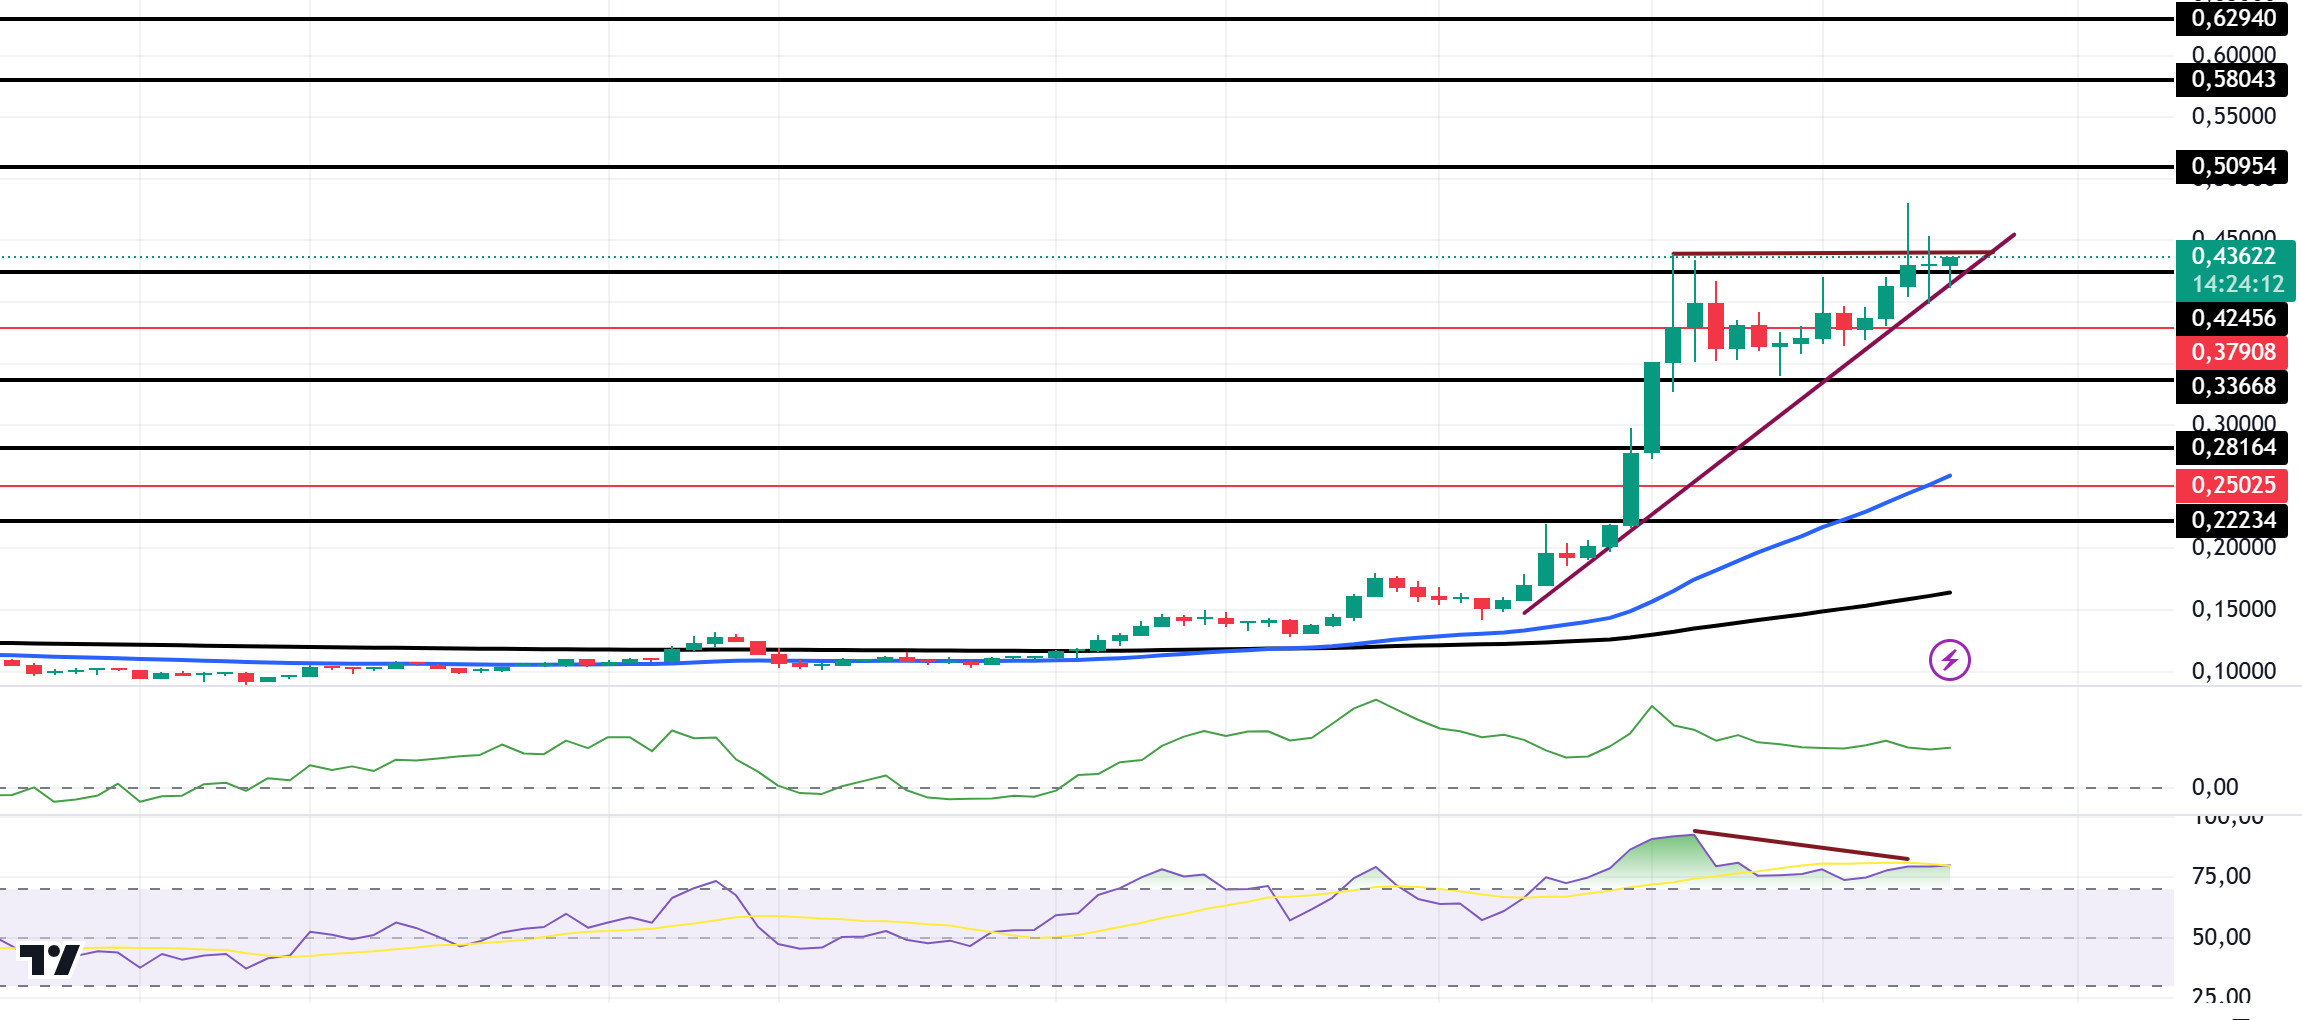
When we look at the daily chart, although the 50 EMA (Blue Line) continues to stay above the 200 EMA (Black Line), the difference between the two averages is 58.64%, increasing the possibility of a pullback. This also shows us that the DOGE coin is bullish. If we look at the liquidity zone of DOGE, there is a liquidation place of approximately 204.93 million dollars at 0.3938 in short position. When we look at the Chaikin Money Flow (CMF)20 indicator, money inflows started to decrease, albeit positive. Relative Strength Index (RSI)14 continues to remain in the overbought zone. At the same time, there is a mismatch. This may bring profit sales. On the other hand, the ascending triangle pattern should be taken into account. If this pattern works, the $1 target may be realized. In case of possible macroeconomic conditions and negative developments in the ecosystem and retracements, 0.33668 can be followed as a strong support. In case of continued rises, 0.50954 should be followed as a strong resistance.
Supports: 0.42456 – 0.37908 – 0.33668
Resistances: 0.50954 – 0.58043 – 0.62940
TRX/USDT
TRX, which started last week at 0.1994, rose about 4.5% during the week and closed the week at 0.2085. This week in the US, Conference Board consumer confidence, Federal Open Market Committee (FOMC) meeting minutes, gross domestic product, unemployment claims and core personal consumption expenditures price index data will be released. These data are important to affect the market and the data to be announced in line with expectations may have a positive impact.
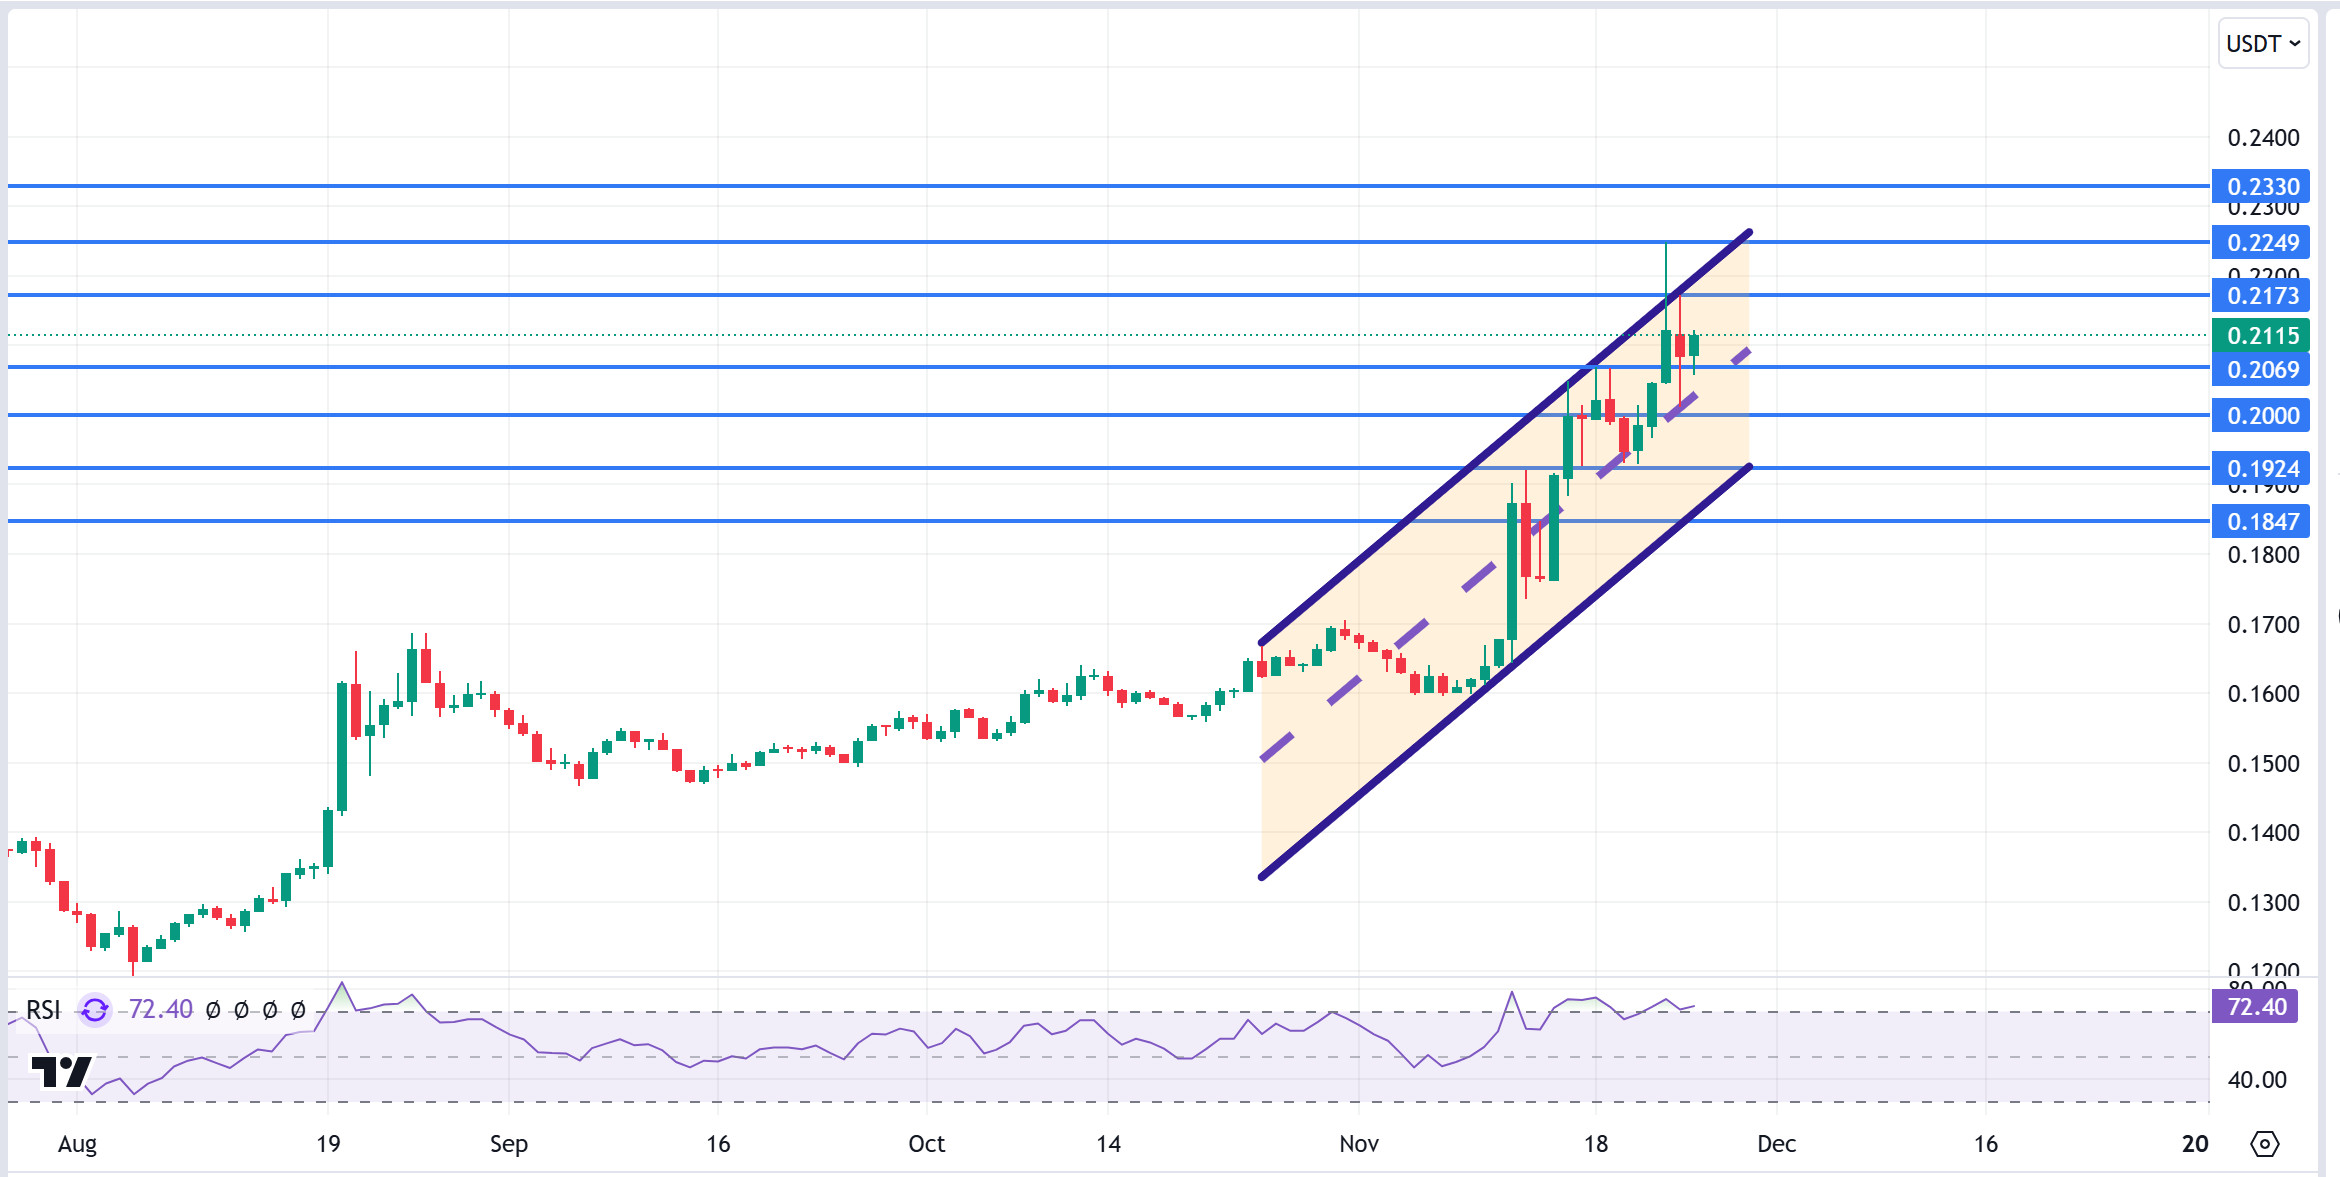
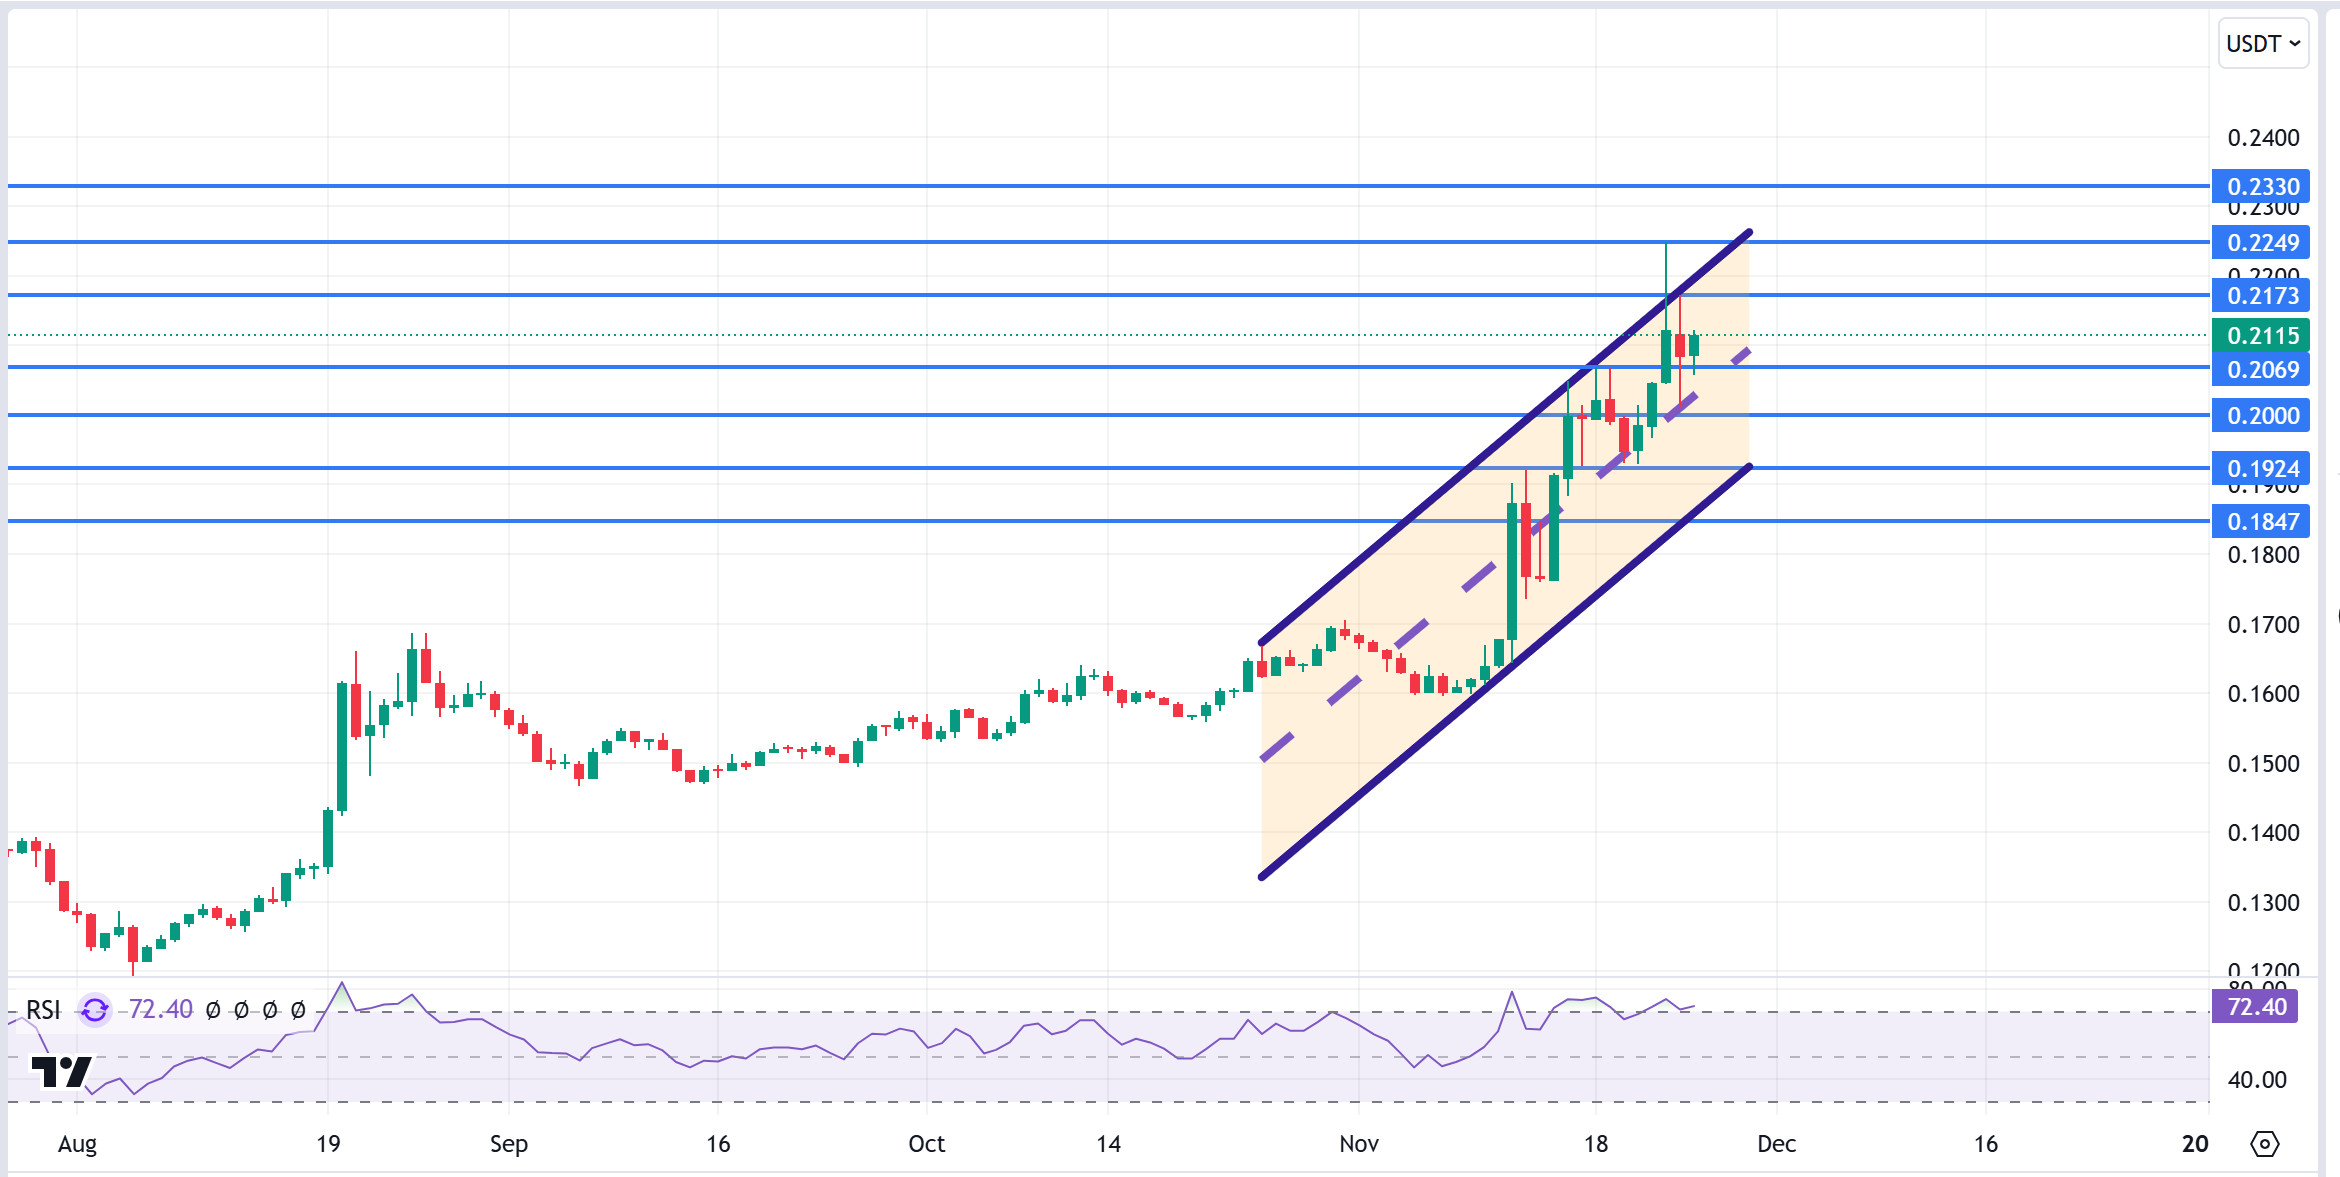
TRX, which is currently trading at 0.2115 and moving within the bullish channel on the daily chart, is located in the upper band of the channel. The Relative Strength Index is in the overbought zone with a value of 72 and can be expected to decline slightly from its current level and move to the middle band of the channel. In such a case, it may test the 0.2069 support. If it cannot break the 0.2069 support and rises with the next buying reaction, it may want to test the 0.2173 resistance. As long as it stays above 0.1924 support on the daily chart, the bullish demand may continue. If this support is broken, selling pressure may increase.
Supports 0.2069 – 0.2000 – 0.1924
Resistances: 0.2173 – 0.2249 – 0.2330
AVAX/USDT
AVAX failed to break the 33.10 support level in its decline last week and started to rise with the incoming purchases. After rising to 45.31, it fell to 38.20 in the decline seen across the crypto market. AVAX, which started the new week at 42.08 with its pre-closing rise, generally moves in line with the crypto market trend.
The fact that Donald Trump, who won the US Presidential Elections, will have cryptocurrency-friendly people in his team, and SEC Chairman Gary Gensler, who stands out with his strict attitude towards the cryptocurrency sector, will leave his post on January 20, 2025, have taken their place as positive developments in the cryptocurrency market. Especially after Bitcoin and Ethereum ETFs, Solana and Ripple ETFs came to the agenda. In the coming period, AVAX ETF applications may also come to the agenda and this may cause an increase in AVAX value. In addition, Avalanche announced a partnership with Suntory, a 125-year-old Japanese beverage company. Recently, partnership agreements seen throughout the crypto market can be effective in the appreciation of cryptos.
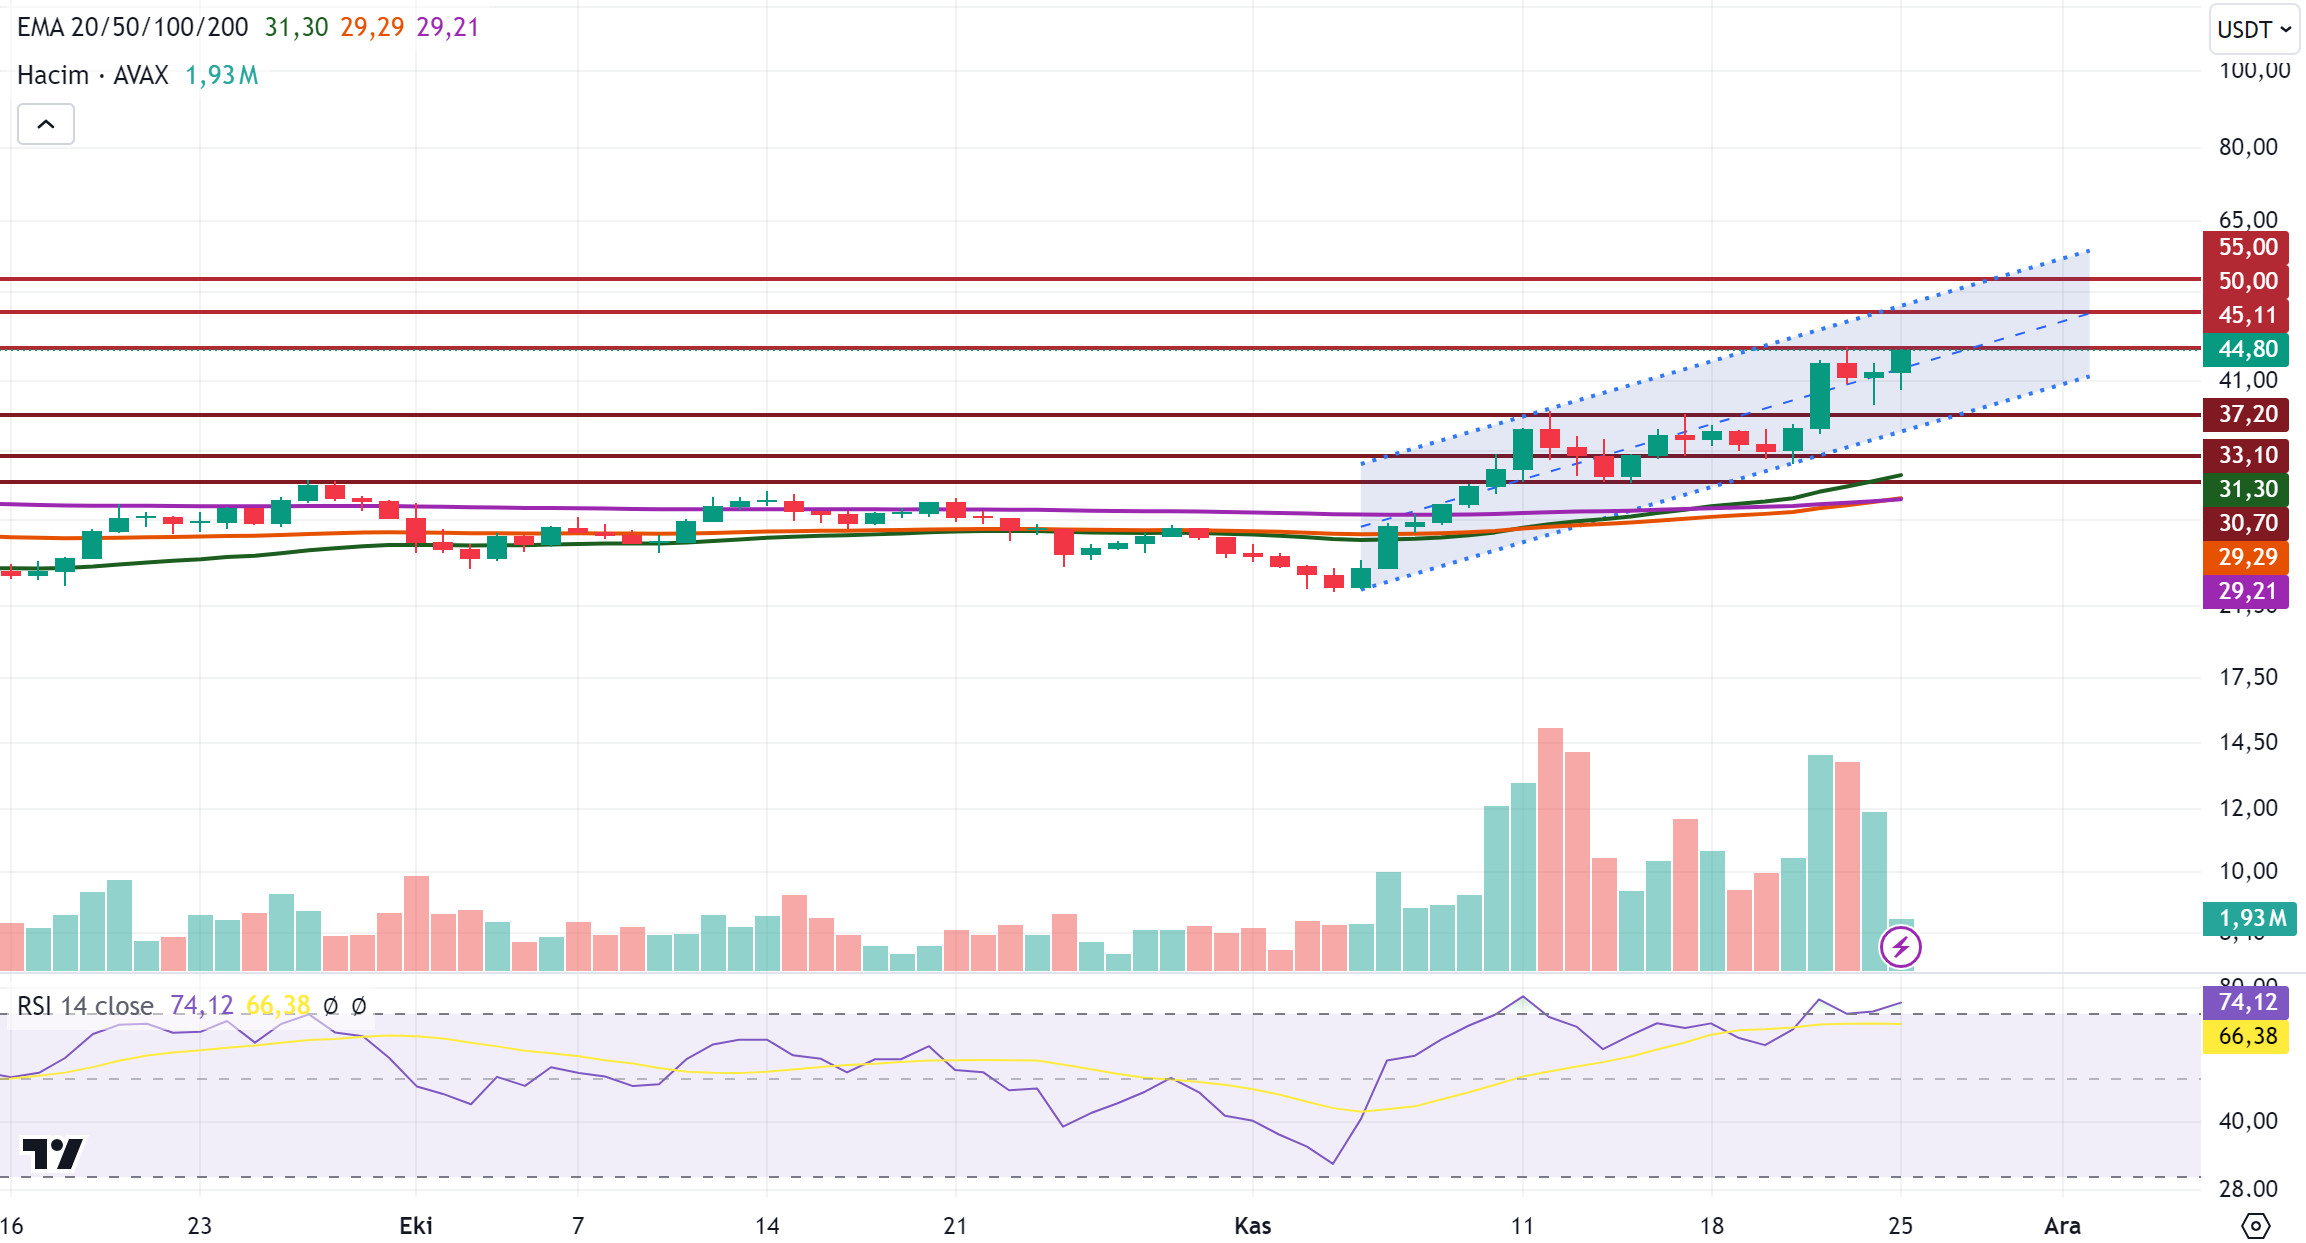
When we examine the daily analysis chart for AVAX, it continues to be traded in the bullish channel. Above the exponential moving average (EMA) levels, buying pressure may continue in AVAX. In line with this data, AVAX may continue to rise and the 50.00 level stands out as a strong resistance level in its rise. If this level is broken, the rise may gain momentum. Relative Strength Index (RSI) value is currently in the overbought zone at 74.10. This means that it may make a correction and may test the 37.20 support level in its decline. If this support level is broken and the decline deepens, the 33.10 level stands out as a strong support level. If it tests this level, it may rise again with the reaction purchases that may come.
Supports 37.20 – 33.10 – 30.70
Resistances 45.11 – 50.00 – 55.00
SHIB/USDT
The Shiba Inu team alerted the community to the risks of scams, encouraging them to follow trusted sources and focusing on awareness efforts to combat fake accounts. These announcements coincided with a 12% spike in the SHIB price, which had a confidence-building effect.
Then, the leader Shytoshi Kusama emphasized that SHIB is one of the best performing meme coins with a 150% year-to-date return, maintaining its position as the most valuable ERC-20 token on Ethereum. Such statements have increased SHIB’s visibility and strengthened investor interest.
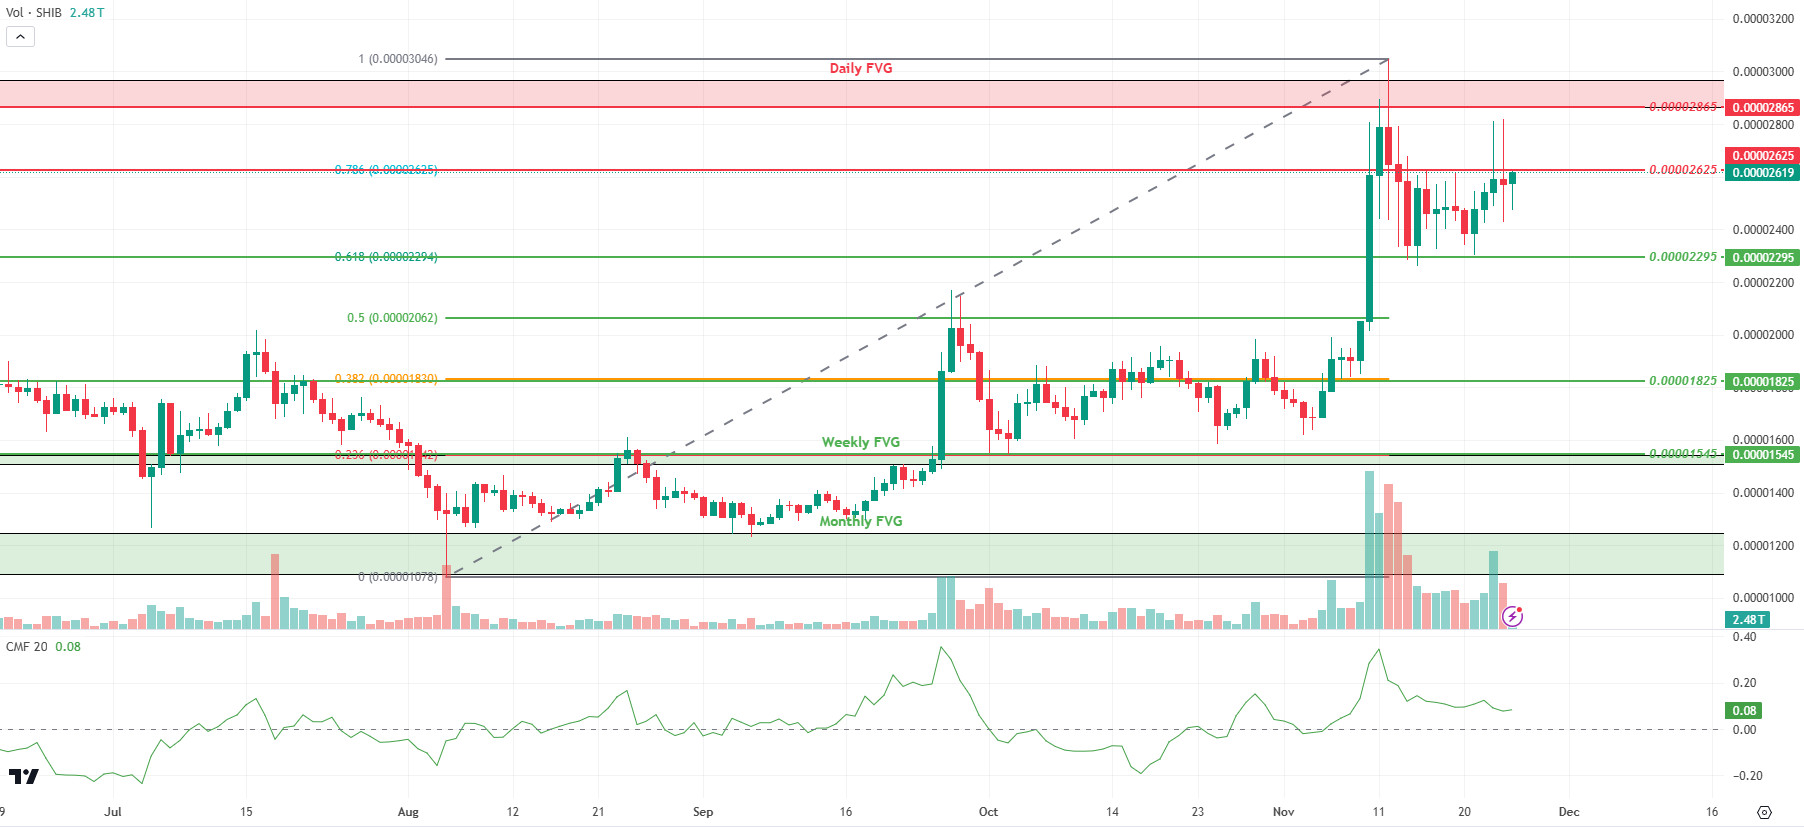
Technically, the price seems to have failed to sustain above the 0.00002625 level. The Chaikin Money Flow (CMF) oscillator is currently hovering at 0.08, down from 0.12 last week. This shows that the selling pressure has strengthened compared to last week. In this context, if the price fails to sustain above 0.00002625, it may retreat towards the Fibonacci 0.618 support level of 0.00002295. On the other hand, if the price can maintain above the 0.00002625 resistance level with increasing buyer pressure, it may move towards the Daily Fair Value Gap (FVG) level of 0.00002865.
Supports 0.00002295 – 0.00001825 – 0.00001545
Resistances 0.00002625 – 0.00002865 – 0.00003445
LEGAL NOTICE
The investment information, comments and recommendations contained in this document do not constitute investment advisory services. Investment advisory services are provided by authorized institutions on a personal basis, taking into account the risk and return preferences of individuals. The comments and recommendations contained in this document are of a general type. These recommendations may not be suitable for your financial situation and risk and return preferences. Therefore, making an investment decision based solely on the information contained in this document may not result in results that are in line with your expectations.


