MARKET SUMMARY
Latest Situation in Crypto Asset
| Assets | Last Price | 24h Change | Dominance | Market Cap |
|---|---|---|---|---|
| BTC | 97,775.39 | 0.39% | 57.87% | 1,93 T |
| ETH | 3,483.11 | 4.73% | 12.53% | 418,90 B |
| SOLANA | 249.28 | 0.64% | 3.54% | 118,21 B |
| XRP | 1.449 | 5.27% | 2.47% | 82,62 B |
| DOGE | 0.4183 | 0.08% | 1.84% | 61,43 B |
| CARDANO | 1.0185 | 1.93% | 1.07% | 35,67 B |
| AVAX | 44.36 | 10.40% | 0.54% | 18,16 B |
| TRX | 0.2068 | 0.97% | 0.53% | 17,86 B |
| SHIB | 0.00002568 | 2.09% | 0.45% | 15,13 B |
| DOT | 8.740 | 2.87% | 0.40% | 13,29 B |
| LINK | 18.50 | 10.99% | 0.35% | 11,59 B |
*Prepared on 11.25.2024 at 13:30 (UTC)
WHAT’S LEFT BEHIND
MicroStrategy Buys 55,500 BTC for $5.4 Billion
According to MicroStrategy’s most recent 8-K filing, the company purchased 55,500 Bitcoins with a total value of approximately $5.4 billion between November 18 and 24, 2024. The purchases were made at an average cost of $97,862 per Bitcoin. The company financed the transaction with funds from the issuance of convertible bonds and the sale of shares. This move stands out as one of the largest purchases in MicroStrategy’s Bitcoin accumulation strategy.
Eyes on MicroStrategy Again
In the last two weeks, MicroStrategy has attracted attention by buying 80,000 Bitcoins. The company’s founder, Michael Saylor, may be preparing to make another purchase. According to analyst Fred Krueger, MicroStrategy is also behind yesterday’s $2 billion USDT minting. Krueger suggests that the company could make a purchase of up to $12 billion this week, which could seriously boost the Bitcoin price.
Tim Cook: I’ve Owned Bitcoin for Three Years, But Apple Has No Plans to Enter the Crypto Market
In a recent interview, Apple CEO Tim Cook revealed that he has held Bitcoin for three years as part of his personal investment portfolio. However, Cook stated that this investment is purely personal and has nothing to do with Apple. He also emphasized that Apple has no plans to incorporate cryptocurrencies into its payment systems or company portfolios in the near future or in the future.
Solana Network’s Monthly DEX Trading Volume Exceeds $100 Billion
The Solana network’s decentralized exchange (DEX) surpassed $100 billion for the first time in November, reaching $109.8 billion. This is almost double the DEX trading volume on the Ethereum network and represents an increase of over 100% from $52.5 billion in October.
SUI and Franklin Templeton Partnership
SUI, one of the most prominent layer 1 blockchain projects in the crypto world, has formed a partnership with US asset management giant Franklin Templeton. With this partnership, Franklin Templeton’s digital assets subsidiary will support developers in the SUI ecosystem.
HIGHLIGHTS OF THE DAY
*There are no important calendar developments for the rest of the day.
INFORMATION
*The calendar is based on UTC (Coordinated Universal Time) time zone.
The economic calendar content on the relevant page is obtained from reliable news and data providers. The news in the economic calendar content, the date and time of the announcement of the news, possible changes in the previous, expectations and announced figures are made by the data provider institutions. Darkex cannot be held responsible for possible changes that may arise from similar situations.
MARKET COMPASS
After Trump’s selection of hedge fund manager Scott Bessent as Treasury Secretary, stock market indices rose. Bessent is thought to be in favor of balanced policies and close to crypto assets. Thus, in the face of Trump’s aggressive policies, Bessent could act as a stabilizer if the Senate confirms him. With the impact of this appointment, we saw the dollar and US treasury bond yields continue to decline during European trading.
There will be a short trading week due to Thanksgiving and markets will closely monitor the macro data from the US and the minutes of the last meeting of the Federal Open Market Committee (FOMC) later in the week.
From the short term to the big picture.
The victory of former President Trump on November 5, which was one of the main pillars of our bullish expectation for the long-term outlook in digital assets, produced a result in line with our forecasts. Despite Powell’s cautious messages in his last speech, the Fed’s continuation of the interest rate cut cycle, and the volume in BTC ETFs, indicating an increase in institutional investor interest (in addition to MicroStrategy’s BTC purchases, Microsoft’s start to evaluate the purchase, BlackRock’s BTC ETF options trading…), support our upside forecast for the big picture for now.
For the short term, given the nature of the market and pricing behavior, we think it would not be surprising to see occasional respite or pullbacks in digital assets. We also evaluate the movement we observed during the weekend transactions within this framework. At this point, it would be useful to underline again that fundamental dynamics remain bullish. While Bitcoin, the largest digital currency, extending each of its record highs may continue to whet the appetite of buyers to take new, upside positions, we will watch this group struggle with the masses who may want to take profit realizations and speculators who want to take advantage of potential declines after rapid rises.
TECHNICAL ANALYSIS
BTC/USDT
According to CoinShares’ latest weekly report, digital asset investment products recorded the largest weekly increase ever, with inflows totaling $3.13 billion last week. This brought total inflows to a new high of $37 billion since the start of the year. During this period, $3 billion was invested in Bitcoin-focused products, while $10 million was invested in Bitcoin short-selling products. It was also noted that total inflows have reached $15.2 billion since the FED cut interest rates for the first time in September.
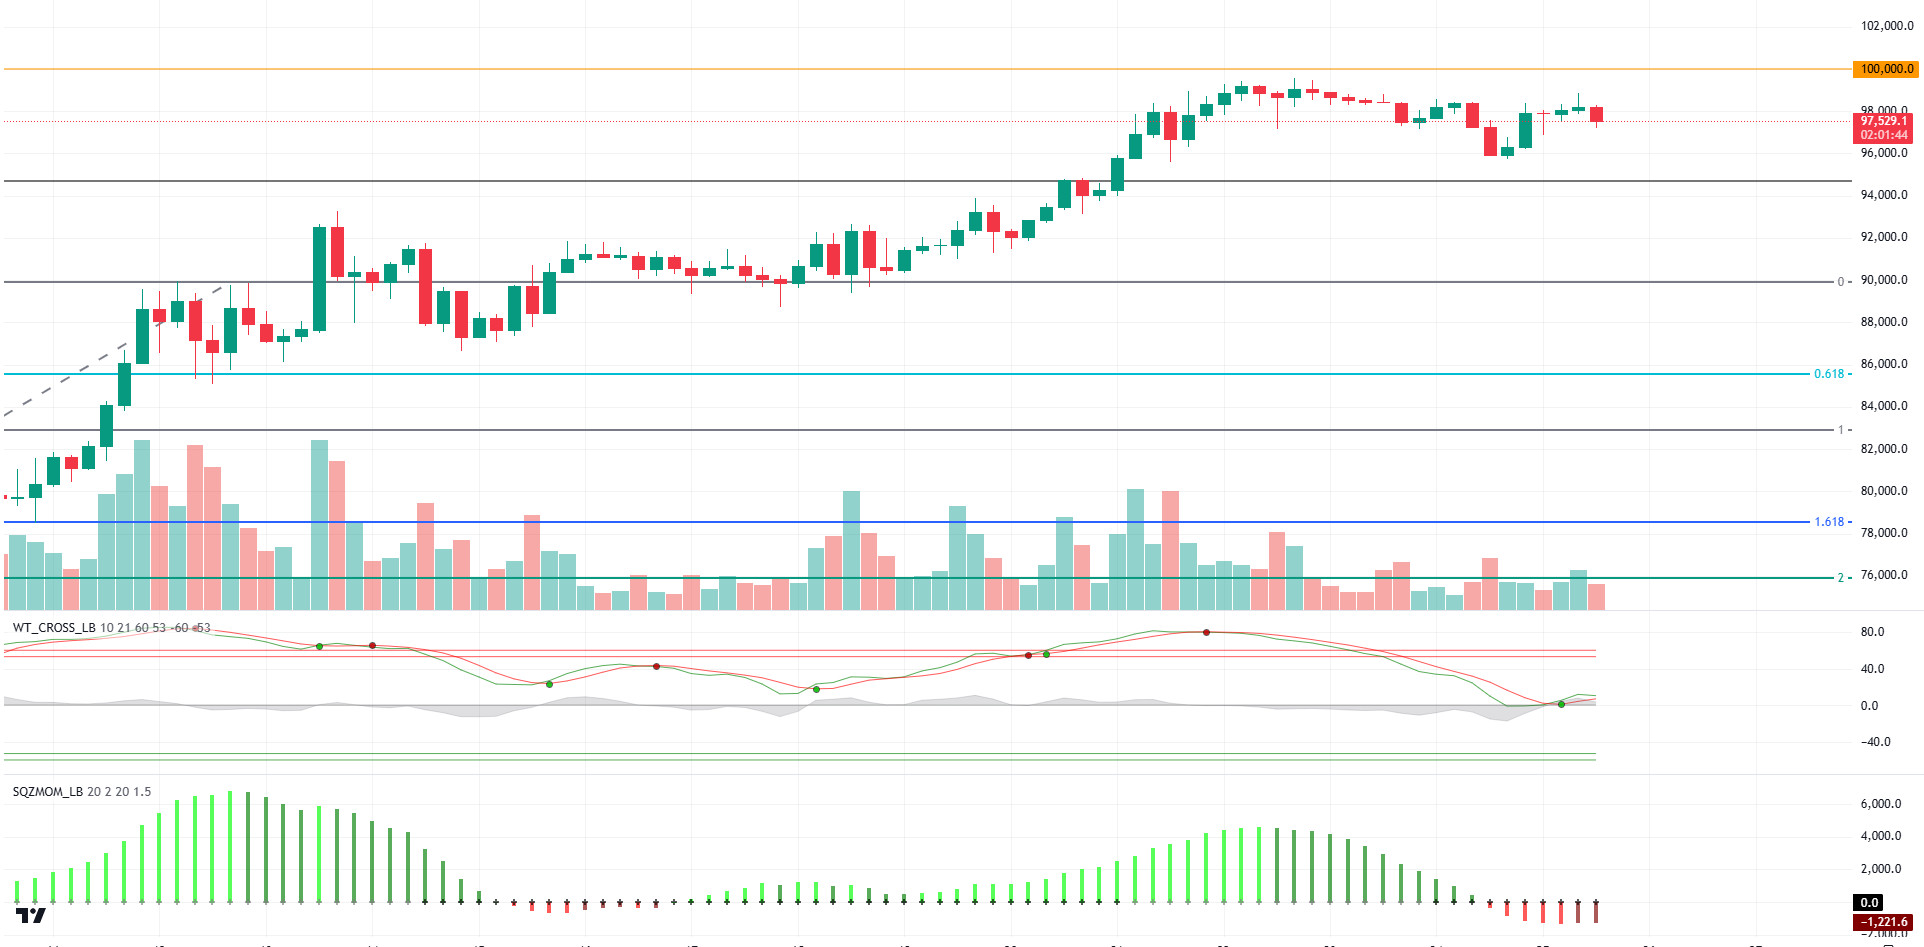
When we look at the technical outlook with the fund flow data, BTC, which reached 98,800 during the day, retreated a little and is currently trading at 97,500. As we mentioned earlier, the impact of fundamental factors on pricing overshadows technical analysis. While it is expected that the price will retreat with the weakening momentum on the hourly and oscillators giving a sell signal in the overbought zone on the daily, BTC continues its upward movements with Spot ETF investments and Microstrategy’s purchases and maintains a strong stance. The purchases to be made by institutional investors in the next period will determine the direction of the price, and the upward momentum may increase with the break of the psychological resistance level of 100,000.
Supports 95,000 – 92,500 – 90,000
Resistances 99,655 – 100,000 – 105,000
ETH/USDT
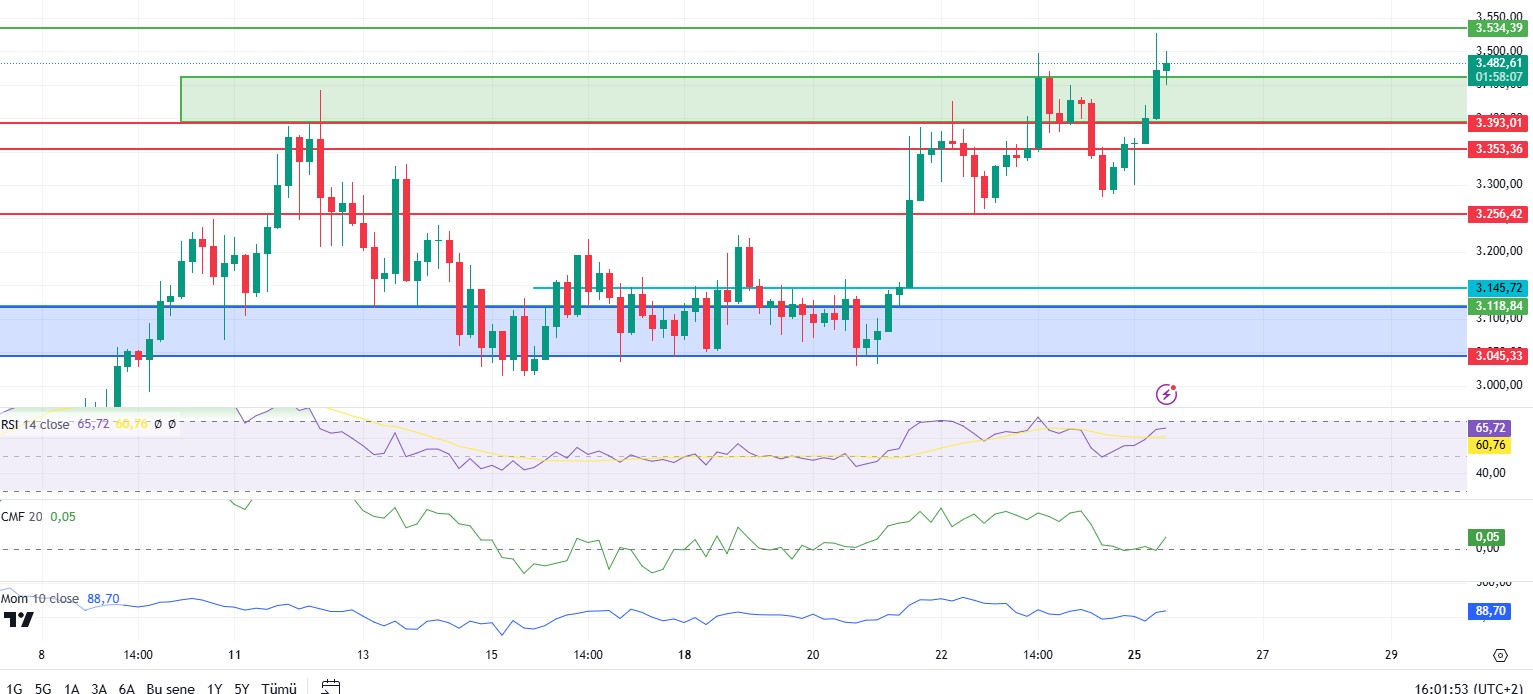
As mentioned in the morning analysis of ETH, with the positive outlook on the Relative Strength Index (RSI), it was able to exceed the 3,393 level and close above the green zone on the chart. Since this area is an important resistance zone, exceeding and closing above it may indicate that the rise may continue. The upward movement of the Chaikin Money Flow (CMF) level with the reaction from the zero level and the upward movement of the momentum again indicate that ETH may experience a very positive trend. Especially with the break of the 3,534 level, the movements can be expected to harden. Despite all this, the loss of the 3,393 region may create the possibility of a bull trap. In this case, pullbacks up to 3,256 levels may be seen.
Supports 3,393 – 3,353 – 3,256
Resistances 3,534 – 3,680 – 3,805
XRP/USDT
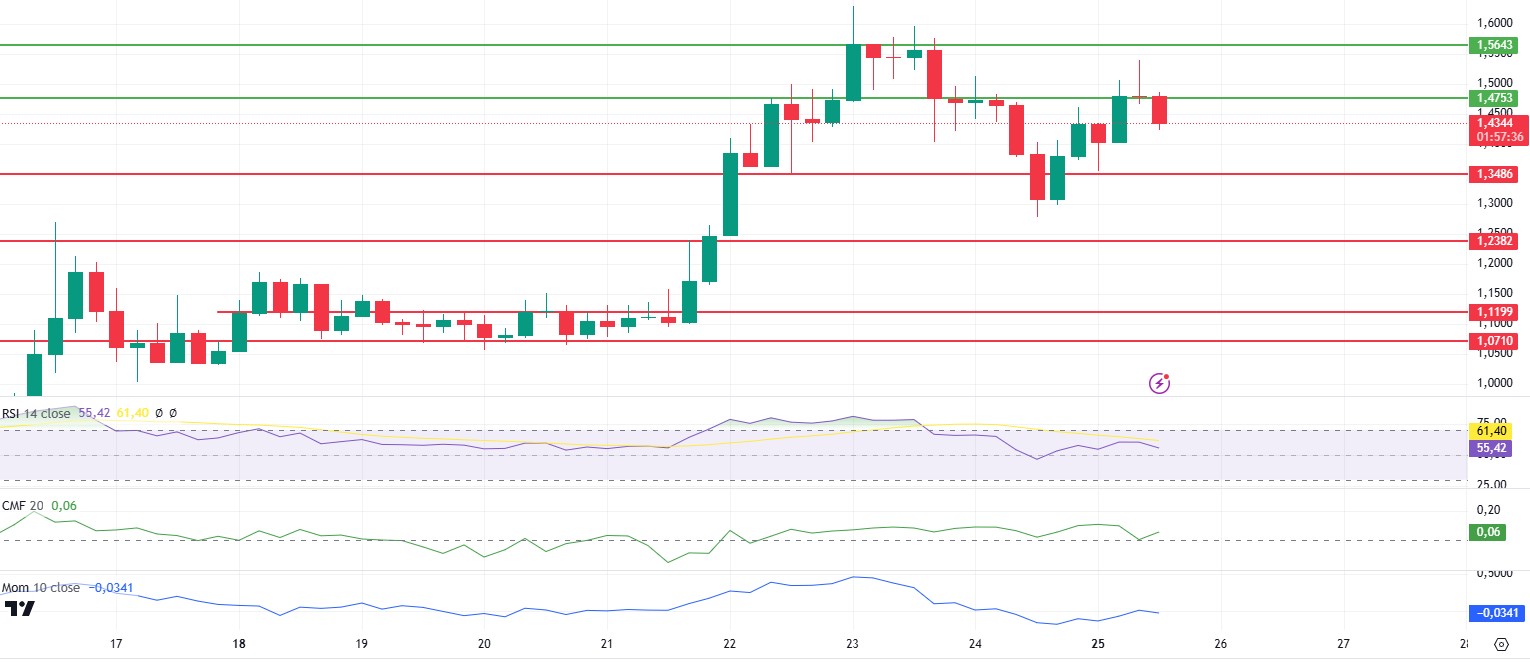
XRP has fallen below the 1.47 level with the selling pressure it experienced after the rise towards the 1.56 level during the day. With the loss of this region and the negative outlook on the Relative Strength Index (RSI), if the decline deepens, there may be a pullback to 1.34 levels. Momentum has also started its downward movement in support of the decline. Chaikin Money Flow (CMF), on the other hand, has started to move positively upwards again with the reaction it received from the zero zone. With the possible decline to 1.34 level, another attack to 1.56 level may come, provided that this level is not lost.
Supports 1.3486 – 1.2382 – 1.0710
Resistances 1.4753 – 1.5643 – 1.7043
SOL/USDT
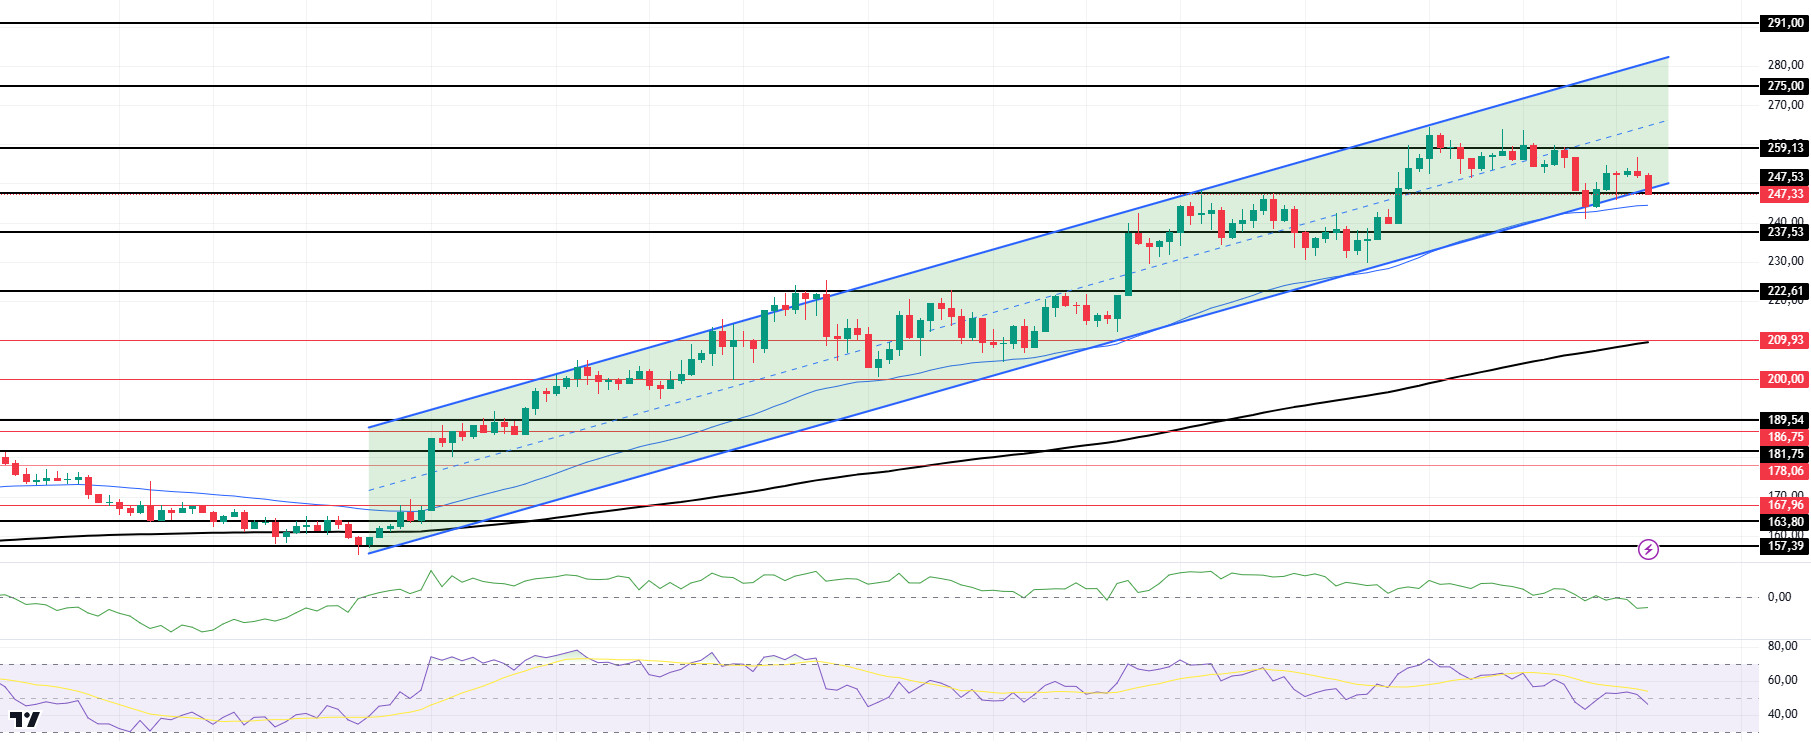
Solana (SOL) price started to lose value after the buying weakened. On the 4-hour timeframe, the 50 EMA (Blue Line) is above the 200 EMA (Black Line). Since November 4, SOL, which has been in an uptrend, continues to be priced by maintaining this trend. However, when we examine the Chaikin Money Flow (CMF)20 indicator, money inflows have turned negative after a long time, but there is a decline in inflows. At the same time, Relative Strength Index (RSI)14 remained below the mid-level. The 275.00 level appears to be a very strong resistance point in the rises driven by both macroeconomic conditions and innovations in the Solana ecosystem. If it breaks here, the rise may continue. In case of retracements due to possible macroeconomic reasons or profit sales, support levels 222.61 and 189.54 may be triggered again. If the price reaches these support levels, a potential bullish opportunity may arise if momentum increases.
Supports 247.53 – 237.53 – 222.61
Resistances 259.13 – 275.00 – 291.00
DOGE/USDT
JPMorgan warned that the Elon Musk-led Department of Government Efficiency (DOGE) will face significant obstacles, citing Congress’ control over spending. “On government efficiency, President-elect Trump is expected to pursue an agenda advocating less bureaucracy. Part of this includes a new Department of Government Efficiency (DOGE),” JPMorgan said, adding: “We think the Elon Musk-led department, which aims to reduce wasteful government spending, will struggle to do so.
After a big weekly rally, Dogecoin has disappointed investors with the price dropping in the last 24 hours. However, the memecoin still seems to be on track to test its all-time high. Will DOGE set a new record, or will it leave investors waiting for more? According to data from Santiment, DOGE’s trading volume fell by 15%. However, DOGE’s Funding Ratio increased, indicating that derivative traders are actively buying memecoin at its discounted price.
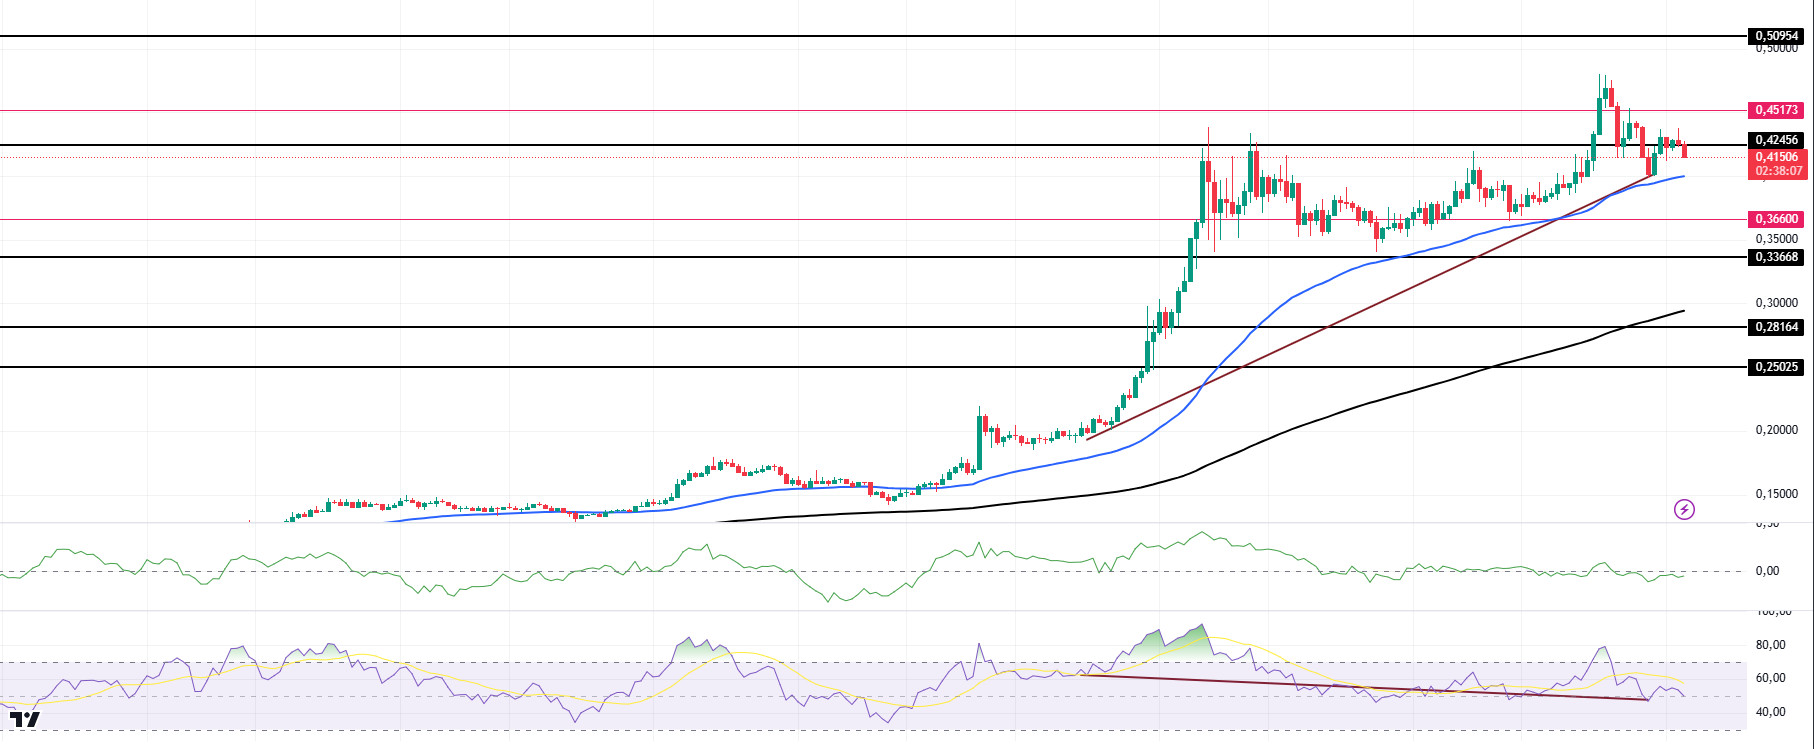
Technically, there seems to be a bullish divergence between Relative Strength Index (RSI) 14 and the chart. If this works, 0.58043 may be the target location. On the 4-hour timeframe, the 50 EMA (Blue Line) is above the 200 EMA (Black Line). But the gap between the two averages is still too wide. This may cause pullbacks. At the same time, RSI 14 has moved from overbought to neutral. However, when we examine the Chaikin Money Flow (CMF)20 indicator, it has turned negative. This shows us that there are money outflows. The 0.50954 level is a very strong resistance point in the rises driven by both macroeconomic conditions and innovations in the Doge coin. If DOGE maintains its momentum and rises above this level, the rise may continue strongly. In case of retracements due to possible macroeconomic reasons or profit sales, the support levels of 0.36600 and 0.33668 can be triggered again. If the price hits these support levels, a potential bullish opportunity may arise if momentum increases.
Supports 0.36600 – 0.33668 – 0.28164
Resistances 0.42456 – 0.45173 – 0.50954
LEGAL NOTICE
The investment information, comments and recommendations contained herein do not constitute investment advice. Investment advisory services are provided individually by authorized institutions taking into account the risk and return preferences of individuals. The comments and recommendations contained herein are of a general nature. These recommendations may not be suitable for your financial situation and risk and return preferences. Therefore, making an investment decision based solely on the information contained herein may not produce results in line with your expectations.


