MARKET SUMMARY
Latest Situation in Crypto Assets
| Assets | Last Price | 24h Change | Dominance | Market Cap |
|---|---|---|---|---|
| BTC | 107,320.24$ | 3.43% | 56.35% | 2,13 T |
| ETH | 4,009.61$ | 2.98% | 12.81% | 482,76 B |
| XRP | 2.671$ | 12.46% | 4.04% | 152,60 B |
| SOLANA | 223.65$ | 3.59% | 2.84% | 107,28 B |
| DOGE | 0.4087$ | 3.31% | 1.59% | 60,04 B |
| CARDANO | 1.1040$ | 4.16% | 1.03% | 38,78 B |
| TRX | 0.2949$ | 6.19% | 0.67% | 25,38 B |
| AVAX | 50.76$ | 4.70% | 0.55% | 20,76 B |
| LINK | 28.53$ | -3.16% | 0.47% | 17,89 B |
| SHIB | 0.00002741$ | 2.26% | 0.43% | 16,12 B |
| DOT | 8.898$ | 2.51% | 0.36% | 13,63 B |
*Prepared on 12.17.2024 at 14:00 (UTC)
WHAT’S LEFT BEHIND
Mt. Gox Management Made New Bitcoin Transfers
Mt. Gox exchange continues its first summer distributions nearly 10 years after its bankruptcy. With the new transfers made this morning, there was a total of more than 170 million dollars in Bitcoin activity.
Bitcoin at Historic High Against Gold
Bitcoin, which has increased by about 40 thousand dollars since the beginning of November, has also gained a historic value against gold. The ratio showing the amount of gold that can be bought with 1 Bitcoin has reached unprecedented levels.
Tether Invests in European Stablecoin Provider StablR
Tether announced an investment in StablR in an effort to accelerate stablecoin adoption in Europe. StablR will simplify the tokenization process of assets using Hadron, Tether’s new tokenization platform.
Bitcoin Strategic Reserve Called for in the European Parliament
Sarah Knafo, a member of the European Parliament, has proposed to consider Bitcoin as a strategic reserve asset. In her speech in Parliament, she opposed the digital euro and emphasized the importance of Europe creating a Bitcoin strategic reserve.
Michael Saylor: MicroStrategy’s Bitcoin Return 72.4
MicroStrategy co-founder Michael Saylor announced that the company returned 136,965 Bitcoin in net earnings to shareholders. At a price of $107,000 per Bitcoin, this equates to about $14.66 billion.
ESMA Publishes Final Guidance for MiCA Regulations
The European Securities and Markets Authority (ESMA) has published guidance on the implementation of the MiCA regulations. However, delays in implementation are expected in some EU countries as the legislative development process is not yet complete.
Bitcoin’s Protection Against Quantum Threat Could Take More Than 300 Days
According to a university study, Bitcoin could require a downtime of between 76 and 305 days to defend against quantum computing. During this period, mining and trading could slow down.
HIGHLIGHTS OF THE DAY
Important Economic Calender Data
*There is no important calendar data for the rest of the day
INFORMATION:
*The calendar is based on UTC (Coordinated Universal Time) time zone.
The economic calendar content on the relevant page is obtained from reliable news and data providers. The news in the economic calendar content, the date and time of the announcement of the news, possible changes in the previous, expectations and announced figures are made by the data provider institutions. Darkex cannot be held responsible for possible changes that may arise from similar situations.
MARKET COMPASS
The victory of former President Trump on November 5, which was one of the main pillars of our bullish expectation for the long-term outlook in digital assets, produced a result in line with our predictions. Afterwards, the appointments made by the president-elect and the expectations of increased regulation of the crypto ecosystem in the US continued to take place in our equation as a positive variable. Although Powell gave cautious messages in his last speech, the continuation of the FED’s interest rate cut cycle and the volume in BTC ETFs indicating an increase in institutional investor interest (in addition to MicroStrategy’s BTC purchases, BlackRock’s BTC ETF options started trading…) support our upward forecast for the big picture for now.
In the short term, given the nature of the market and pricing behavior, we think it would not be surprising to see occasional pauses or pullbacks in digital assets. However, at this point, it is worth emphasizing again that the fundamental dynamics continue to be bullish.
TECHNICAL ANALYSIS
BTC/USDT
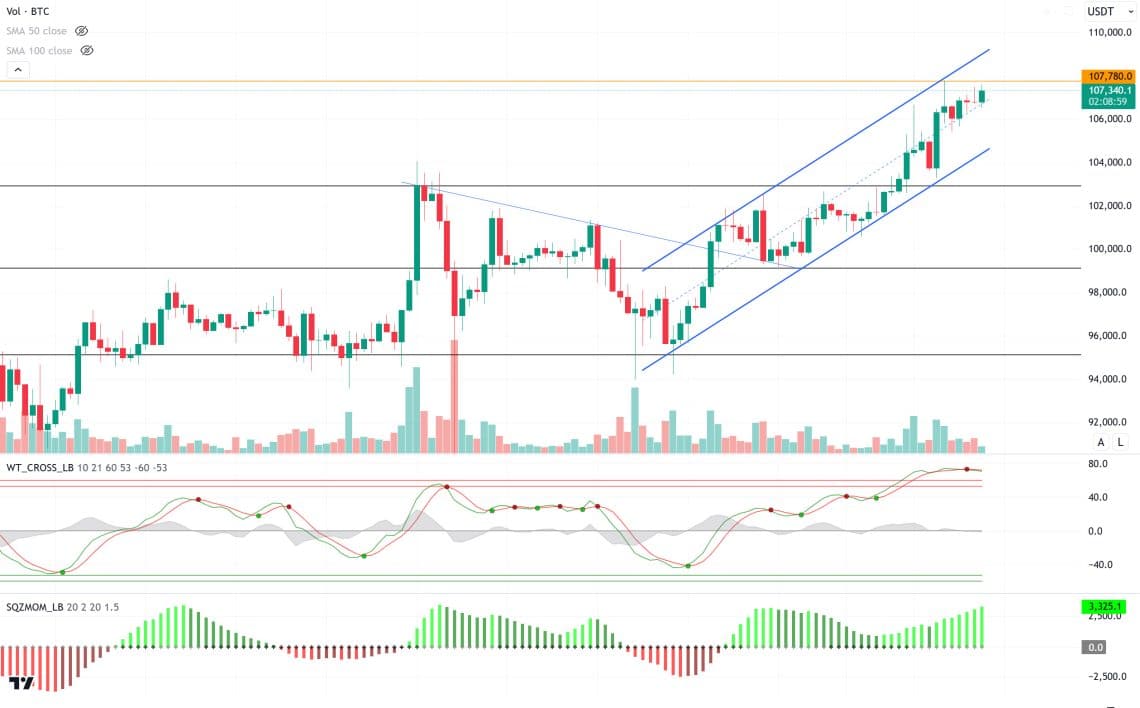
We are witnessing a historic period for Bitcoin. The total value of assets under the management of Bitcoin ETFs in the US has reached $129.3 billion, surpassing gold ETFs with assets of $128.9 billion. Although gold has a first-mover advantage of nearly 20 years, it has lost this advantage in the face of Bitcoin’s rise. Bitcoin, which has increased by about 40 thousand dollars since the beginning of November, has also achieved a significant historical success against gold. Accordingly, while there has been a marked improvement in market sentiment, large Bitcoin transfers originating from Mt.Gox, which could create volatility in the market in the past, are now less important due to the current optimistic atmosphere. Bitcoin continues to open the doors to a new era with its rise in market capitalization and its impact on the global regulatory framework.
Looking at the technical outlook with all these developments, BTC continues to discover new highs within the rising trend channel. Currently trading at 107,300, BTC is moving around its recent ATH level. As we have mentioned many times before, the fact that technical oscillators are in the overbought zone does not reduce the upward momentum in BTC price depending on fundamental developments. In a new ATH attempt, the 108,600 level, where the trend top line crosses, may be tested. In case of a possible pullback, we will follow the 104,500 support level in case of a breakout while the trend midline acts as support.
Supports: 104,500 – 102,900 – 101,400
Resistances 107,780 – 108,600 – 110,000
ETH/USDT
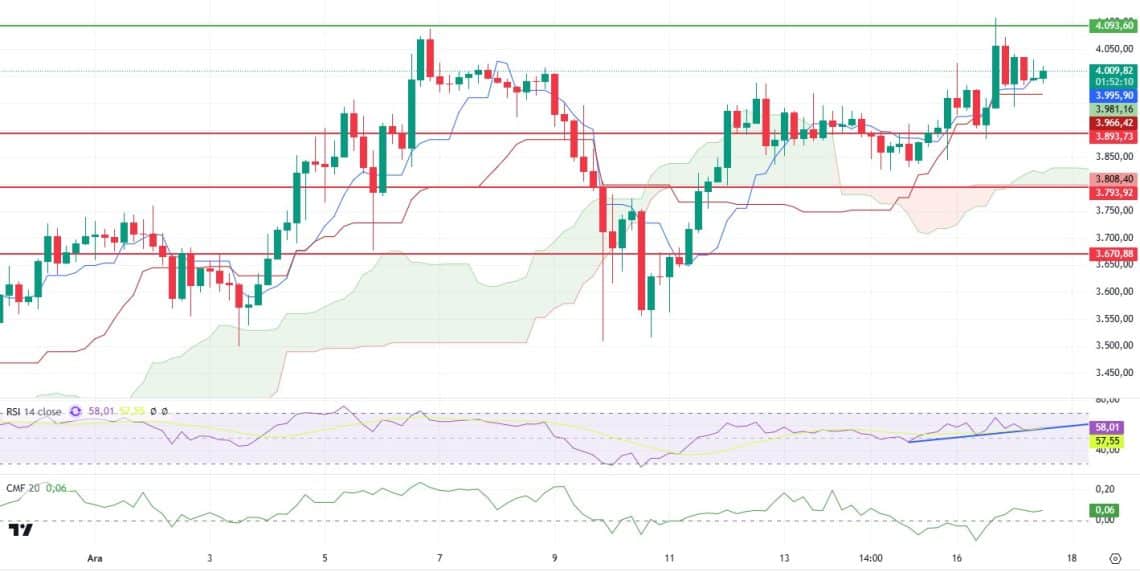
Ethereum (ETH) is following a horizontal and low-volume course during the day. The price, which retreated from $ 4,100 levels after the Ethereum Foundation’s 100 ETH sale yesterday, manages to hold above the $ 4,000 level.
When we look at technical indicators; The rise in Ichimoku Cloud and Tenkan Sen levels draws attention. The fact that the Funding Rate remains below 0.02 and the Cumulative Volume Delta (CVD) data shows a strong stance on the spot side supports the positive outlook. Maintaining the uptrend on Relative Strength Index (RSI) and showing a slight upward trend is also an important positive signal.
4,000 dollars and the Kijun Sen level of 3,966 stand out as a critical intermediate support area. As long as it stays above these levels, upward movements can be expected to continue. 4,093 dollars stands out as an important resistance zone. A break above this level could move the price to stronger and momentum increases.
On the other hand, closes below $3,960 could trigger deeper declines. As a result, in order for Ethereum to continue its upward movement in the short term, it is critical to maintain the support of $ 4,000 and exceed the resistance of $ 4,093.
Supports 3,893 – 3,793 – 3,670
Resistances 4,093 – 4,299 – 4,440
XRP/USDT
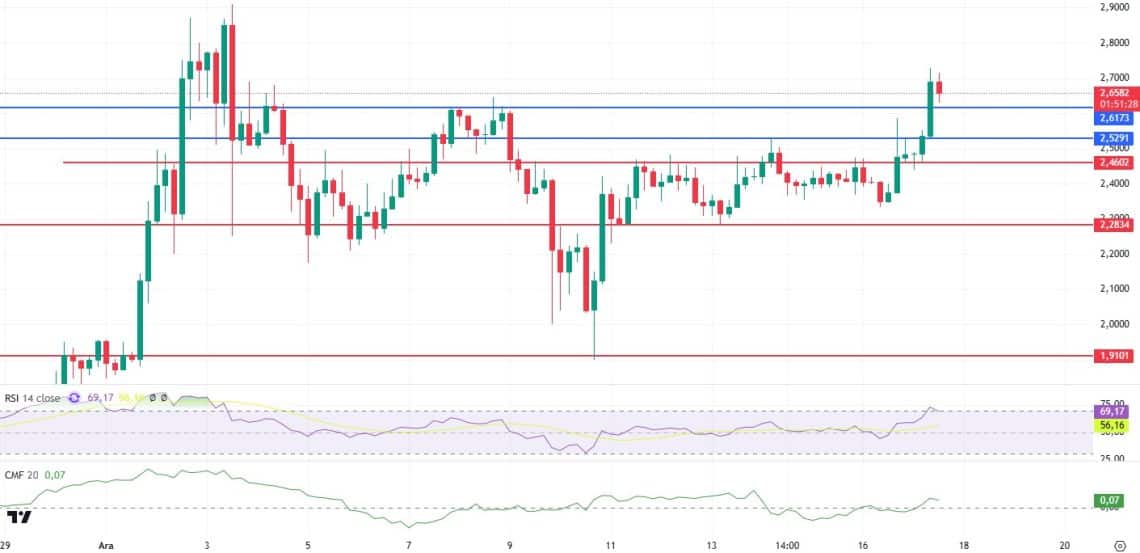
As mentioned in the morning analysis, XRP rose above the 2.61 level to 2.72, accompanied by a positive technical outlook. However, with the selling pressure from here, there was a retreat towards the 2.64 level again. In addition, MoonPay’s ability to purchase RLUSD via Apple Pay stood out as an important positive development for XRP.
When we look at the technical indicators, it is noteworthy that the Relative Strength Index (RSI) rose to the overbought level and then moved downwards. Similarly, a similar structure has been formed on Chaikin Money Flow (CMF). In line with these indicators, the price can be expected to make a re-test towards the 2.61 level and then continue its uptrend.
However, it should be noted that if 2.61 support is lost, selling pressure may increase and pull the price back to 2.47. Holding above the 2.61 level is critical to sustain the rise.
Supports 2.4710 – 2.2741- 1.1484
Resistances 2.5398 – 2.6567 – 2.8456
SOL/USDT
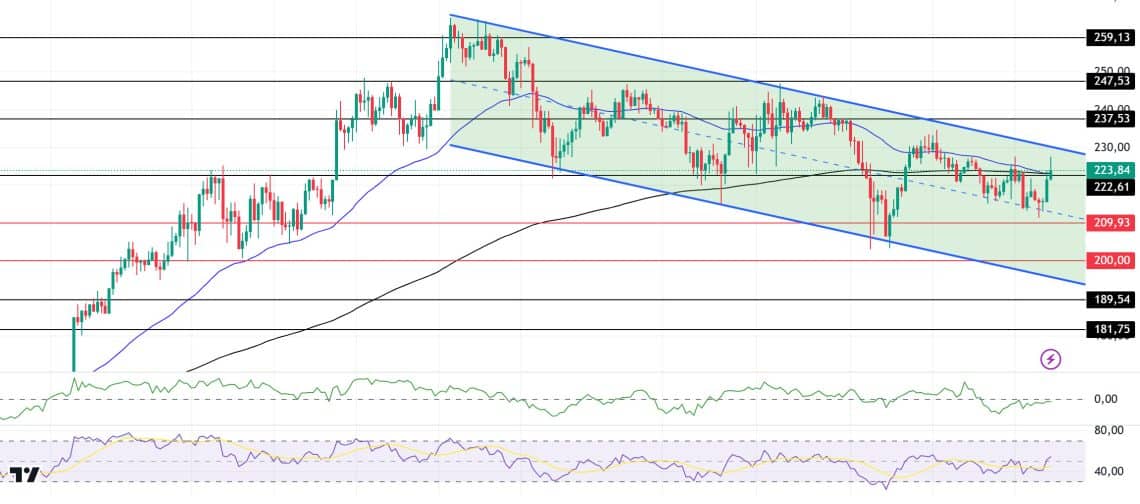
SOL has turned bullish, keeping pace with today’s market rally. The asset, which is in the middle of a broad downtrend, is moving towards the upper level of the trend by increasing volume. On the 4-hour timeframe, the 50 EMA (Blue Line) coincided with the 200 EMA (Black Line). Will it end the bull in this asset? This will depend on the overall market direction and how investors and traders will take action going forward, but the metrics do not point to a definite direction at the moment. Although there is upside momentum from the support level, the asset continues to be priced within the downtrend. When we examine the Chaikin Money Flow (CMF)20 indicator, although money inflows increase, the neutral trend continues. However, Relative Strength Index (RSI)14 is moving from the neutral zone to the overbought zone. The 237.53 level stands out as a very strong resistance point in the rises driven by both the upcoming macroeconomic data and the news in the Solana ecosystem. If it breaks here, the rise may continue. In case of retracements for the opposite reasons or due to profit sales, the support levels of 189.54 and 181.75 can be triggered again. If the price hits these support levels, a potential bullish opportunity may arise if momentum increases.
Supports 222.61 – 209.93 – 200.00
Resistances 237.53 – 247.53 – 259.13
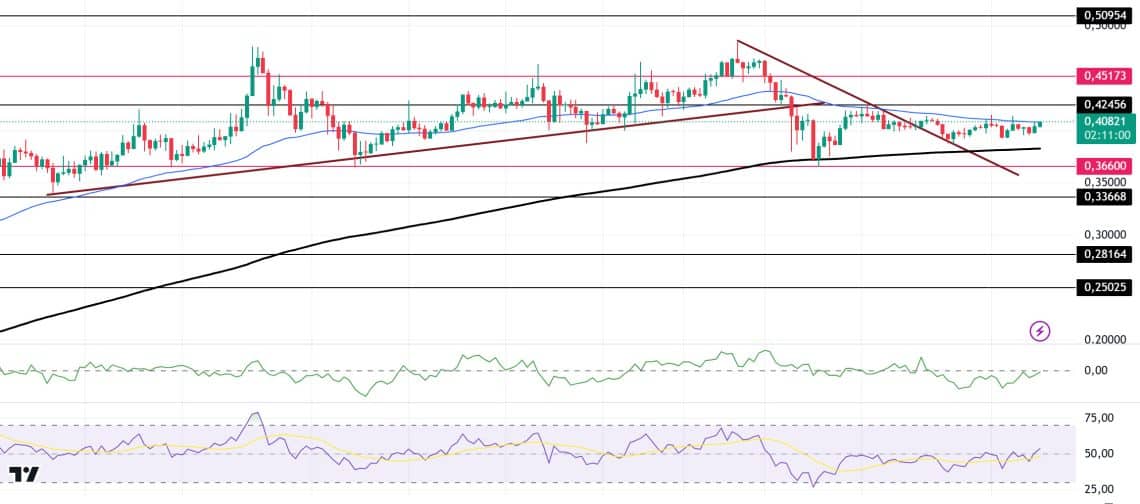
DOGE/USDT
Musk recently hinted that he would include Dogecoin in an upcoming X monetization deal that could see X payments use cryptocurrencies, including Dogecoin, to pay its creators. This caused the asset to rebound slightly.
DOGE successfully unwound from overbought levels. Relative Strength Index (RSI) 14 on the chart returned to the neutral zone. This suggests that the token has relieved the overbought pressure and paved the way for another potential leg upwards. Since December 8, the asset has been in a downtrend and although BTC moved sideways, reversing the downtrend due to the usual bullishness in the market, it failed to break the 0.42456 level to the downside. The price is currently testing the 50 EMA as resistance. On the 4-hour timeframe, the 50 EMA (Blue Line) is above the 200 EMA (Black Line). However, when we examine the Chaikin Money Flow (CMF)20 indicator, there is a small amount of money outflows and suppresses the price. The 0.50954 level stands out as a very strong resistance point in the rises driven by both the upcoming macroeconomic data and the innovations in the Doge coin. If DOGE maintains its momentum and rises above this level, the rise may continue strongly. In case of possible retracements due to macroeconomic reasons or negativities in the ecosystem, the 0.33668 support level is an important support level. If the price reaches these support levels, a potential bullish opportunity may arise if momentum increases.
Supports 0.36600 – 0.33668 – 0.28164
Resistances 0.42456 – 0.45173 – 0.50954
LEGAL NOTICE
The investment information, comments and recommendations contained herein do not constitute investment advice. Investment advisory services are provided individually by authorized institutions taking into account the risk and return preferences of individuals. The comments and recommendations contained herein are of a general nature. These recommendations may not be suitable for your financial situation and risk and return preferences. Therefore, making an investment decision based solely on the information contained herein may not produce results in line with your expectations.