MARKET SUMMARY
Latest Situation in Crypto Assets
| Assets | Last Price | 24h Change | Dominance | Market Cap |
|---|---|---|---|---|
| BTC | 104,797.47 | -2.40% | 56.67% | 2,07 T |
| ETH | 3,857.46 | -3.75% | 12.70% | 465,12 B |
| XRP | 2.541 | -4.77% | 3.97% | 145,50 B |
| SOLANA | 217.05 | -3.04% | 2.84% | 104,13 B |
| DOGE | 0.3847 | -5.64% | 1.55% | 56,77 B |
| CARDANO | 1.0332 | -6.40% | 0.99% | 36,28 B |
| TRX | 0.2720 | -7.59% | 0.64% | 23,49 B |
| AVAX | 46.30 | -8.59% | 0.52% | 19,07 B |
| LINK | 27.07 | -5.22% | 0.46% | 17,00 B |
| SHIB | 0.00002563 | -6.30% | 0.41% | 15,11 B |
| DOT | 8.205 | -7.96% | 0.34% | 12,56 B |
*Prepared on 12.18.2024 at 14:00 (UTC)
WHAT’S LEFT BEHIND
MicroStrategy Allegedly May Suspend Bitcoin Purchases in January
It has been suggested that MicroStrategy may temporarily halt Bitcoin purchases in January next year due to an internal trading control period. This could cause concern among long-term investors who expect the company to buy Bitcoin every week.
Net Inflows to Bitcoin and Ethereum Spot ETFs Hit Record Highs
As of December 17, Bitcoin spot ETFs saw total net inflows of $494 million and Ethereum spot ETFs saw net inflows of $145 million. BlackRock ETFs IBIT and ETHA saw the highest daily inflows at $741 million and $135 million, respectively.
HIGHLIGHTS OF THE DAY
Important Economic Calender Data
| Time | News | Expectation | Previous |
|---|---|---|---|
| 19:00 | US FOMC Economic Projections | – | – |
| 19:00 | US FOMC Statement | – | – |
| 19:00 | US FED Interest Rate Decision | 4.50% | 4.75% |
| 19:30 | US FOMC Press Conference | – | – |
INFORMATION
*The calendar is based on UTC (Coordinated Universal Time) time zone.
The economic calendar content on the relevant page is obtained from reliable news and data providers. The news in the economic calendar content, the date and time of the announcement of the news, possible changes in the previous, expectations and announced figures are made by the data provider institutions. Darkex cannot be held responsible for possible changes that may arise from similar situations.
MARKET COMPASS
Bitcoin, which renewed its record during European transactions yesterday, recorded a retreat afterwards. Today, we saw these declines limited in the European session. Indices on the continent are slightly positive today despite political turmoil. US futures contracts are flat ahead of critical Federal Reserve (FED) decisions. It is almost certain that the Bank will decide to cut interest rates.
In the rest of the day, the decisions of the FED, which will guide prices and determine short-term pricing behavior, will be closely monitored. Click here to review our evaluations on the subject.
From the short term to the big picture.
The victory of former President Trump on November 5, which was one of the main pillars of our bullish expectation for the long-term outlook in digital assets, produced a result in line with our predictions. Afterwards, the appointments made by the president-elect and the expectations of increased regulation of the crypto ecosystem in the US continued to take place in our equation as a positive variable. Although Powell gave cautious messages in his last speech, the continuation of the FED’s interest rate cut cycle and the volume in BTC ETFs indicating an increase in institutional investor interest (in addition to MicroStrategy’s BTC purchases, BlackRock’s BTC ETF options started trading…) support our upward forecast for the big picture for now.
In the short term, given the nature of the market and pricing behavior, we think it would not be surprising to see occasional pauses or pullbacks in digital assets. However, at this point, it is worth emphasizing again that the fundamental dynamics continue to be bullish.
TECHNICAL ANALYSIS
BTC/USDT
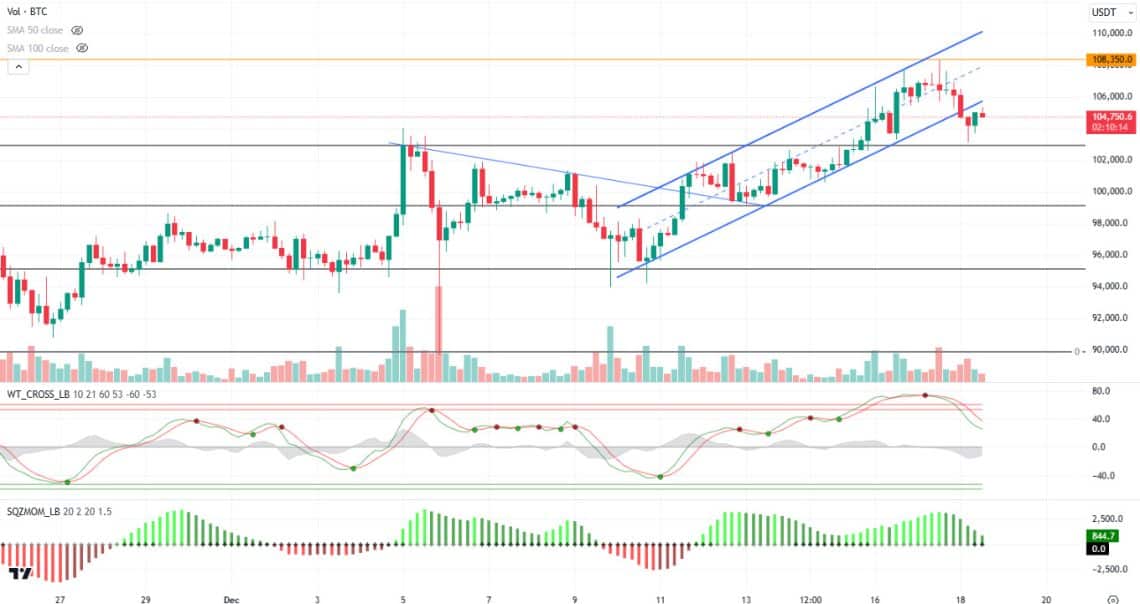
News that the US is considering holding a strategic Bitcoin reserve continues to have a ripple effect on the market. Bitcoin tested new ATH levels as US Senator Cynthia Lummis said that 2025 will be the year of the crypto sector. “This will be the most pro-digital asset administration ever,” Lummis said in a post on X.
When we look at the BTC technical outlook before the FED interest rate meeting with the latest development, the price, which broke the rising trend channel downwards during the day, fell to 103,200 levels. As of now, the rebounding price is trading at 104,800. While our technical oscillator maintains its sell signal, the momentum indicator shows a very weak image in the positive zone. While the minor support level of 103,500 point is monitored in the retracement, we will follow the 102,900 point as the decline deepens. In the continuation of the rise, the trend upper line can be targeted as the price is included in the rising trend channel. Eyes will turn to the FED interest rate decision this evening and then chairman Powell’s statements. Although a 25 basis point rate cut is seen as certain, Powell’s emphasis on pauses in interest rate cuts for 2025 may stand out as a factor that increases volatility on the market.
Supports: 103,500 – 102,900 – 101,400
Resistances 104,500 – 106,600 – 108,350
ETH/USDT
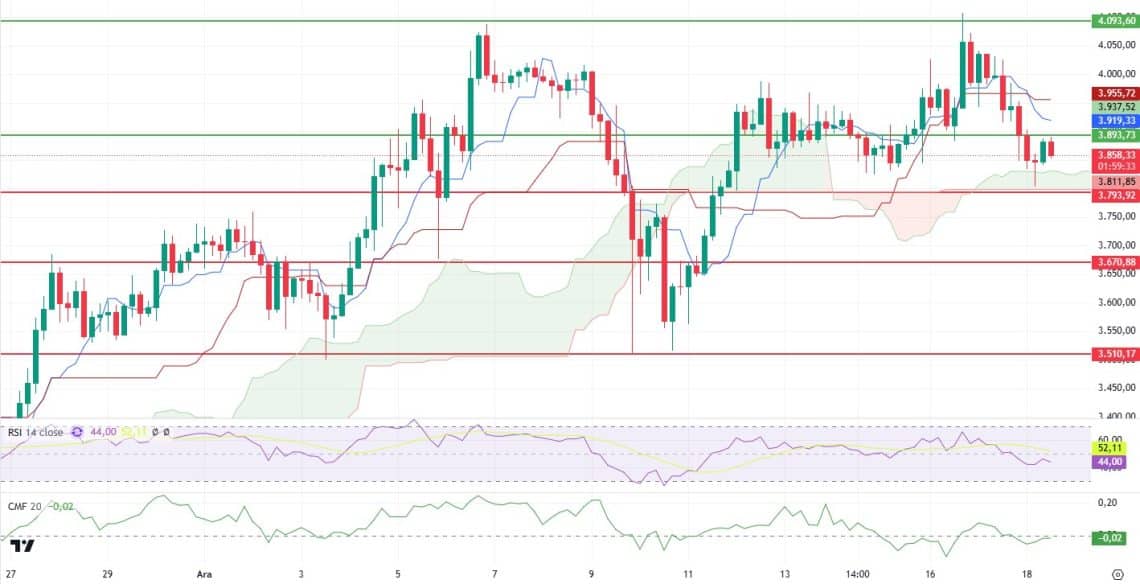
Ethereum managed to rise to the level of $ 3,893, taking the expected reaction from the Ichimoku cloud support during the day. However, the selling pressure encountered at this critical level pulled the price down again, leading to a short-term pullback. During this price action, the Chaikin Money Flow (CMF) indicator rose as high as zero, signaling an increase in money entering the market and the start of a positive momentum. The Relative Strength Index (RSI), on the other hand, remains negative and has yet to signal a rebound.
From a technical perspective, the Ichimoku indicator generates a sell signal, indicating that the bearish trend remains dominant in the short term. In order for Ethereum to regain a positive outlook, it first needs to sustain above the $3,893 level and converge towards the Tenkan-sen level. If it fails to hold above this level, ETH is likely to face selling pressure again and fall towards the $3,793 level.
In particular, a break of 3,793 support could deepen the downward movement further, leading to a test of lower support levels. In such a scenario, it would be critical for traders to keep an eye on stronger support zones. To summarize, in the short term, ETH’s price performance depends on whether the $3,893 resistance can be breached and sustained. In the opposite scenario, it seems likely that downside risks will increase and the search for new support will be on the agenda.
Supports 3,793 – 3,670 – 3,510
Resistances 3,893 – 4,093 – 4,299
XRP/USDT
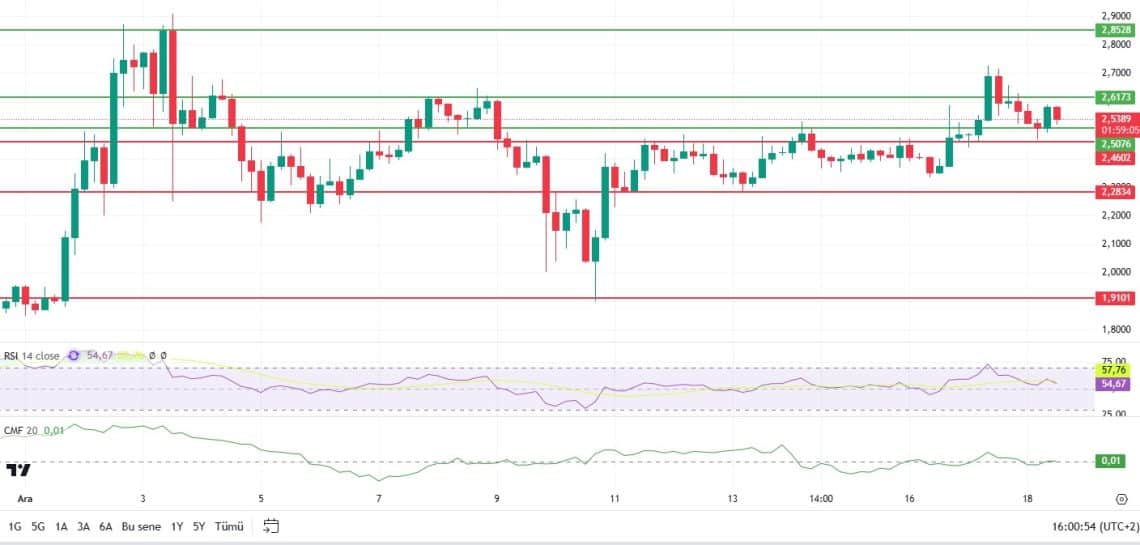
The news that Ripple USD (RLUSD) will be listed on global exchanges triggered a significant rise in the XRP price. However, the retreat in Bitcoin pushed the XRP price down to $2.46. Thanks to the purchases from this level, the price rose above $ 2.50, but the 4-hour charts indicate that momentum is weakening.
Technically, the Relative Strength Index (RSI) indicator continues its downward movement and is not yet signaling a rebound. This suggests that the price is in a neutral to weak range. Moreover, the Chaikin Money Flow (CMF) indicator is also in negative territory, highlighting the lack of cash inflows in the market. These negative signals suggest that buyers are struggling to gain strength in the current price range.
The $2.47 level is a critical support point for XRP in the short term. If this level is maintained, the price may be more likely to test the 2.61 resistance level. In particular, a break of the $2.55 level could drive the price to higher levels, allowing buyers to gain strength. However, if the support of $ 2.47 is lost, the price can be expected to fall to $ 2.43 with increased selling pressure. Closures below this level may lower the price to the $ 2.40 band.
As a result, XRP’s short-term performance largely depends on the maintenance of the $2.47 support. Positive news and market dynamics may move the price up, while weak momentum and loss of support level may cause the price to retreat further.
Supports 2.4710 – 2.2741- 1.1484
Resistances 2.5076 – 2.6567 – 2.8456
SOL/USDT
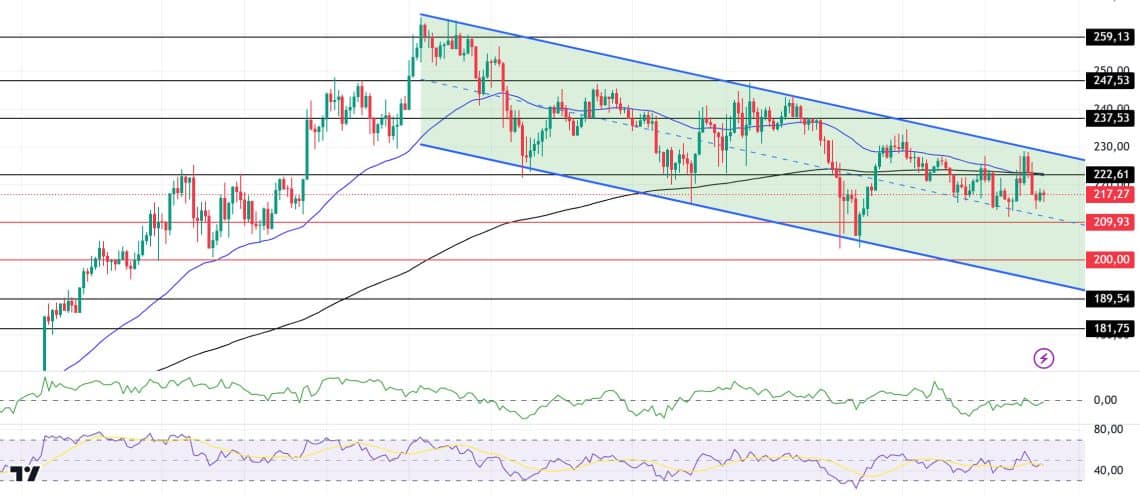
In ecosystem developments, Bitwise has launched a Solana Staking ETP (BSOL) in Europe. This new product is designed to address the previous lack of staking rewards of Bitwise’s Solana ETP, ESOL. BSOL offers a stake reward rate of 6.48%.
SOL has turned bearish, keeping pace with the market’s decline. At the same time, trading volume has increased by almost 39% compared to the last 24 hours. The asset, which is in the middle of a broad downtrend, is moving towards the bottom of the trend as the volume declines. On the 4-hour timeframe, the 50 EMA (Blue Line) coincided with the 200 EMA (Black Line). Will this end the bull in this asset? This will depend on the overall market direction and how investors and traders take action going forward, but the metrics do not point to a definite direction at the moment. Although there is downward momentum from the resistance level, the asset continues to be priced within the downtrend. When we analyze the Chaikin Money Flow (CMF)20 indicator, the increase in money outflows increases selling pressure. However, Relative Strength Index (RSI)14 is moving from the neutral zone to the oversold zone. The 237.53 level stands out as a very strong resistance point in the rises driven by both the upcoming macroeconomic data and the news in the Solana ecosystem. If it breaks here, the rise may continue. In case of retracements for the opposite reasons or due to profit sales, the support levels of 189.54 and 181.75 can be triggered again. If the price hits these support levels, a potential bullish opportunity may arise if momentum increases.
Supports 209.93 – 200.00 – 189.54
Resistances 222.61 – 237.53 – 247.53
DOGE/USDT
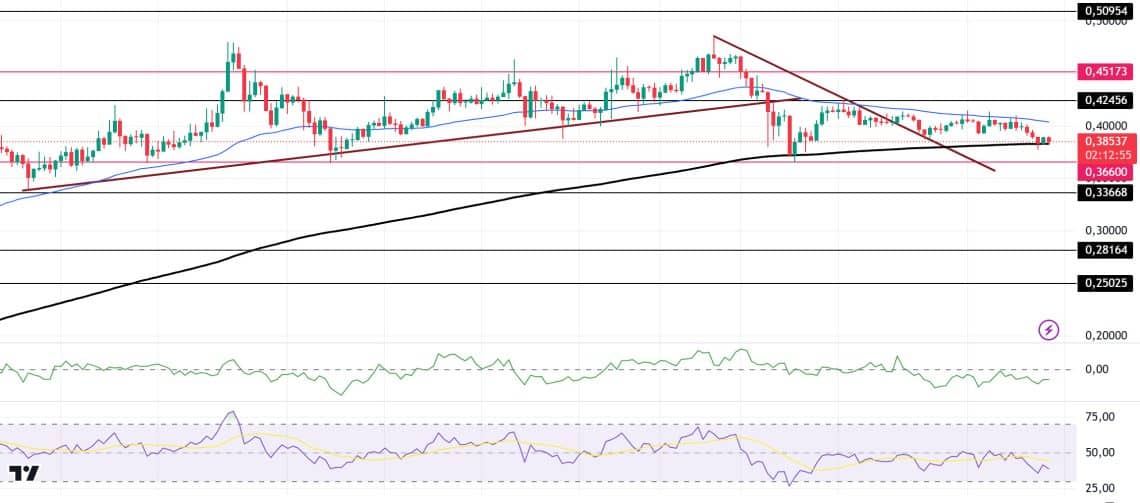
BTC, which has been in a downtrend since December 8, moved horizontally by changing the downtrend due to the usual rises in the market, but could not prevent it from breaking the 0.42456 level downwards. The price is currently testing the 200 EMA (Black Line) as support. On the 4-hour timeframe, the 50 EMA (Blue Line) is above the 200 EMA (Black Line). However, when we examine the Chaikin Money Flow (CMF)20 indicator, there are money outflows and suppressing the price. The 0.50954 level stands out as a very strong resistance point in the rises driven by both the upcoming macroeconomic data and the innovations in the Doge coin. If DOGE maintains its momentum and rises above this level, the rise may continue strongly. In case of possible retracements due to macroeconomic reasons or negativities in the ecosystem, the 0.33668 support level is an important support level. If the price reaches these support levels, a potential bullish opportunity may arise if momentum increases.
Supports 0.36600 – 0.33668 – 0.28164
Resistances 0.42456 – 0.45173 – 0.50954
LEGAL NOTICE
The investment information, comments and recommendations contained herein do not constitute investment advice. Investment advisory services are provided individually by authorized institutions taking into account the risk and return preferences of individuals. The comments and recommendations contained herein are of a general nature. These recommendations may not be suitable for your financial situation and risk and return preferences. Therefore, making an investment decision based solely on the information contained herein may not produce results in line with your expectations.
