MARKET SUMMARY
Latest Situation in Crypto Assets
| Assets | Last Price | 24h Change | Dominance | Market Cap. |
|---|---|---|---|---|
| BTC | 97,383.57 | -3.76% | 57.94% | 1,92 T |
| ETH | 3,365.91 | -8.52% | 12.15% | 403,90 B |
| XRP | 2.281 | -3.11% | 3.89% | 129,47 B |
| SOLANA | 191.77 | -8.80% | 2.74% | 91,07 B |
| DOGE | 0.3181 | -12.01% | 1.39% | 46,40 B |
| CARDANO | 0.8866 | -9.57% | 0.93% | 31,09 B |
| TRX | 0.2479 | -6.17% | 0.64% | 21,36 B |
| AVAX | 38.90 | -8.62% | 0.48% | 15,92 B |
| LINK | 22.79 | -7.27% | 0.43% | 14,16 B |
| SHIB | 0.00002197 | -8.65% | 0.39% | 12,84 B |
| DOT | 6.989 | -8.16% | 0.32% | 10,62 B |
*Prepared on 12.20.2024 at 07:00 (UTC)
WHAT’S LEFT BEHIND
SEC Approves Hashdex’s NASDAQ Bitcoin and Ethereum Crypto Index ETF
The US Securities and Exchange Commission (SEC) has approved the listing of the Hashdex Nasdaq Crypto Index US ETF and the Franklin Crypto Index ETF. These ETFs will be traded on the NASDAQ and Cboe BZX exchanges, offering investors indirect exposure to Bitcoin and Ethereum. The approval includes market monitoring protocols to prevent fraud and manipulation.
El Salvador: Will Accelerate Bitcoin Purchases and Plans to Sell Chivo Wallet
The head of El Salvador’s Bitcoin Office announced that they will accelerate Bitcoin purchases as a strategic reserve. In addition, the official Bitcoin wallet Chivo will be sold or discontinued after an agreement with the International Monetary Fund (IMF). Bitcoin will continue to be used as legal currency in the country.
World Liberty Buys 722.2 ETH for $2.5 Million
World Liberty bought 722.2 ETH for 2.5 million USDC in a single transaction. The transaction took place at an average price of $3,461 and was verified by on-chain data.
Mt. Gox Address Transferred Bitcoin Worth $69.87 Million
According to Arkm data, Mt. Gox transferred $719,568 BTC, worth approximately $69.87 million, to two new wallet addresses.
HIGHLIGHTS OF THE DAY
Important Economic Calender Data
| Time | News | Expectation | Previous |
|---|---|---|---|
| 13:30 | US Core PCE Price Index (MoM) (Nov) | 0.2% | 0.3% |
| 13:30 | US PCE Price Index (MoM) (Nov) | 0.2% | 0.2% |
| 13:30 | US Core PCE Price Index (YoY) (Nov) | 2.9% | 2.8% |
| 13:30 | US PCE Price Index (YoY) (Nov) | 2.5% | 2.3% |
| 15:00 | US Michigan Consumer Sentiment (Dec) | 74.1 | 74 |
INFORMATION
*The calendar is based on UTC (Coordinated Universal Time) time zone.
The economic calendar content on the relevant page is obtained from reliable news and data providers. The news in the economic calendar content, the date and time of the announcement of the news, possible changes in the previous, expectations and announced figures are made by the data provider institutions. Darkex cannot be held responsible for possible changes that may arise from similar situations.
MARKET COMPASS
After the US Federal Reserve (FED) announced a change in its interest rate cut course, markets continue to adjust their positions according to the new conditions. The threat of a government shutdown due to the spending cap has also weakened risk appetite. Futures contracts linked to European and US indices point to a negative opening. Although the dollar index eased slightly during Asian trading, it remains above the 108 level with its recent rises.
The post-FED period continues in digital assets. As we mentioned in our analysis yesterday, although there were interim recoveries, the expectation that the tightness of financial conditions would not loosen as fast as thought continued to put pressure. We expect intermittent waves of selling to lose momentum and prices to stabilize. We think that the short-term declines we expect will start to be limited.
From the short term to the big picture.
The victory of former President Trump on November 5, which was one of the main pillars of our bullish expectation for the long-term outlook in digital assets, produced a result in line with our predictions. Afterwards, the president-elect’s appointments and expectations of increased regulation of the crypto ecosystem in the US continued to be a positive variable in our equation. Although expected to continue at a slower pace, the continuation of the FED’s interest rate cut cycle and the volume in BTC ETFs indicating an increase in institutional investor interest (in addition to MicroStrategy’s BTC purchases, BlackRock’s BTC ETF options trading…) support our upward forecast for the big picture for now.
In the short term, given the nature of the market and pricing behavior, we think it would not be surprising to see occasional pauses or pullbacks in digital assets. However, at this point, it is worth emphasizing again that the fundamental dynamics continue to be bullish. We think that the declines that took place after the FED’s recent statements are in line with the market fabric and are necessary for healthier rises for the long term.
TECHNICAL ANALYSIS
BTC/USDT
In a press conference following the monetary policy meeting, FED Chairman J. Powell stated that the FED does not intend to participate in government plans to accumulate Bitcoin. He emphasized that such issues fall under the jurisdiction of Congress and that the FED is not trying to change existing laws to allow Bitcoin holdings. With the increased volatility following Powell’s statements, spot Bitcoin ETFs in the US saw an outflow of 680 million dollars on yesterday’s trading day. Thus, the 15-day positive rally of ETFs came to an end.
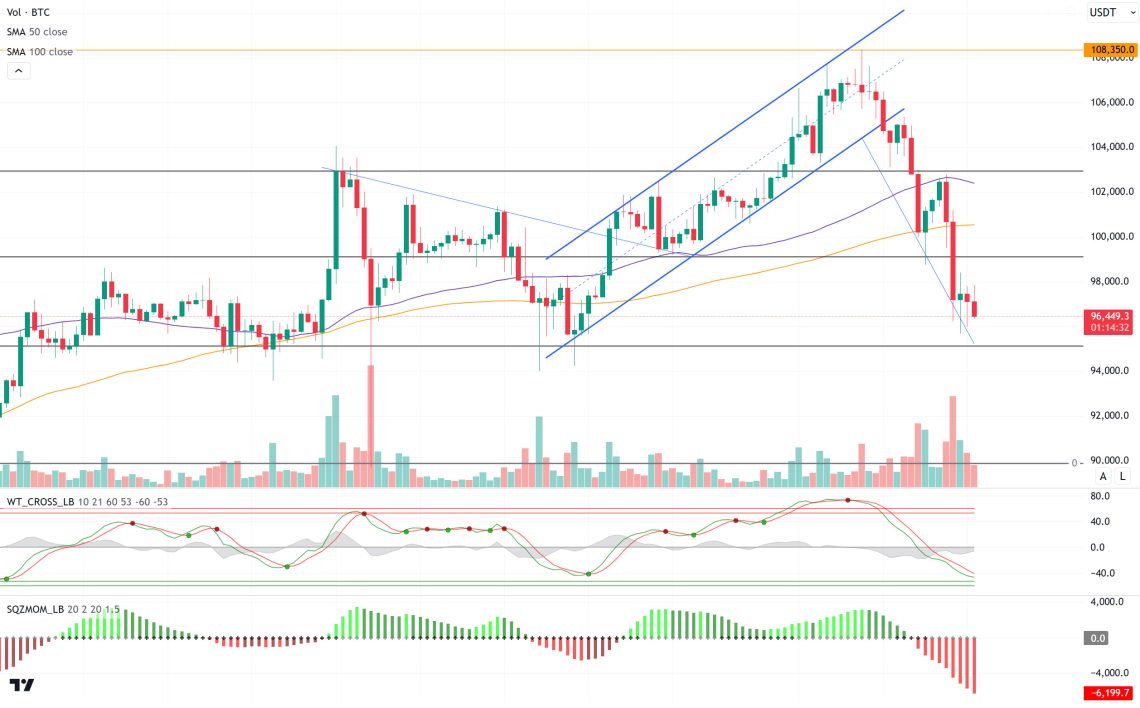
When we look at the technical outlook with all these developments, the price, which was squeezed between the 50 and 100-day SMA lines, turned down after testing the 50-day SMA resistance line. BTC, which then broke the 100-day SMA support level in the downward direction, fell to 95,700 with selling pressure. Currently trading at 96.800, BTC’s technical oscillators have approached the oversold zone on the hourly chart, while the momentum indicator continues to gain strength in the negative zone. In a possible new wave of selling, the 95,150 support level is critical, a break of which could widen the price range to the 90,000 level. In case of a recovery, crossing the resistance level of 98,000 and then 99,100 may bring six-digit levels back.
Supports 95,150 – 92,550 – 91,450
Resistances 98,000 – 99,100 – 100,000
ETH/USDT
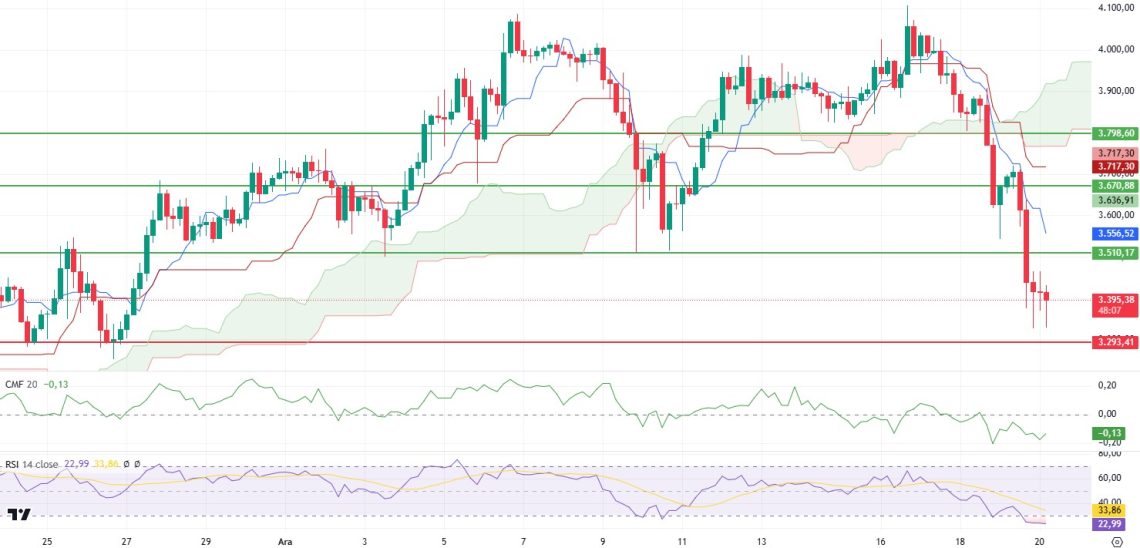
The general decline observed in the markets after Fed Chairman Powell’s speech also affected Ethereum, leading to a sharp retreat. ETH, which first lost 3,670 and then 3,510 support levels yesterday evening, fell to 3,293 support. During this downtrend, Cumulative Volume Delta (CVD) data shows that sellers are gaining weight on both spot and futures. Another prominent metric is the funding rate. The rise in the funding rate while the Ethereum price is falling is considered a negative signal, putting additional pressure on the market.
Technical indicators also underline the current weakness. The Relative Strength Index (RSI) is in oversold territory and continues to trend downwards. This indicates that selling pressure is still strong. The Chaikin Money Flow (CMF) indicator, on the other hand, continues its downtrend with positive divergences despite hovering in negative territory. In the light of this data, it seems likely that the price will experience a recovery at 3,293 support during the day. However, if this level is broken with the rise in the funding rate, it can be expected that the selling pressure will increase further and the decline will deepen. In such a scenario, the 3,200 and 3,100 regions gain importance as the next support levels.
Supports 3,293 – 3,131- 3,033
Resistances 3,510 – 3,670 – 3,798
XRP/USDT
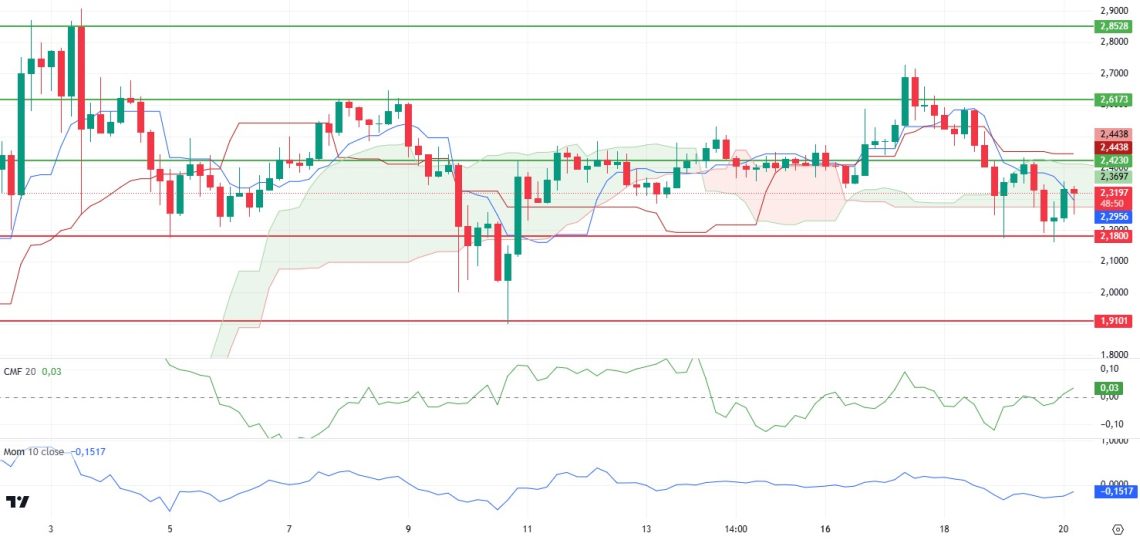
XRP lost support from the Kumo cloud yesterday, falling as low as 2.18, but managed to recover from this level. The price then re-entered the Kumo cloud boundaries and this added a relatively positive tone to XRP’s technical outlook. The double bottom, especially at 2.18, can be considered as a short-term recovery signal.
Technical indicators support that XRP is gaining momentum. Chaikin Money Flow (CMF) is showing an upward movement in the positive territory, signaling increased buying pressure. The momentum indicator is also trending upwards, suggesting that buyers are starting to make an impact in the market.
In line with this data, it seems likely that the XRP price will continue to rise up to 2.42 during the day, provided that Kumo cloud support is maintained. However, if cloud support is lost again, the price can be expected to retreat to the 2.18 level. A break of the 2.18 support could lead to increased selling pressure and deeper declines. Therefore, it is important for traders to keep a close eye on the 2.18 support and the Kumo cloud boundaries.
Supports 2.2749 – 1.9101- 1.6309
Resistances 2.4230 – 2.6173 – 2.8528
SOL/USDT
Price charts across the entire cryptocurrency market have been in deep red since yesterday’s FOMC meeting. Although the Fed cut interest rates by 25 basis points as expected, Chairman Jerome Powell warned that there may not be any cuts in 2025 and said that the central bank is not allowed to buy BTC despite Trump’s promises.
Bitwise’s new Solana Staking ETP, codenamed BSOL, will be traded on the Frankfurt Stock Exchange’s Xetra trading platform in Germany in cooperation with Marinade, a self-custody automation tool. According to the firm, the fund uses a staking mechanism, enabling investors to earn higher returns compared to other SOL products.
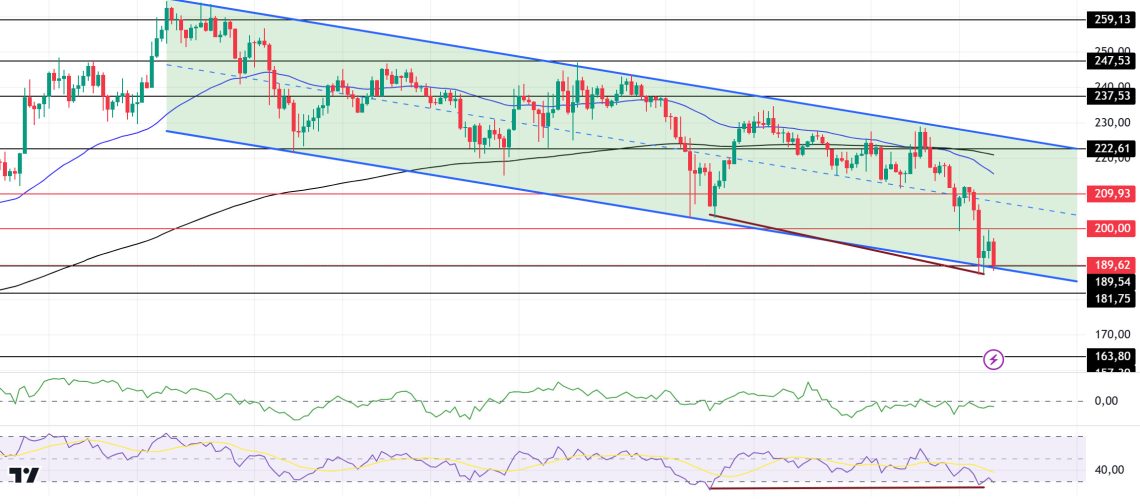
SOL kept pace with the market’s decline and the fall deepened. The asset, which moved with slight pullbacks for a long time, could not withstand the selling pressure. The downward movement of BTC, the cryptocurrency leader, further shook the asset. This led to a 7.37% decline in the 24-hour period. The price of the asset, which is in a wide downtrend, is located at the support point of the trend. In the 4-hour timeframe, the 50 EMA (Blue Line) started to hover below the 200 EMA (Black Line). Although there was a downward acceleration from the resistance level, the asset managed to stay within the downtrend. When we analyze the Chaikin Money Flow (CMF)20 indicator, the increase in money outflows increases selling pressure. However, Relative Strength Index (RSI)14 has moved from the neutral zone to the oversold zone. On the other hand, there is a mismatch between RSI (14) and the price. This may push the price of SOL higher. The 222.61 level stands out as a very strong resistance point in the rises driven by both the upcoming macroeconomic data and the news in the Solana ecosystem. If it breaks here, the rise may continue. In case of retracements for the opposite reasons or due to profit sales, the 181.75 support level can be triggered again. If the price reaches these support levels, a potential bullish opportunity may arise if momentum increases.
Supports 189.54 – 181.75 – 163.80
Resistances 200.00 – 209.93 – 222.61
DOGE/USDT
Price charts across the entire cryptocurrency market have been in deep red since yesterday’s FOMC meeting. Although the Fed cut interest rates by 25 basis points as expected, Chairman Jerome Powell warned that there may not be any cuts in 2025 and said that the central bank is not allowed to buy BTC despite Trump’s promises.
Unable to withstand BTC’s volatility, the asset is in a deep retreat. While the entire cryptocurrency market has experienced a severe correction in the last 36 hours, DOGE has been among the worst performers, with its price dropping by more than 18.45%. But long-term investors and whales continue to accumulate DOGE. This underscores confidence in a potential return of the asset. On the other hand, regulatory challenges are delaying the X payment, affecting DOGE’s potential role.
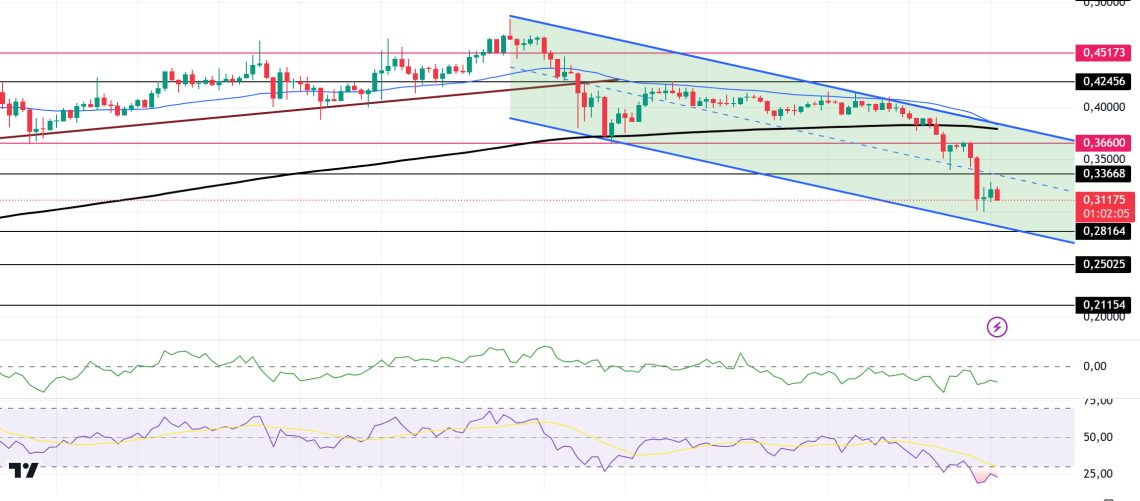
Looking at the chart, DOGE, which has been in a downtrend since December 8, is going to test the support of this trend. When we examine the Chaikin Money Flow (CMF)20 indicator, there are money outflows and suppressing the price. However, Relative Strength Index (RSI)14 has reached the oversold zone from the neutral zone level. The 0.42456 level stands out as a very strong resistance point in the rises driven by both the upcoming macroeconomic data and the innovations in the Doge coin. If DOGE catches a new momentum and rises above this level, the rise may continue strongly. In case of possible pullbacks due to macroeconomic reasons or negativities in the ecosystem, the 0.28164 level appears as an important support. If the price reaches these support levels, a potential bullish opportunity may arise if momentum increases.
Supports 0.28164 – 0.25025 – 0.21154
Resistances 0.33668 – 0.36600 – 0.42456
 LEGAL NOTICE
The investment information, comments and recommendations contained herein do not constitute investment advice. Investment advisory services are provided individually by authorized institutions taking into account the risk and return preferences of individuals. The comments and recommendations contained herein are of a general nature. These recommendations may not be suitable for your financial situation and risk and return preferences. Therefore, making an investment decision based solely on the information contained herein may not produce results in line with your expectations.


