MARKET SUMMARY
Latest Situation in Crypto Assets
| Assets | Last Price | 24h Change | Dominance | Market Cap |
|---|---|---|---|---|
| BTC | 93,681.64 | -1.36% | 56.44% | 1,86 T |
| ETH | 3,421.24 | 0.90% | 12.54% | 412,30 B |
| XRP | 2.076 | -4.87% | 3.63% | 119,42 B |
| SOLANA | 192.27 | -2.12% | 2.81% | 92,39 B |
| DOGE | 0.3202 | -2.00% | 1.44% | 47,25 B |
| CARDANO | 0.8705 | -1.89% | 0.93% | 30,57 B |
| TRX | 0.2583 | -1.22% | 0.68% | 22,27 B |
| AVAX | 36.75 | -1.55% | 0.46% | 15,06 B |
| LINK | 21.21 | -2.55% | 0.41% | 13,54 B |
| SHIB | 0.00002168 | -2.49% | 0.39% | 12,78 B |
| DOT | 6.969 | -1.77% | 0.33% | 10,69 B |
*Prepared on 12.30.2024 at 07:00 (UTC)
WHAT’S LEFT BEHIND
MiCA Regulations Come into Force on December 30th
The Markets in Crypto Assets (MiCA), the European Union’s specific framework for regulating the cryptocurrency sector, will come into force in 27 EU countries on December 30, 2024 . However, in some countries, the legislation needed to fully implement the regulations has yet to be enacted. For example, the Central Bank of Portugal announced that it has not determined which authority will be responsible at the national level.
EU Exchanges Move to Remove USDT
To comply with MiCA regulations in the EU, some exchanges will delist the popular stablecoin USDT. Tether has yet to obtain the e-money license required under MiCA, but has indicated that it may consider obtaining it in the future. This step could lead to euro-based stablecoins and other regulated issuers coming to the fore. Tether CEO Paolo Ardoino emphasized that there is a lot of “FUD” (fear, uncertainty, doubt) in the market regarding MiCA and that there is a transition period for stablecoin providers.
FTX Restructuring Plan Begins on January 3, 2025
According to the FTX announcement, the Chapter 11 reorganization plan will take effect on January 3, 2025. Initial distributions are scheduled to be made to eligible claims within 60 days of the effective date. This is considered an important stage in FTX’s restructuring process.
Bitcoin and Cryptocurrencies Called for Addition to Reserves
Christian Lindner, Chairman of the German Free Democratic Party (FDP), called on the European Central Bank (ECB) and the German Federal Bank to add cryptocurrencies such as Bitcoin to their reserves. Lindner emphasized that the US is aggressively pursuing crypto policies and that the Federal Reserve is exploring the possibility of including cryptocurrencies in reserves. This call reignited the debate that crypto assets could be part of national financial policies.
HIGHLIGHTS OF THE DAY
Important Economic Calender Data
| Time | News | Expectation | Previous |
|---|---|---|---|
| Tether (USDt) | EU Exchange Delistings | ||
| NEO | Hackathon | ||
| 14:45 | US Chicago PMI (Dec) | 42.7 | 40.2 |
| 15:00 | US Pending Home Sales (MoM) (Nov) | 0.9% | 2.0% |
INFORMATION
*The calendar is based on UTC (Coordinated Universal Time) time zone.
The economic calendar content on the relevant page is obtained from reliable news and data providers. The news in the economic calendar content, the date and time of the announcement of the news, possible changes in the previous, expectations and announced figures are made by the data provider institutions. Darkex cannot be held responsible for possible changes that may arise from similar situations.
MARKET COMPASS
Once again, a short trading week awaits global markets as they move out of Christmas week and into New Year’s week. Again, we expect volumes to remain low and some price changes to be deeper than usual.
On Friday, Wall Street indices closed on the downside as large investors, funds and portfolios adjusted their positions. US stock markets are set to close the year with significant premiums, although the effects that started after the strengthening expectations that the US Federal Reserve (FED) will cut interest rates less than previously expected in 2025 continue. The recent losses in the country’s stock markets have been driven by rising bond yields in tandem with expectations regarding the FED. Another agenda for the world’s largest economy is the federal government’s debt limit. A partial government shutdown has been avoided for now, albeit temporarily. Secretary Yellen, on the other hand, thinks that if a permanent solution is not found, the government will face the same risk again by mid-July.
Following the losses on Wall Street, there is a generally flat to negative outlook in Asia this morning. European stock markets are expected to start the day with a similar outlook. In major digital assets, as we mentioned in our previous analysis, we are watching a horizontal year-end change chart. The classic effects of the end of the year on asset prices and volumes and the neutral outlook of risk appetite lead to alternating rises and falls.
Chicago PMI and home sales data for the US economy will be released today. Due to the volume, it may not have a big impact on prices, but it will be useful to watch. For the rest of the day and the week, the horizontal-volatile course in digital assets may continue.
From the short term to the big picture.
The victory of former President Trump on November 5, which was one of the main pillars of our bullish expectation for the long-term outlook in digital assets, produced a result in line with our predictions. Afterwards, the appointments made by the president-elect and the expectations of increased regulation of the crypto ecosystem in the US continued to be a positive variable in our equation. Although it is expected to continue at a slower pace, the FED’s signal that it will continue its interest rate cut cycle and the volume in crypto asset ETFs indicating an increase in institutional investor interest (in addition to MicroStrategy’s BTC purchases, BlackRock’s BTC ETF options start trading…) support our upward forecast for the big picture for now.
In the short term, given the nature of the market and pricing behavior, we think it would not be surprising to see occasional pauses or pullbacks in digital assets. However, at this point, it is worth emphasizing again that the fundamental dynamics continue to be bullish.
TECHNICAL ANALYSIS
BTC/USDT
The Markets in Crypto Assets (MiCA), the European Union’s special framework for regulating the cryptocurrency sector, goes into effect in 27 EU countries as of today. As Tether has yet to obtain the e-money license required under MiCA, some exchanges are planning to delist the popular stablecoin USDT to comply with the regulations. Tether CEO Paolo Ardoino retweeted a tweet on the X platform, stating that “FUD information” about USDT is circulating in the market and that USDT will not be considered illegal in Europe on December 30th.
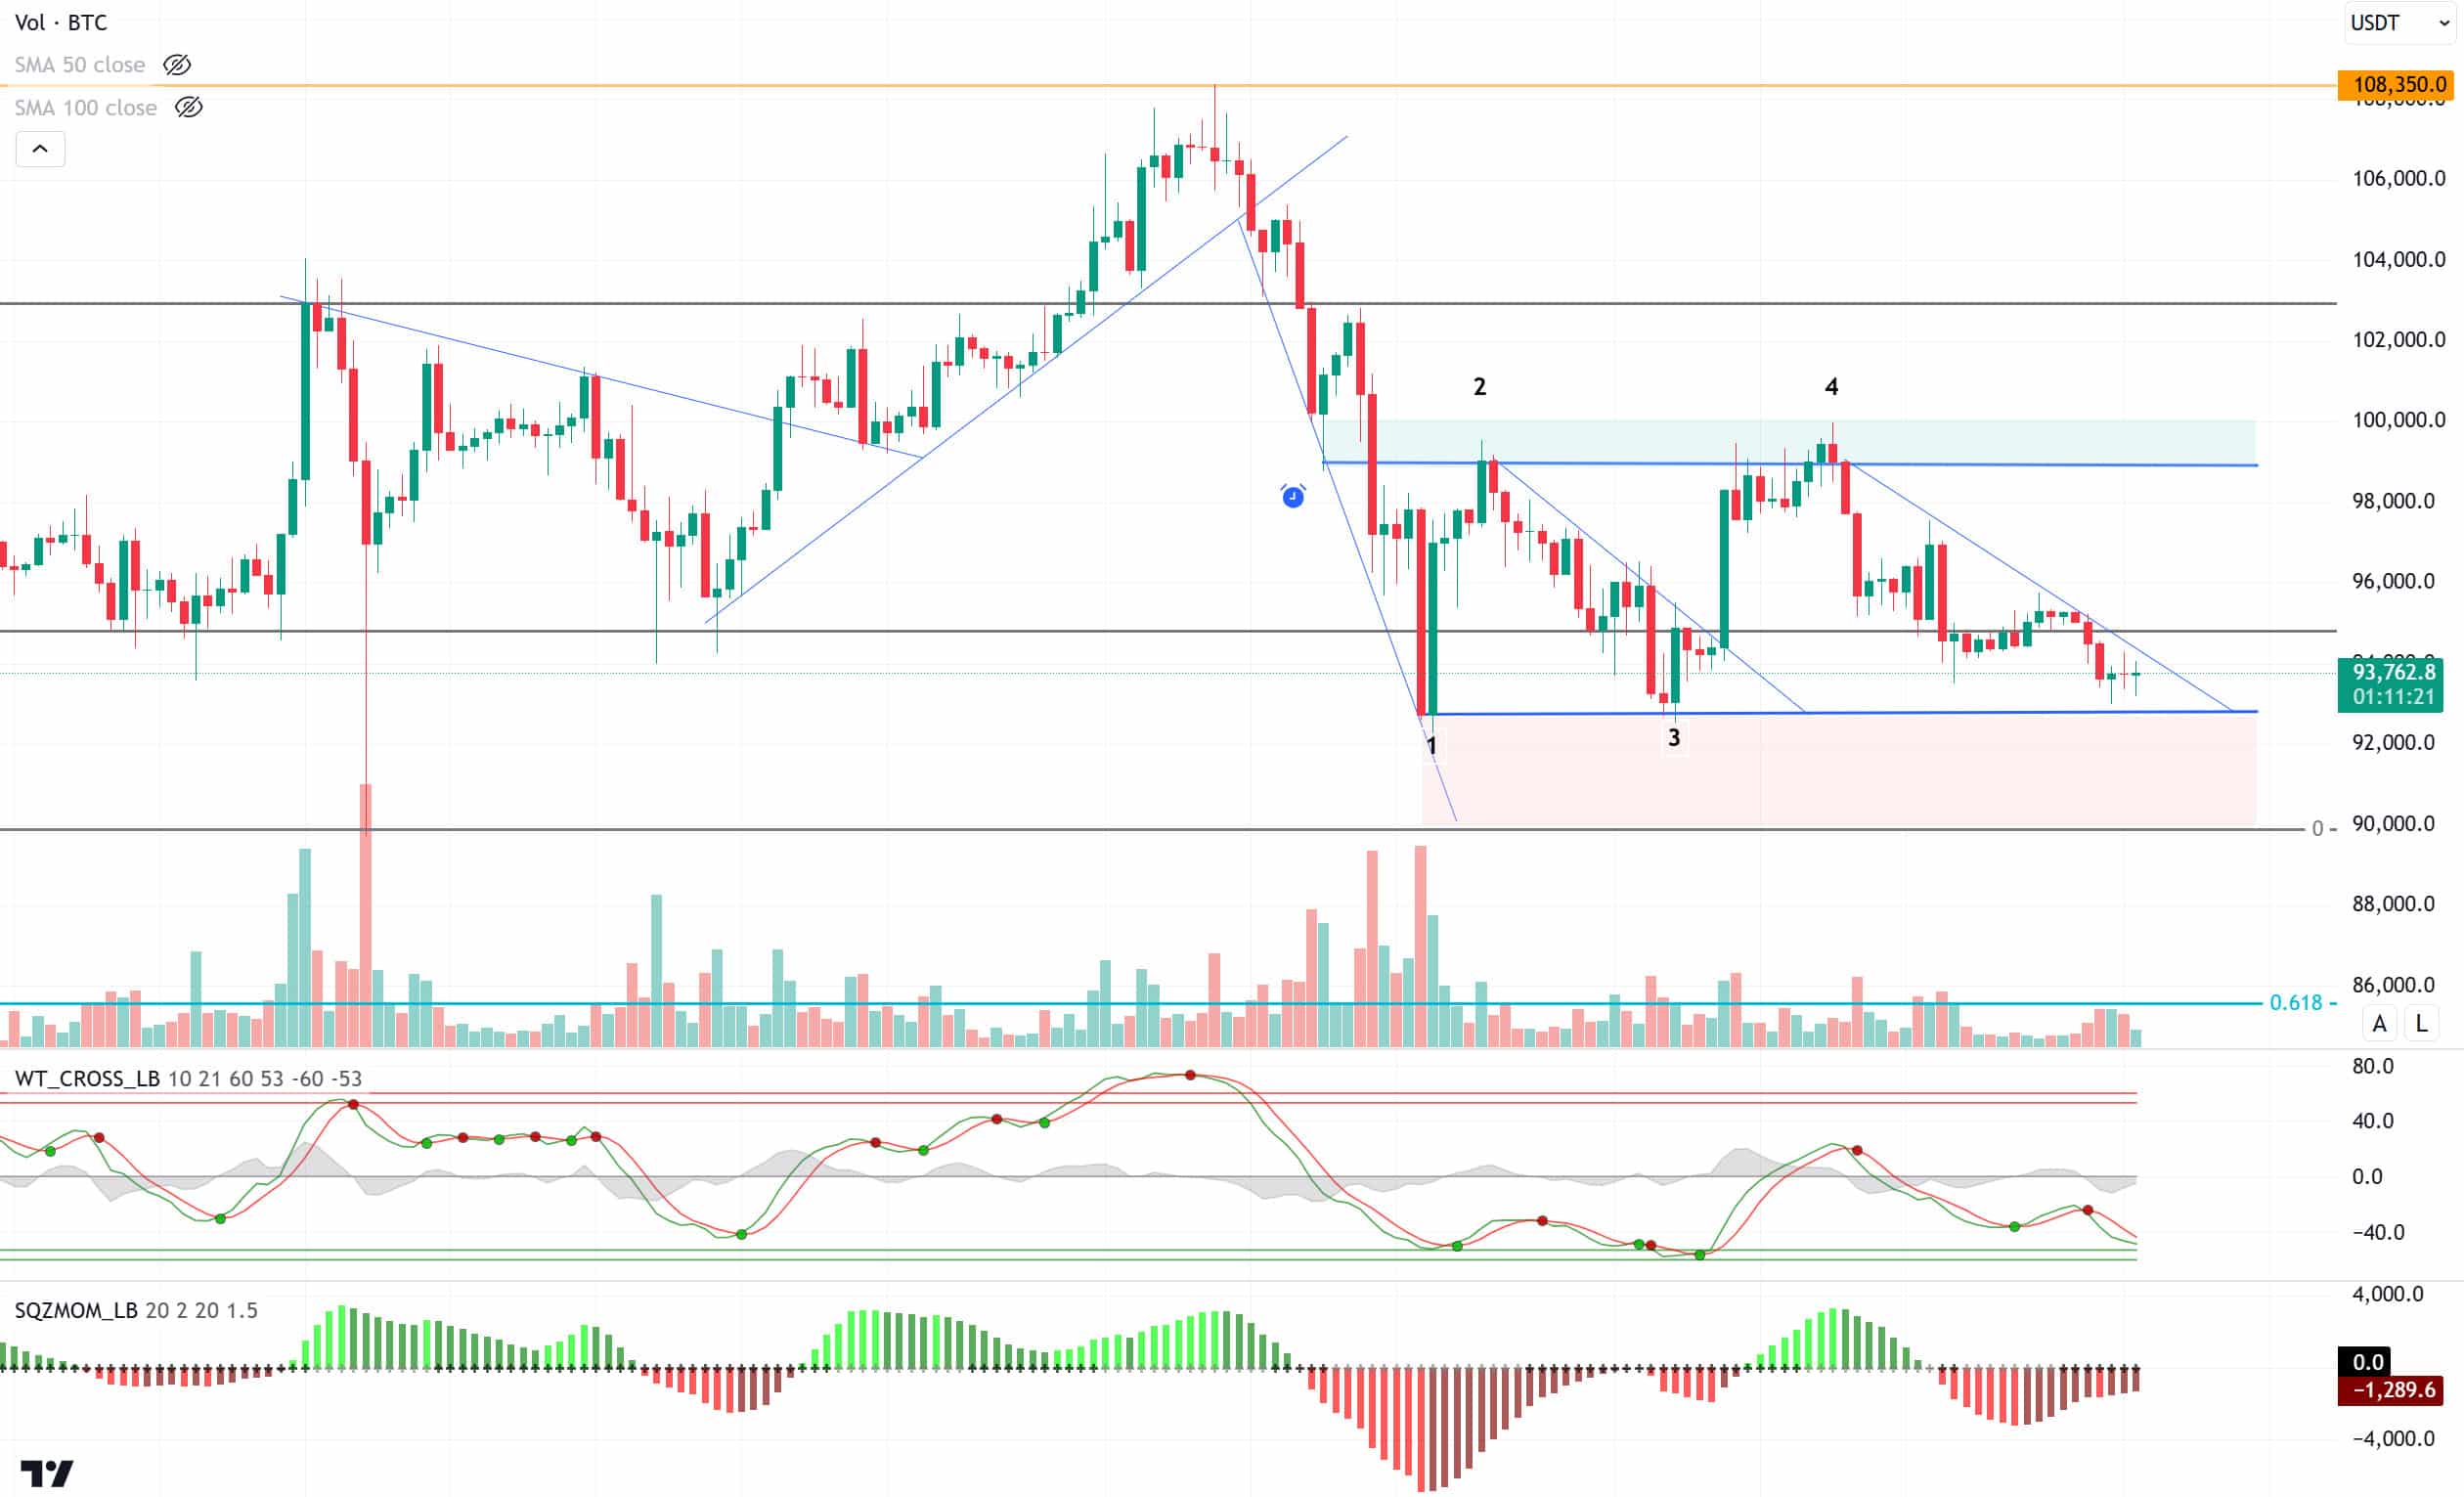
When we look at the technical outlook with this development, which creates FUD pressure in the market, we see that the price has retreated to the 93,000 level with the downward break of the 95,000 level, which we take as a reference point. In BTC, which continues to price in a rectangular pattern, technical oscillators moved in the oversold zone, while the momentum indicator weakened in the negative zone over the weekend. In case the price recovers, we will follow the break of the minor downtrend structure in the pattern, exceeding the 95,000 level may start a new upward movement. In case of a deeper decline, the break of the 92,800 level may pull the price to the 90,000 support level.
Supports 92,800 – 90,000 – 88,500
Resistances 95,000 – 97,200 – 99,100
ETH/USDT
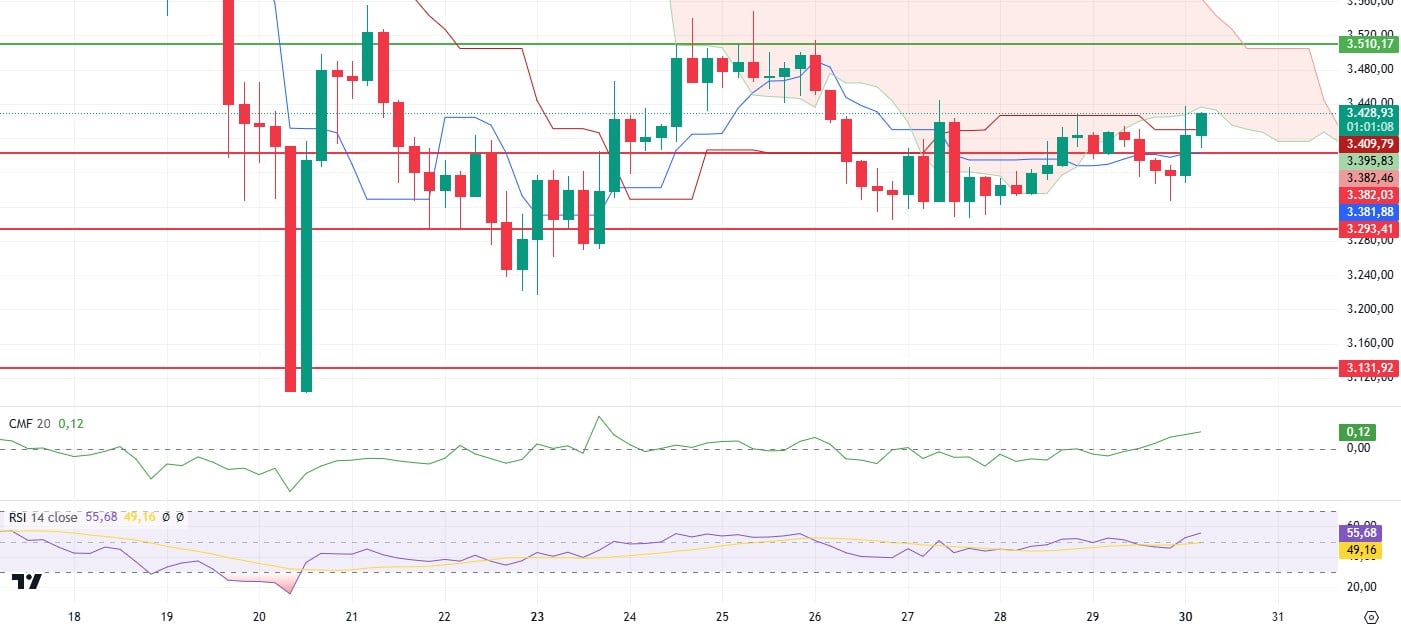
ETH, which fell as low as 3,330 levels after Sunday’s decline, managed to surpass the 3,382 intermediate resistance in the morning hours and rise to the lower band of the kumo cloud. This is an important threshold for the short-term direction of the market.
Looking at the Cumulative Volume Delta (CVD), the fact that this rise was largely driven by spot trades offers a positive outlook. However, the simultaneous rise in funding rate and open interest increases the possibility that the price may face a reaction at resistance levels. Chaikin Money Flow (CMF) indicator is showing a momentum indicating that buyers are gaining strength in the market. This positive outlook supports bullish expectations in the market. The Relative Strength Index (RSI) indicator is moving upwards without any negative divergence. However, the failure of the price to break the 3,510 level carries a potential risk of negative divergence in the coming period. According to the Ichimoku indicator, ETH’s regain of kijun and tenkan levels supports buyer momentum. For ETH, which has risen up to the lower band of the Kumo cloud, a sustained breach of this level could enable the price to rise as high as 3,510. However, if this critical threshold cannot be surpassed, there is a risk that the price may retreat to 3,382 support.
The overall outlook suggests that ETH retains bullish potential in the short term but may face a tough test at resistance levels. Although the positive signals in the indicators are in favor of buyers, exceeding critical levels will be decisive for determining the direction.
Supports 3,382 – 3,293- 3,131
Resistances 3,510 – 3,670 – 3,841
XRP/USDT
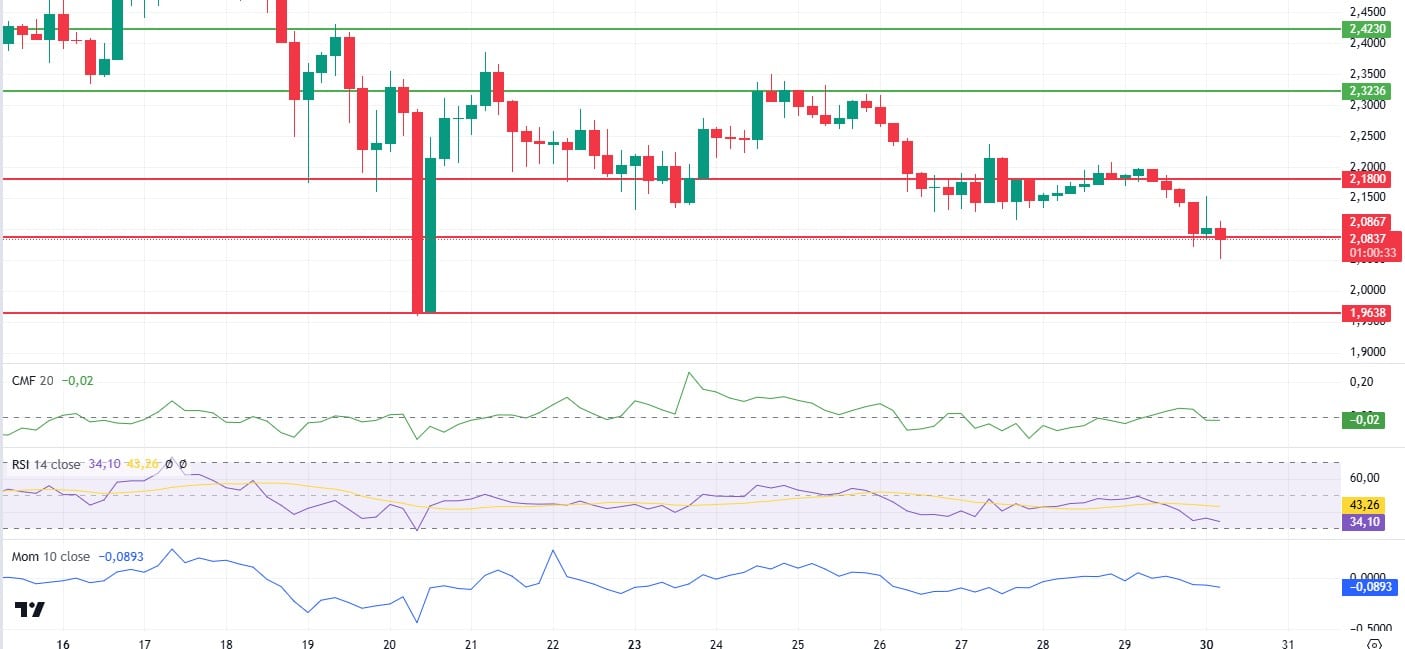
Continuing its weekend decline, XRP is trying to hold on to the critical level of 2.0867 after losing two important support levels. In this process, where trading volumes are quite low, market momentum is also observed to be weak. The bearish trend in the Relative Strength Index (RSI) indicator supports the negative picture and indicates that there is not enough recovery on the buy side of the market yet. The Chaikin Money Flow (CMF) indicator, on the other hand, has risen to the zero line, creating a positive mismatch. This indicates that buyers are attempting a partial recovery in the market. However, the sustainability of this move depends on whether XRP can stay above the 2.0867 level.
If XRP manages to hold above 2.0867, the price has the potential to rebound to 2.18 in the short term. However, if this support is lost, deeper corrections are likely to be encountered. Especially in a low-volume environment, the impact of negative technical indicators may increase the risk of the price heading lower. The overall outlook suggests that XRP is undergoing an important test of critical support levels. Positive signals on CMF are promising, but weakness in RSI and low trading volume suggest that the market should be monitored carefully.
Supports 2.0867 – 1.9638- 1.6309
Resistances 2.1800 – 2.3236 – 2.4230
SOL/USDT
Asset manager Volatility Shares has filed for three new exchange-traded funds (ETFs) focused on Solana futures contracts. Solana co-founder Stephen Akridge is being sued by his ex-wife Elisa Rossi for allegedly stealing millions in staking rewards from his crypto wallet. Rossi alleges that Akridge used his blockchain expertise to secretly control her accounts and take all the rewards without her consent. The lawsuit, filed in San Francisco, accuses Akridge of fraud and unjust enrichment, and describes the amounts in dispute as “substantial.” Solana’s competitive advantages, such as low fees and high transaction speeds, continue to attract DeFi users. However, there is a downside risk as prices remain below the 200.00 resistance.
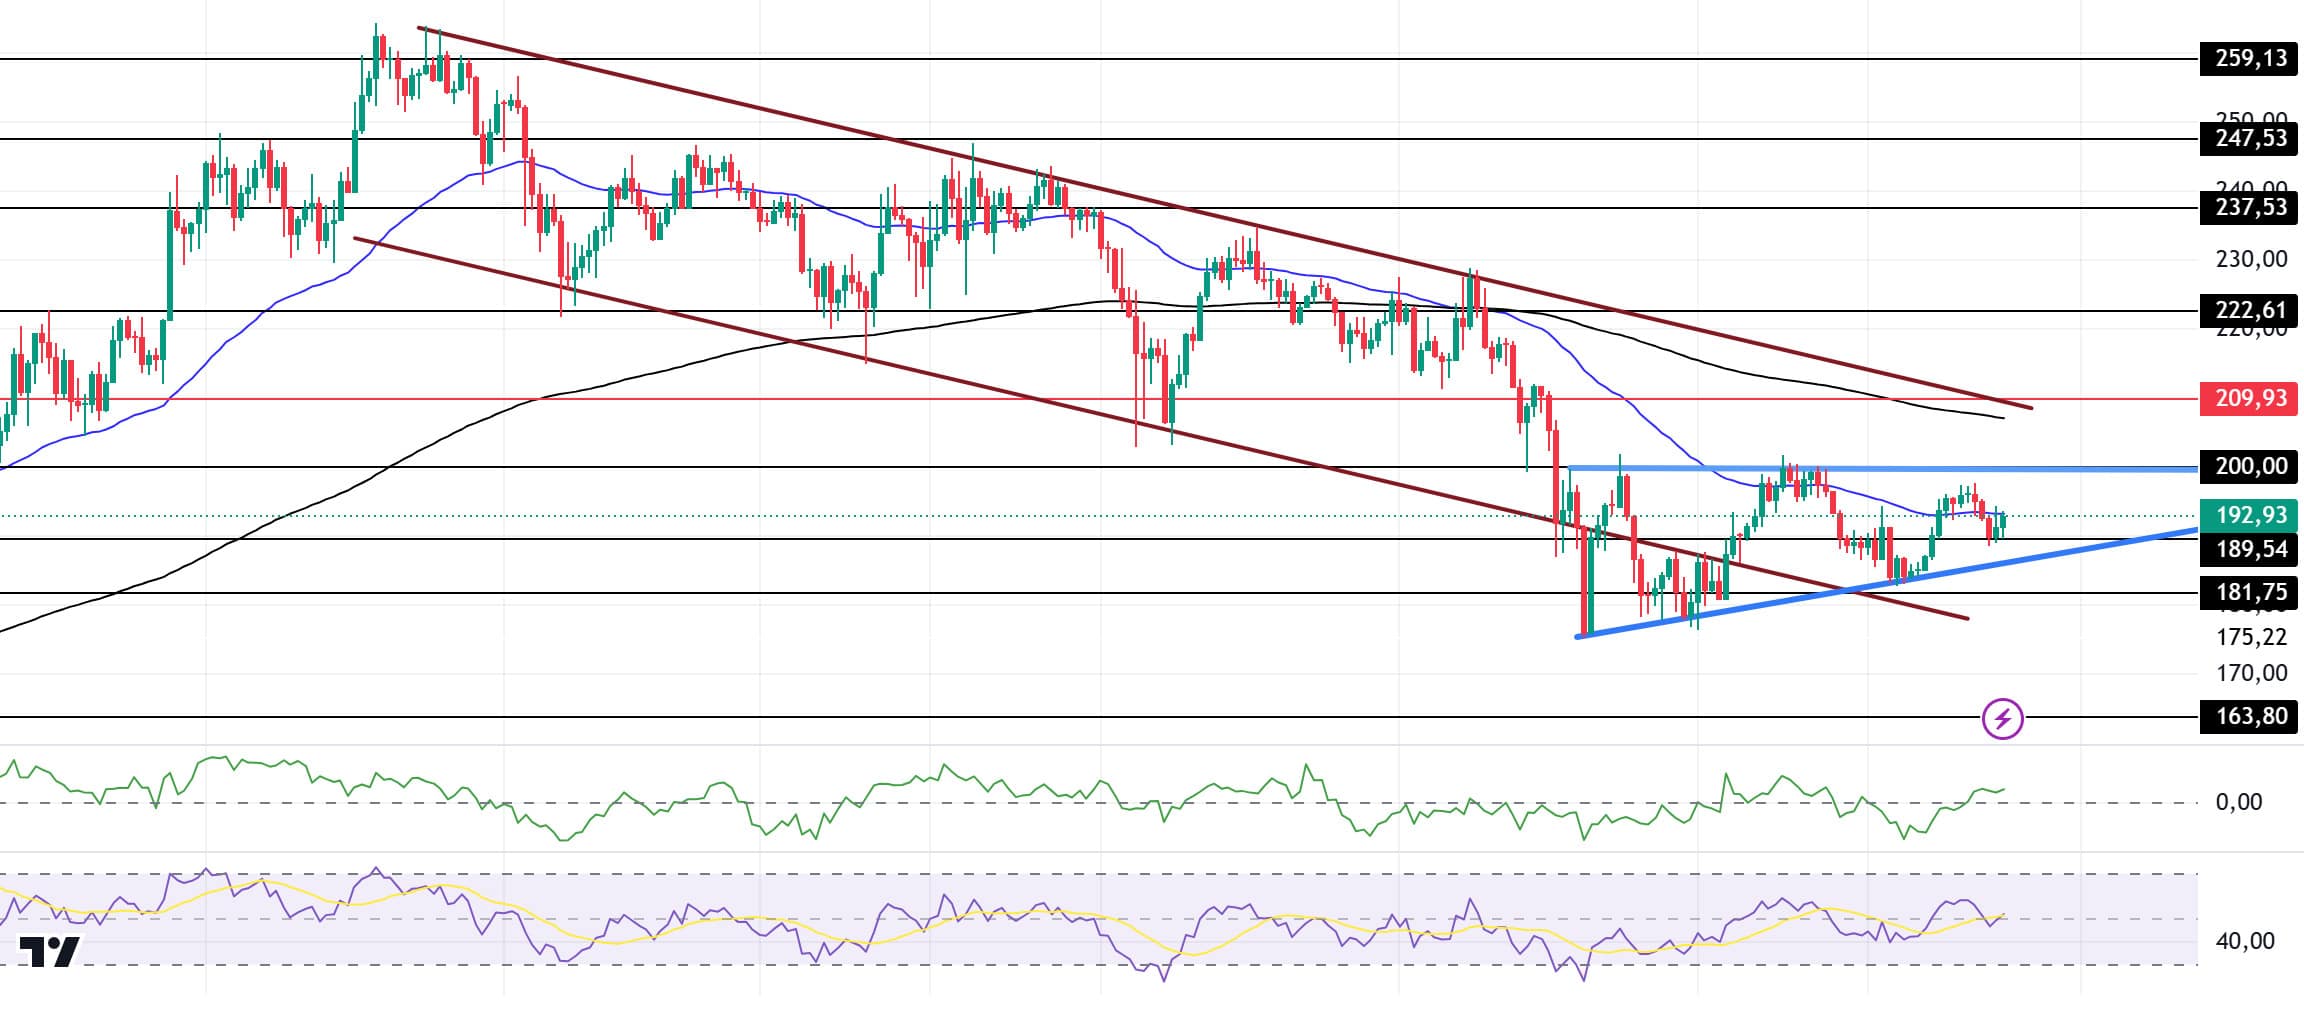
Solana continued its bearish move horizontally. On the 4-hour timeframe, the 50 EMA (Blue Line) is below the 200 EMA (Black Line). As a matter of fact, the asset tested but failed to break the 50 EMA resistance and the strong resistance at 200.00. If it retests and breaks here again, the rise may continue. When we examine the Chaikin Money Flow (CMF)20 indicator, it is in positive territory and money inflows are gradually increasing. However, Relative Strength Index (RSI)14 is at the neutral level. On the other hand, the ascending triangle pattern should be taken into consideration. The 209.93 level stands out as a very strong resistance point in the rises driven by both the upcoming macroeconomic data and the news in the Solana ecosystem. If it breaks here, the rise may continue. In case of retracements for the opposite reasons or due to profit sales, the 163.80 support level can be triggered. If the price comes to these support levels, a potential bullish opportunity may arise if momentum increases.
Supports 189.54 – 181.75 – 163.80
Resistances 200.00 – 209.93 – 222.61
DOGE/USDT
Whales bought over 90 million DOGE in recent days, signaling accumulation. Whale activity has boosted Dogecoin’s ecosystem activity, with large transactions totaling $23 billion, up 41%.
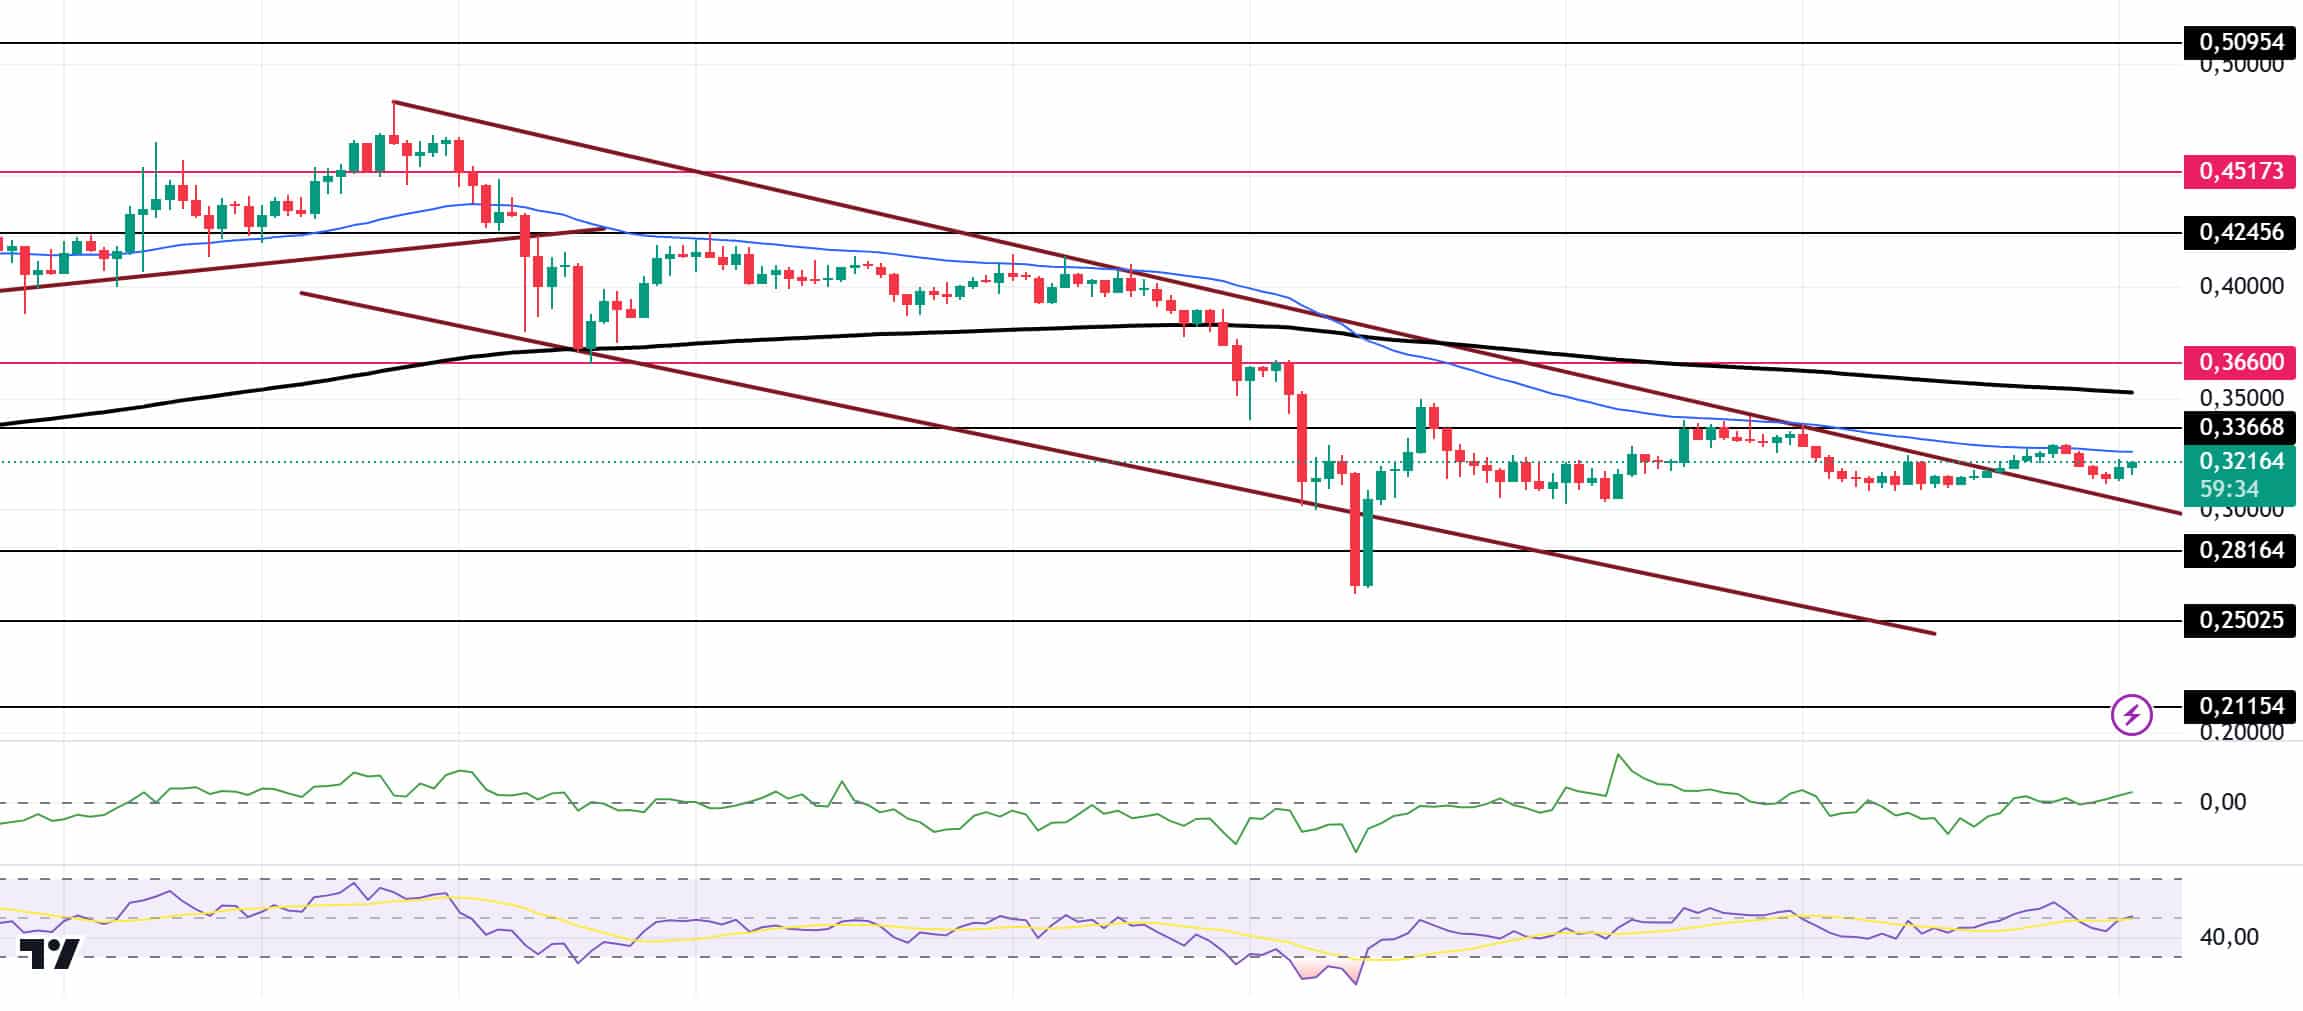
Dogecoin (DOGE) failed to break the critical $0.33668 price level and is trading at $0.3202 with a trading volume of $1.91 billion in the last 24 hours. When we look at the chart, DOGE, which has been in a downtrend since December 8, is testing the resistance level of the trend after gaining momentum from the support of this trend and consolidating in the middle of the trend. In the 4-hour timeframe, the 50 EMA (Blue Line) continues to be below the 200 EMA (Black Line). When we examine the Chaikin Money Flow (CMF)20 indicator, it moved into the positive zone. As a matter of fact, money outflows started to increase. However, Relative Strength Index (RSI)14 maintains its neutral zone level. The 0.36600 level stands out as a very strong resistance level in the rises driven by both the upcoming macroeconomic data and the innovations in the Doge coin. If DOGE catches a new momentum and rises above this level, the rise may continue strongly. In case of possible pullbacks due to macroeconomic reasons or negativity in the ecosystem, the 0.25025 level, which is the base level of the trend, is an important support. If the price reaches these support levels, a potential bullish opportunity may arise if momentum increases.
Supports 0.28164 – 0.25025 – 0.21154
Resistances 0.33668 – 0.36600 – 0.42456
LEGAL NOTICE
The investment information, comments and recommendations contained herein do not constitute investment advice. Investment advisory services are provided individually by authorized institutions taking into account the risk and return preferences of individuals. The comments and recommendations contained herein are of a general nature. These recommendations may not be suitable for your financial situation and risk and return preferences. Therefore, making an investment decision based solely on the information contained herein may not produce results in line with your expectations.


