MARKET SUMMARY
Latest Situation in Crypto Assets
| Assets | Last Price | 24h Change | Dominance | Market Cap. |
|---|---|---|---|---|
| BTC | 93,674.79 | -0.75% | 57.15% | 1,85 T |
| ETH | 3,189.57 | -2.44% | 11.86% | 384,22 B |
| XRP | 2.461 | -2.69% | 4.36% | 141,35 B |
| SOLANA | 182.02 | -2.15% | 2.72% | 88,20 B |
| DOGE | 0.3270 | -3.73% | 1.49% | 48,26 B |
| CARDANO | 0.9334 | -7.08% | 1.01% | 32,83 B |
| TRX | 0.2265 | -5.15% | 0.60% | 19,55 B |
| AVAX | 34.72 | -5.37% | 0.44% | 14,32 B |
| LINK | 19.03 | -4.99% | 0.38% | 12,17 B |
| SHIB | 0.00002078 | -4.31% | 0.38% | 12,27 B |
| DOT | 6.355 | -5.00% | 0.30% | 9,80 B |
*Prepared on 1.13.2025 at 07:00 (UTC)
WHAT’S LEFT BEHIND
Bitcoin Proposal from Meta Shareholders
Shareholders of Meta Platforms (META), a subsidiary of US SBR, have made a proposal for the company to treat Bitcoin (BTC) as a treasury asset. According to the supporting statement, Meta has $72 billion in cash, cash equivalents and securities. Shareholders emphasized that this cash is constantly borrowed, while bond yields remain below real inflation rates, which reduces shareholder value. Thinking that Bitcoin can add value to the company’s financial structure, shareholders presented this proposal to the Meta board of directors
Michael Saylor’s Bitcoin Shares Continue
Michael Saylor, founder of MicroStrategy, shared Bitcoin Tracker information for the tenth week in a row. This time, he hinted at holding Bitcoin, saying things like, “Consider adding the next green dot to the website.” Saylor’s approach is seen as a signal reinforcing the company’s long-term commitment to Bitcoin.
Bitcoin Mining Difficulty Sets New Record
According to CloverPool data, at block height 878,976 (January 13, 2025, 04:01:51), Bitcoin mining difficulty increased by 0.61% to 110.45 trillion, setting a new record. Furthermore, the current average computing power of the entire network increased to 1.19 ZH/s. This growth is considered a positive development for the security and resilience of the network.
US AI Venture Funding Hits Record
According to Bloomberg, in 2024, US-based artificial intelligence (AI) startups broke a record by raising a total of $97 billion in funding. This amount accounts for almost half of the total startup funding raised throughout the year. Big players such as OpenAI and XAI were among the major companies driving this increase. Global AI investments accounted for 35.7% of total venture capital. In contrast, startup funding in Europe and Asia declined to $61.6 billion and $75.9 billion respectively, with resources concentrated in the AI sector.
HIGHLIGHTS OF THE DAY
Important Economic Calender Data
| Time | News | Previous |
|---|---|---|
| Fantom (FTM): Conversion of FTM Tokens to S tokens |
INFORMATION:
*The calendar is based on UTC (Coordinated Universal Time) time zone.
The economic calendar content on the relevant page is obtained from reliable news and data providers. The news in the economic calendar content, the date and time of the announcement of the news, possible changes in the previous, expectations and announced figures are made by the data provider institutions. Darkex cannot be held responsible for possible changes that may arise from similar situations.
MARKET COMPASS
Global markets are still reeling from last week’s US employment data, which pointed to a better-than-expected economic outlook. Moreover, the US announcement of new oil sanctions against Russia was another dynamic that dampened risk appetite. With macro indicators strengthening expectations that the US Federal Reserve (FED) will slow down interest rate cuts, the dollar index rose to 2-year highs in the new week. With Japan closed due to a holiday, Asian stock markets are down, and futures contracts point to a selloff opening in European and US stock markets.
We can say that digital assets managed to manage the losses after Friday’s positive non-farm payrolls data. However, the pressure continues. This week, macro indicators from the US, especially the Consumer Price Index (CPI), may be decisive in prices. Click here to review our weekly report on this subject.
Although there are intermediate reactions in the rest of the day, we think that the pressurized and horizontal course may continue. For the long term, we maintain our view mentioned below for now.
From the short term to the big picture.
The victory of former President Trump on November 5, which was one of the main pillars of our bullish expectation for the long-term outlook in digital assets, produced a result in line with our predictions. Afterwards, the appointments made by the president-elect and the increasing regulatory expectations for the crypto ecosystem in the US and the emergence of BTC as a reserve continued to take place in our equation as positive variables. Although it is expected to continue at a slower pace, the preservation of expectations that the FED will continue its interest rate cut cycle and the volume in crypto asset-based ETFs indicating an increase in institutional investor interest support our upward forecast for the big picture for now. In the short term, given the nature of the market and pricing behavior, we think it would not be surprising to see occasional pauses or pullbacks in digital assets. However, at this point, it is worth emphasizing again that we think the fundamental dynamics continue to be bullish.
TECHNICAL ANALYSIS
BTC/USDT
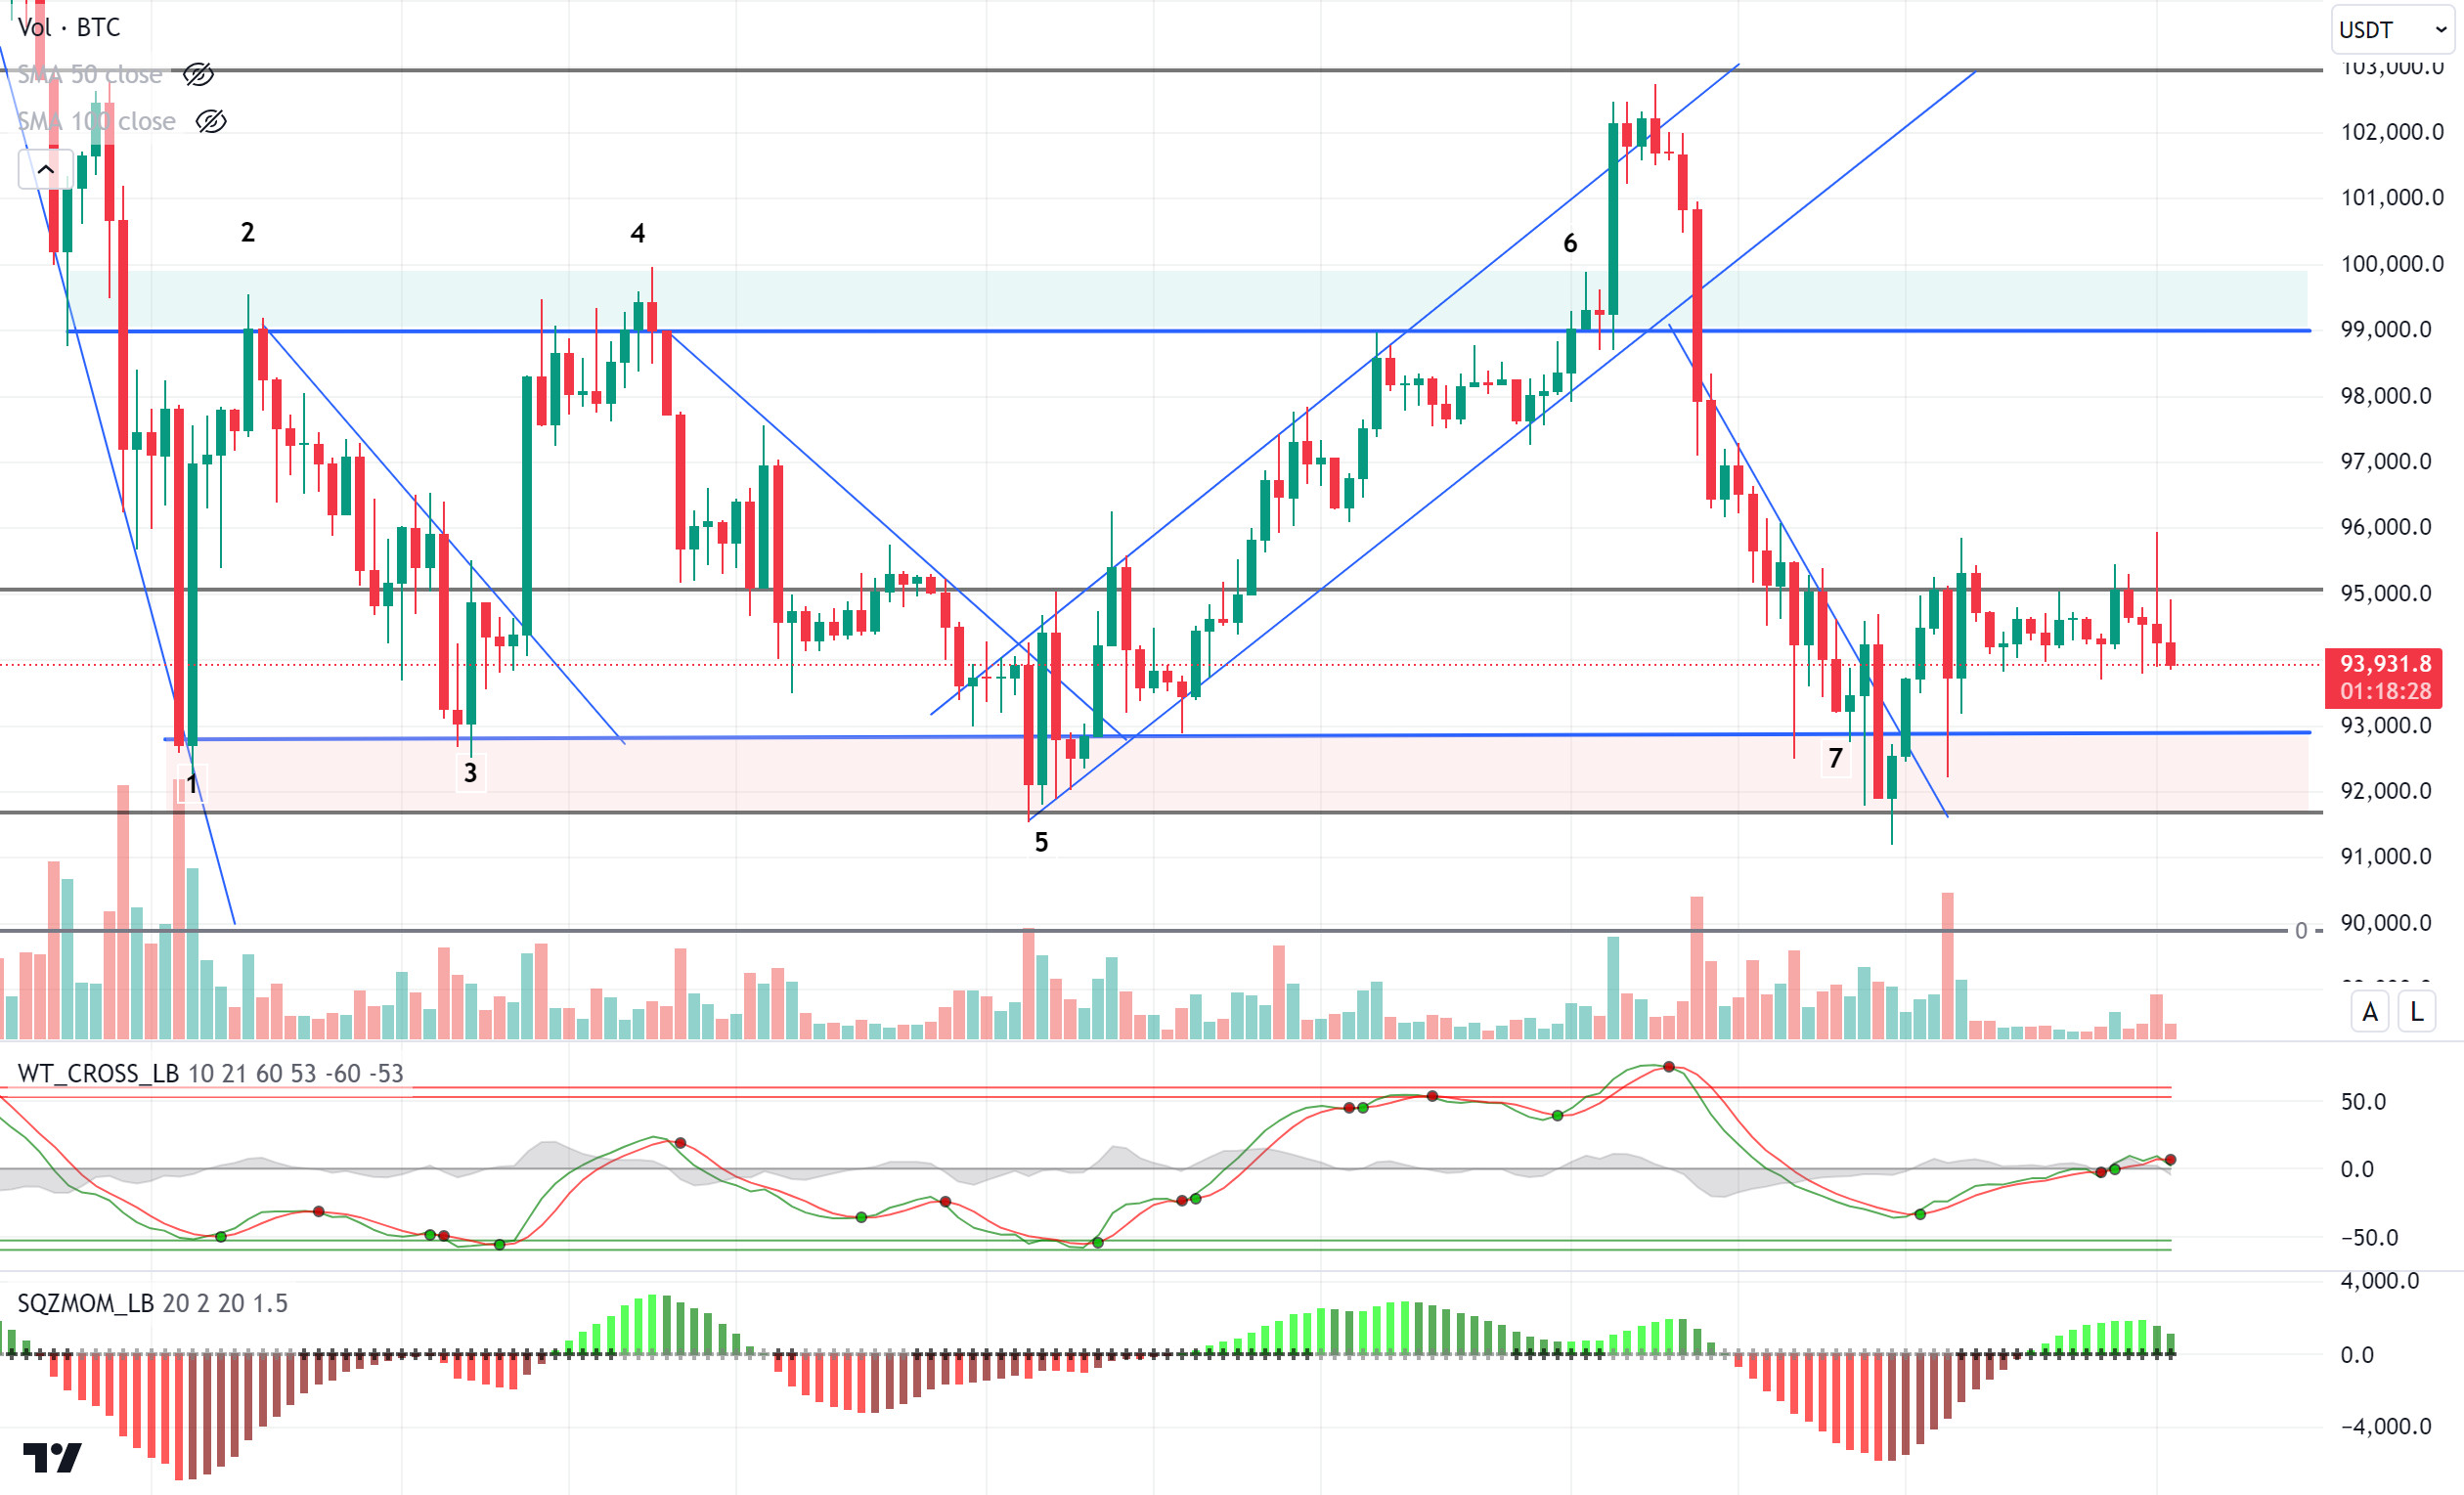
According to CryptoQuant, Bitcoin prices are around 12% below their historical highs. Although long-term holders (LTH) continue to divest their holdings, the pace of decline is slowing. The 30-day supply turnover rate suggests that this decline could reach a cyclical peak. Looking at historical data, it is seen that prices can enter an upward trend after LTH sales reach their peak. On the other hand, at the corporate level, some Meta shareholders proposed to include Bitcoin in the company’s reserves, which was an important development.
When we look at the first technical outlook of the week, BTC, which fell to 91,300 with the falling trend structure, managed to recover again. With the macro data released by the US last Friday, it fell from 95,000 to 92,300. BTC, which showed a rapid recovery after the impact of the news, made several attempts towards the 95,000 major resistance level at the weekend, but has not yet exceeded this level. Currently trading at 93,900, BTC’s technical oscillators are giving a sell signal on the hourly charts while the momentum indicator continues to weaken in the positive zone. In case of a possible pullback, the 92,800 support level is an important level to hold in the positive zone. With the double bottom formation to be seen in case of its break, long transactions opened at 90,000 and 91,000 levels can be targeted. In the continuation of the rise, exceeding the 95,000 resistance level, short transactions between 96,000 and 98,000 levels can be targeted.
Supports 92,800 – 91,700 – 90,000
Resistances 95,000 – 97,200 – 99,100
ETH/USDT
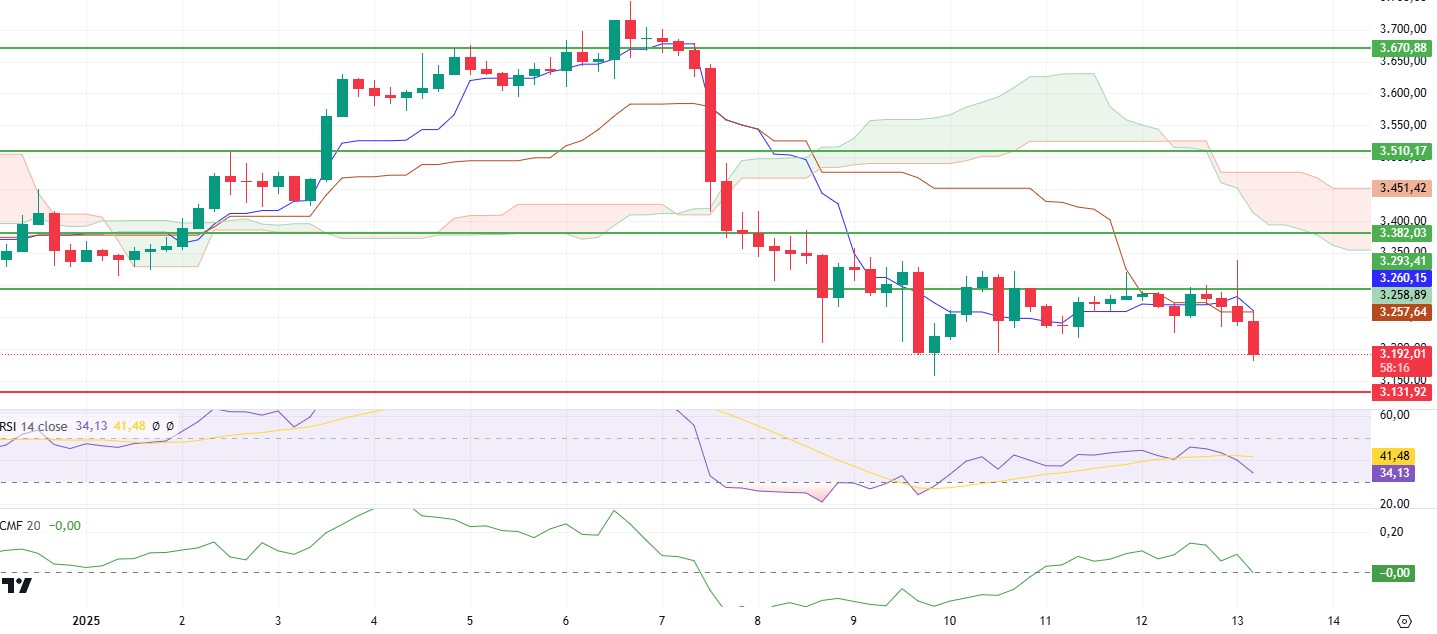
Although Ethereum tested the 3,293 level multiple times over the weekend, it failed to break through this level due to low volume and increased selling pressure, showing a slight decline. This situation reveals that the market cannot sustain the upward momentum and exhibits an indecisive structure.
When technical indicators are analyzed, the continuation of the downward movement in the Relative Strength Index (RSI) without any divergence indicates that the price displays a weak outlook. This negative trend suggests that selling pressure is strong. According to the Ichimoku indicator, the price is below the kumo cloud, indicating a downward trend, while the positive intersection of tenkan and kijun supports the possibility of a recovery in the short term. However, this signal may be limited due to the price’s position below the cloud. Chaikin Money Flow (CMF) showed a strong outlook, moving into positive territory over the weekend, but fell back to the zero zone with the recent decline. This indicates a weakening in capital flows and a decline in the risk appetite of market participants.
In terms of price movements, the 3,131 level stands out as the main support and in case this level is lost, deeper declines can be expected. On the other hand, if the 3,293 level is regained, the negative outlook of the market may disappear and sharp upward movements may be seen. Volume movements should be closely monitored for confirmation of the rise
Supports 3,131 – 3,033 – 2,901
Resistances 3,292 – 3,382 – 3,510
XRP/USDT
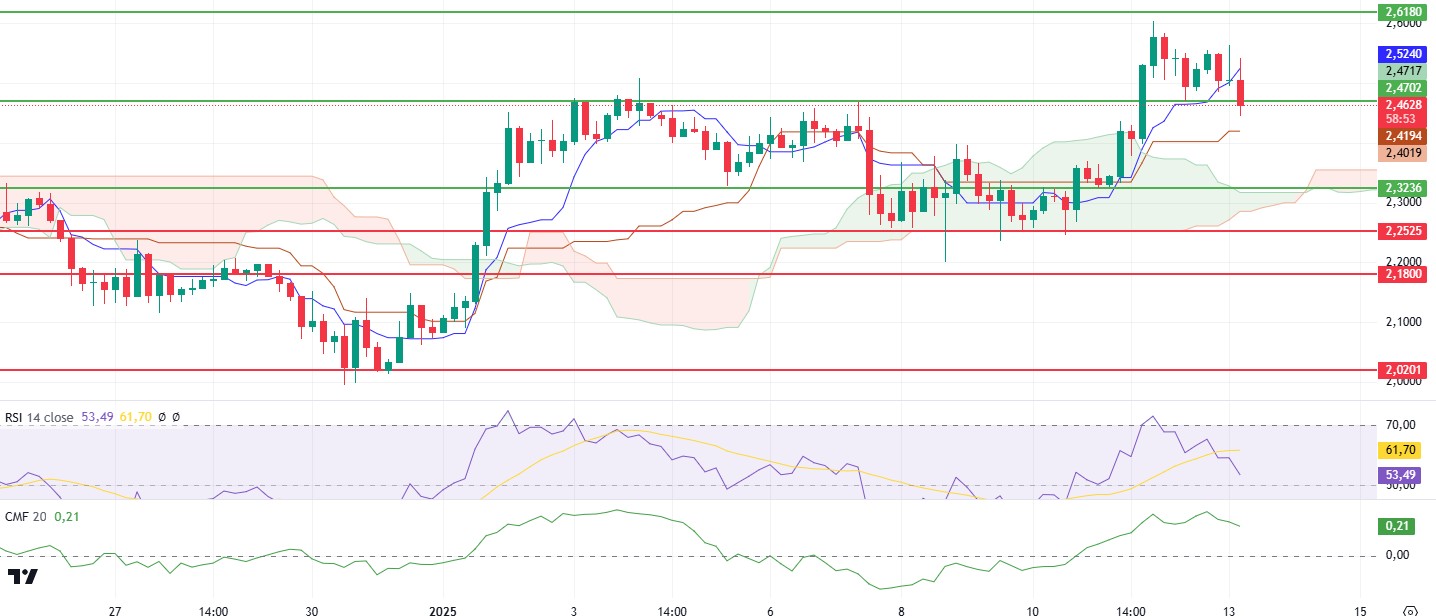
XRP, which drew a rising picture over the weekend, managed to rise to 2.47 and 2.61 resistance zones after regaining the 2.32 level, as expected. Then, with some retracement of the market on Sunday and this morning, XRP has also lost 2.47 support.
When technical indicators are analyzed with this price action, the Relative Strength Index (RSI) showed a negative divergence after entering the overbought zone with the price rising to 2.61 and the price retreated from this point. The RSI, which is currently hovering at 52 levels, maintains its downward trend. Chaikin Money Flow (CMF), on the other hand, remains strong in positive territory, indicating a strong buyer appetite. When the Ichimoku indicator is analyzed, the fact that the price is above the kumo cloud and kijun level makes the positive outlook dominant in the medium term, while the loss of the tenkan level indicates that there may be some further retracement in the short term.
In the light of this data, the price regaining the 2.47 level may support upward price movements. 2.32 continues to be an important support point. Closures below this level may prevent positive sentiment and cause declines.
Supports 2.3236 – 2.2525 – 2.1800
Resistances 2.4702 – 2.6180 – 2.8528
SOL/USDT
Leah Wald, CEO of Sol Strategies, doubts that spot Solana exchange-traded funds (ETFs) will be approved in the United States in 2025. Despite the growing interest in SOL and its ecosystem, Wald believes that regulatory hurdles and a change in leadership at the Securities and Exchange Commission (SEC) will delay the immediate approval of spot SOL ETFs. On Onchain, whales sent 446,064 SOLs worth $73.68 million to a centralized exchange. It shows that SOL stake deposits have increased significantly amid the market downturn. About Solana deposited 1.4 million SOLs to mitigate losses with passive income amid the market volatility.
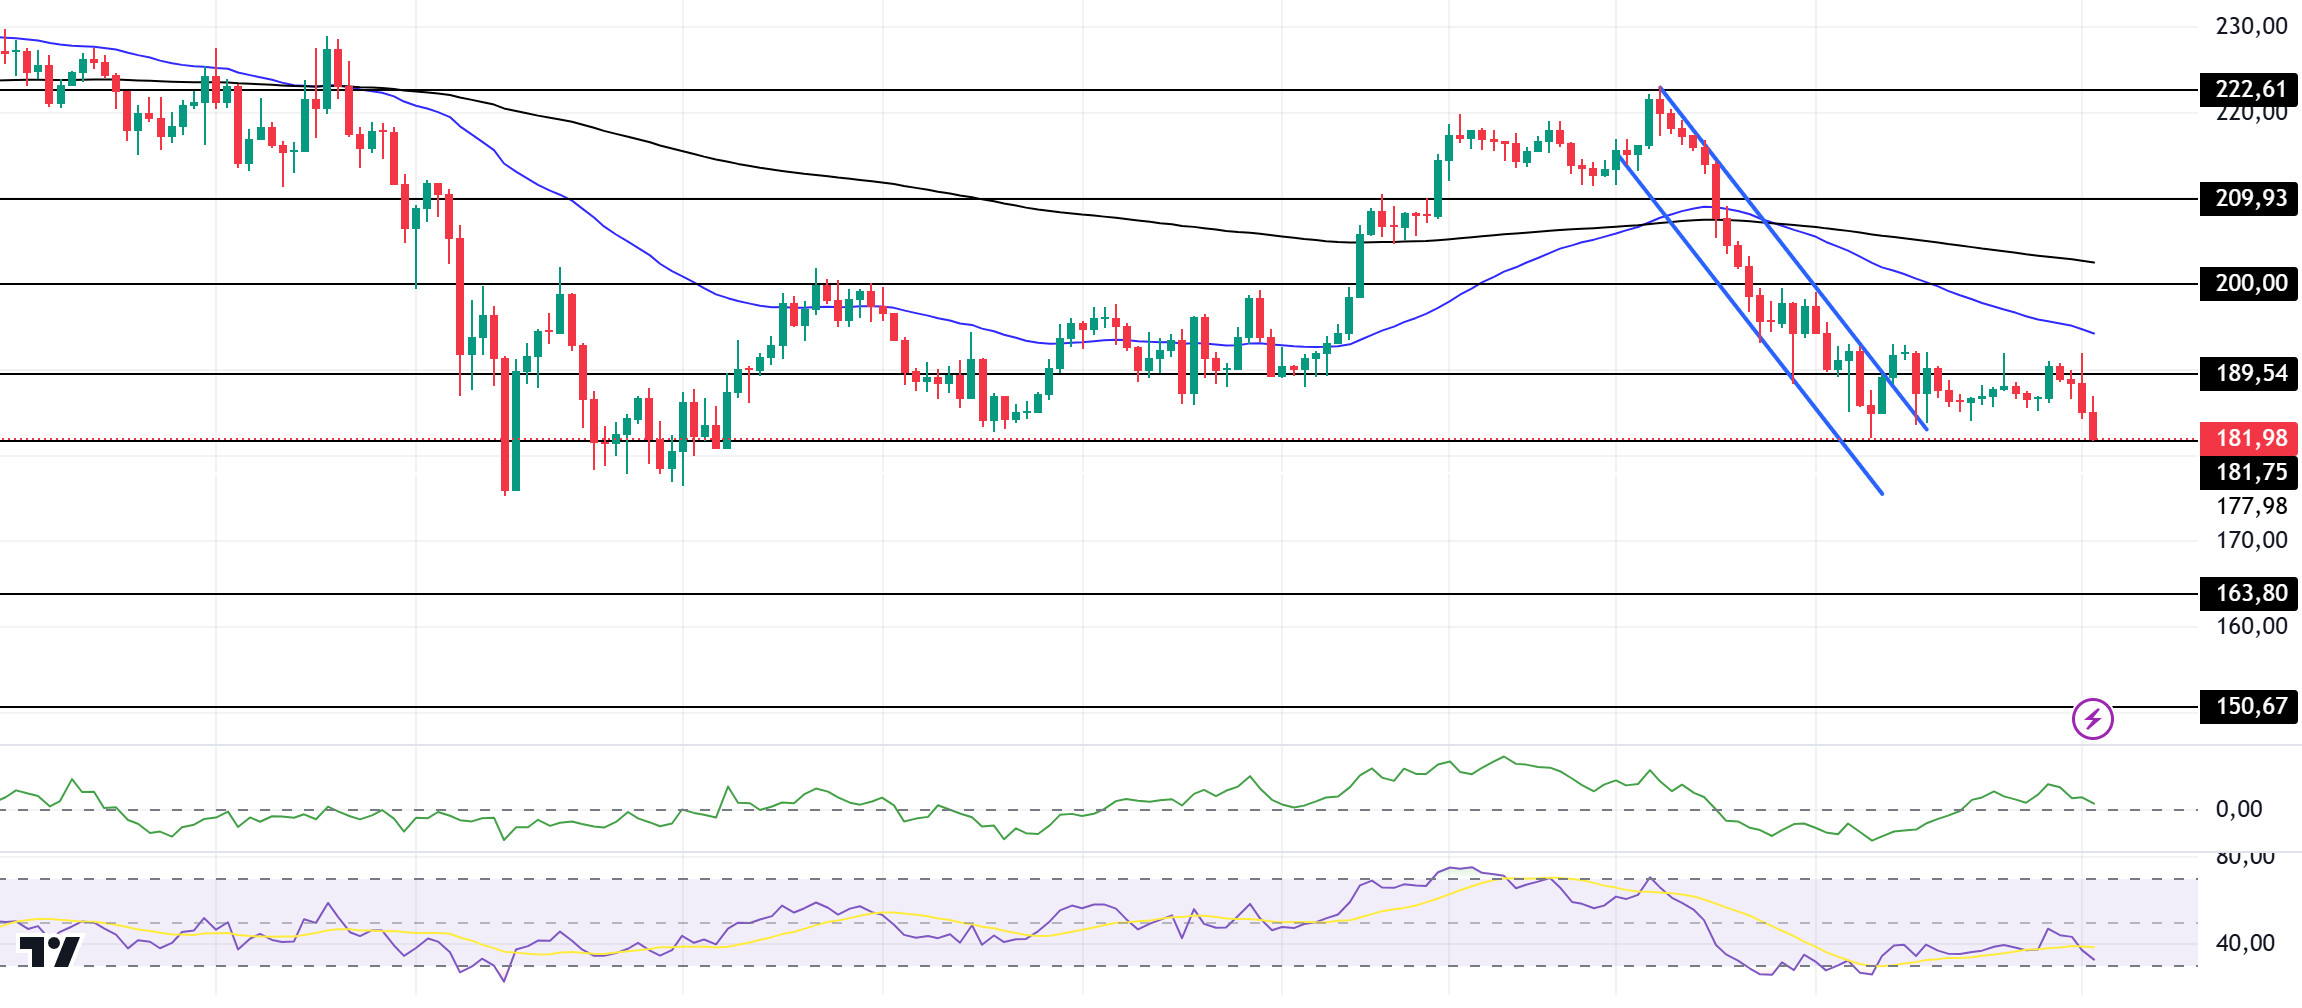
Solana seems to be weakening day by day due to the ongoing market uncertainty. Solana price is moving sideways after breaking below the 189.54 support levels. On the 4-hour timeframe, the 50 EMA (Blue Line) broke the 200 EMA (Black Line) to the downside. This may increase selling pressure. Chaikin Money Flow (CMF)20 indicator is in positive territory but inflows have started to decline. However, the Relative Strength Index (RSI)14 indicator is moving to the oversold level. The 200.00 level appears to be a very strong resistance point in the rises driven by both the upcoming macroeconomic news and the news in the Solana ecosystem. If it breaks here, the rise may continue. In case of retracements for the opposite reasons or due to profit sales, the 181.75 support level can be triggered. If the price reaches these support levels, a potential bullish opportunity may arise if momentum increases.
Supports 181.75 – 163.80 – 150.67
Resistances 189.54 – 200.00 – 209.93
DOGE/USDT
Elon Musk stated on the X platform that Bitcoin and Dogecoin prices may experience a significant decline in the next two years, which depends on the resolution of dollar inflation. On the other hand, whale wars have begun. Taking advantage of the asset decline, whales bought 470 million DOGE. However, Whale Alert reported that two transactions totaling 219 million DOGE, worth over $73.8 million, were transferred from unknown wallets to centralized exchanges. However, as Trump’s inauguration approaches, Open Interest has surpassed $3.5 Billion. Trump’s inauguration has traders anticipating potential gains.
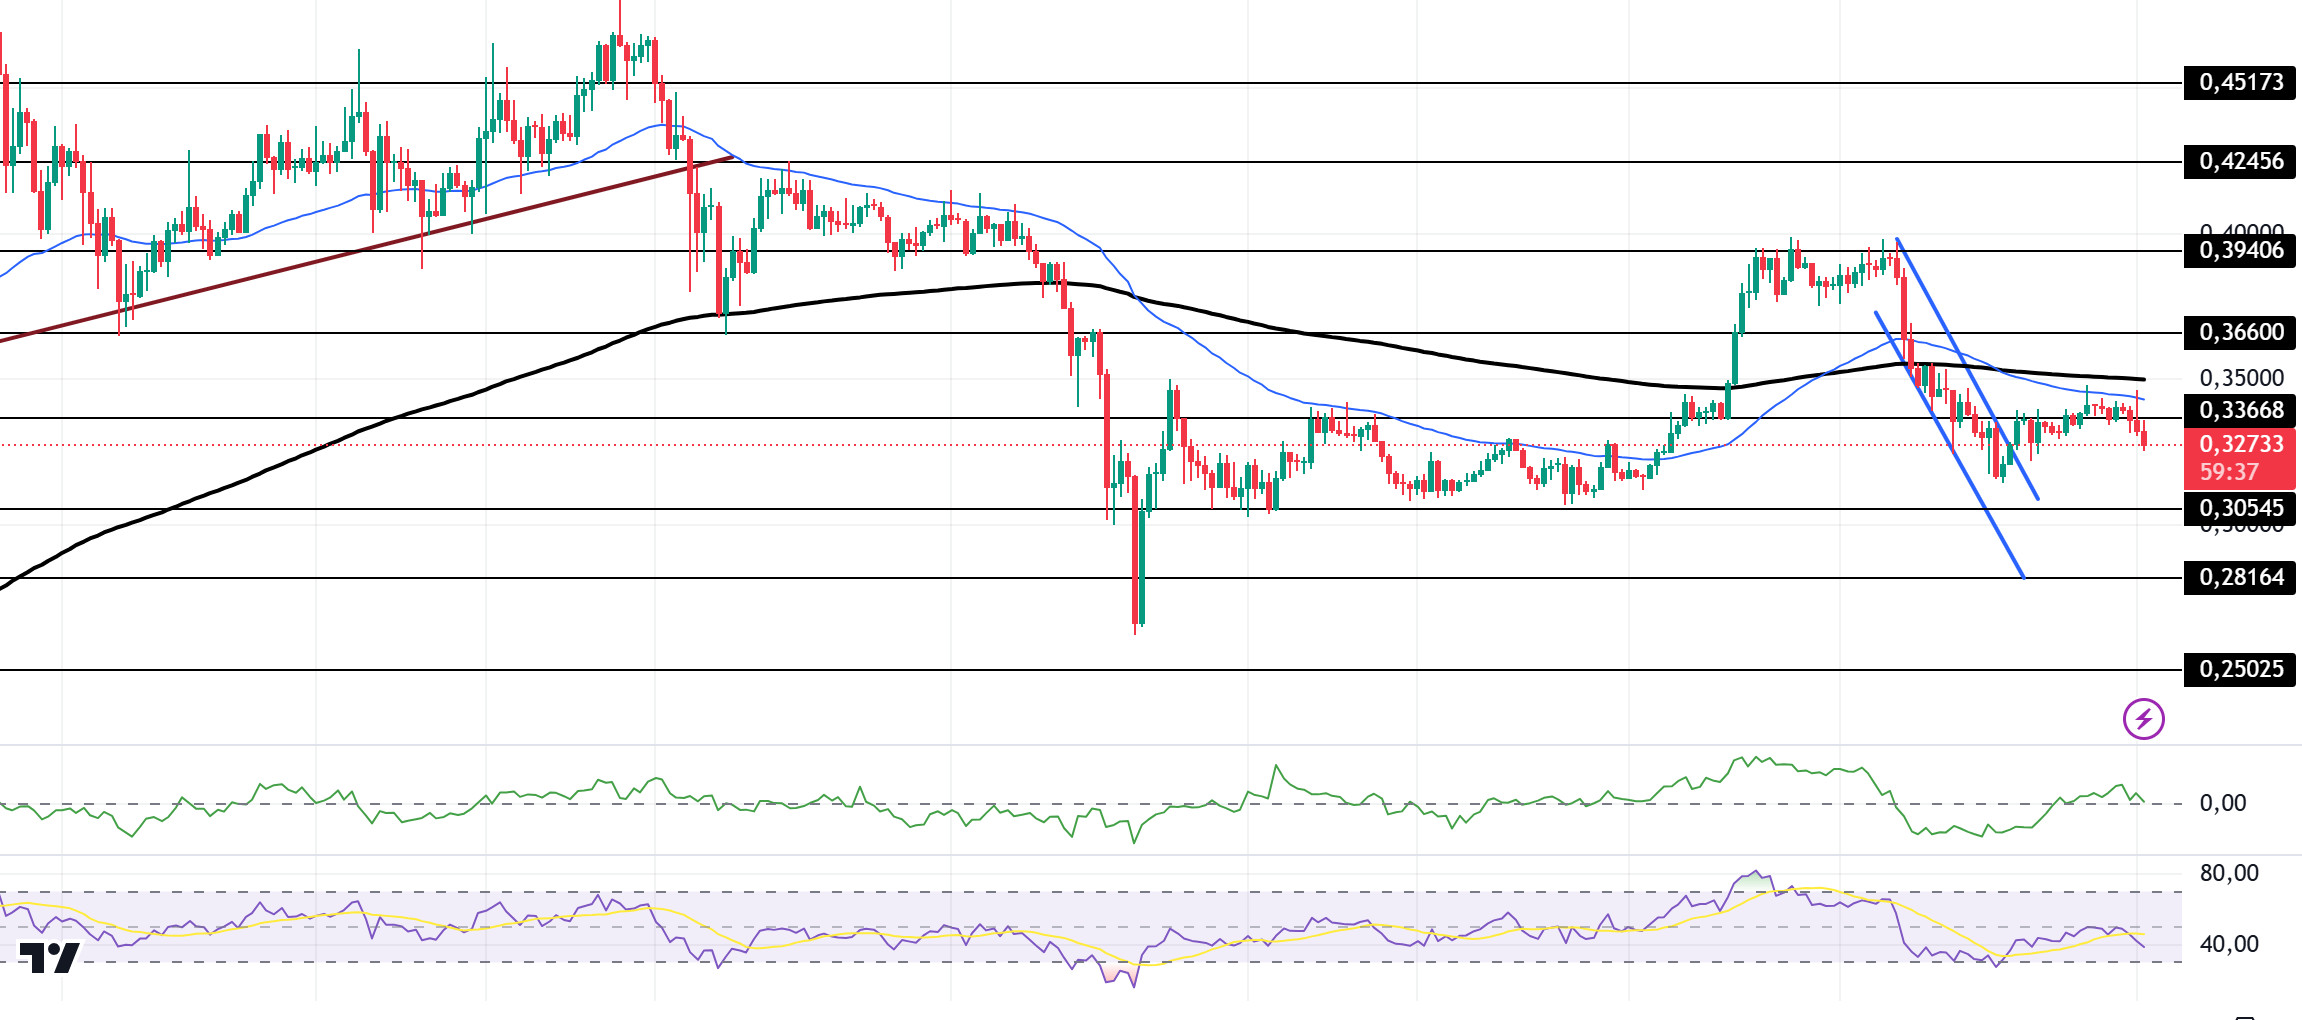
Looking at the chart, the asset moved horizontally, breaking the downtrend that has been going on since January 7. On the 4-hour timeframe, the 50 EMA (Blue Line) is below the 200 EMA (Black Line). At the same time, the price continues to be below both the 50 EMA and the 200 EMA. However, the asset tried to move up but hit resistance from the 50 EMA and is experiencing a pullback. This could add to bearish pressure. When we examine the Chaikin Money Flow (CMF)20 indicator, it is in the neutral zone and money inflows and outflows seem to have stabilized. However, Relative Strength Index (RSI)14 is heading towards the oversold zone. All these may increase the selling pressure. The 0.39406 level appears to be a very strong resistance point in the rises due to political reasons, macroeconomic data and innovations in the DOGE coin. In case of possible pullbacks due to political, macroeconomic reasons or negativities in the ecosystem, the 0.28164 level, which is the base level of the trend, is an important support. If the price reaches these support levels, a potential bullish opportunity may arise if momentum increases.
Supports 0.30545 – 0.28164 – 0.25025
Resistances 0.33668 – 0.36600 – 0.39406
LEGAL NOTICE
The investment information, comments and recommendations contained herein do not constitute investment advice. Investment advisory services are provided individually by authorized institutions taking into account the risk and return preferences of individuals. The comments and recommendations contained herein are of a general nature. These recommendations may not be suitable for your financial situation and risk and return preferences. Therefore, making an investment decision based solely on the information contained herein may not produce results in line with your expectations.


