
MARKET SUMMARY
Latest Situation in Crypto Assets
| Assets | Last Price | 24h Change | Dominance | Market Cap. |
|---|---|---|---|---|
| BTC | 105,171.37 | 2.66% | 57.34% | 2,08 T |
| ETH | 3,393.91 | 4.75% | 11.25% | 408,91 B |
| XRP | 3.176 | 2.85% | 5.03% | 182,92 B |
| SOLANA | 266.77 | 8.00% | 3.57% | 129,75 B |
| DOGE | 0.3622 | 3.28% | 1.47% | 53,53 B |
| CARDANO | 1.0000 | 2.73% | 0.97% | 35,17 B |
| TRX | 0.2596 | 5.12% | 0.62% | 22,37 B |
| LINK | 25.98 | 4.89% | 0.46% | 16,55 B |
| AVAX | 36.32 | 2.69% | 0.41% | 14,93 B |
| SHIB | 0.00002038 | 2.05% | 0.33% | 12,01 B |
| DOT | 6.492 | 2.47% | 0.28% | 10,00 B |
*Prepared on 1.24.2025 at 14:00 (UTC)
WHAT’S LEFT BEHIND
MicroStrategy to Resolve $1.05 Billion in Bonds with Equity
MicroStrategy decided to redeem its $1.05 billion convertible bonds due in 2027 and pay the conversion requests in stock.
Phemex Hacked: $69.1 Million Crypto Assets Stolen
According to PeckShieldAlert, the Phemex exchange was hacked and a total of $69.1 million in crypto assets were lost from multiple chains, including Ethereum, Solana, XRP, Bitcoin, BNB.
Digital Euro Could Be the Answer to US Dollar Stablecoin Plan
ECB member Piero Cipollone stated that Trump’s move to develop US dollar stablecoins increases the necessity to launch a digital euro.
Vitalik Buterin: “713 thousand ETH can be burned per year”
Ethereum founder Vitalik Buterin stated that the amount of ETH burned annually could reach 713 thousand by promoting layer 2 networks and increasing blob capacity.
Solana Spot ETF Filings on the Agenda at the SEC
The SEC is expected to make a decision on Grayscale and 4 other companies’ Solana spot ETF applications this week. After the Bitcoin spot ETF approval, a new era may begin for altcoins.
85 Million Dollar Bonds Priced for Bitcoin Investment
Semler Scientific priced an $85 million convertible bond maturing in 2030 with an interest rate of 4.25% per annum for Bitcoin investment.
Elizabeth Warren Maintains Anti-Crypto Stance
Elizabeth Warren has demanded an investigation into Trump’s initiatives on meme coins. Warren has long called for stricter regulations on cryptocurrencies.
Trump’s Commerce Secretary Nominee to Sell Shares
Howard Lutnick announced that he would sell his stakes in GE Healthcare, GE Vernova, GE Aerospace and Nasdaq if confirmed as Secretary of Commerce.
Justin Sun Accuses XCN of Market Manipulation
Justin Sun accused the XCN project of massive market manipulation, urging exchanges to be wary of such projects.
HIGHLIGHTS OF THE DAY
Important Economic Calender Data
| Time | News | Previous |
|---|---|---|
| 14:45 | US Flash Manufacturing PMI | 49.8 |
| 14:45 | US Flash Services PMI | 56.4 |
| 15:00 | US Existing Home Sales (Dec) | 4.19M |
| 15:00 | US Michigan Consumer Sentiment (Jan) | 73.3 |
INFORMATION
*The calendar is based on UTC (Coordinated Universal Time) time zone.
The economic calendar content on the relevant page is obtained from reliable news and data providers. The news in the economic calendar content, the date and time of the announcement of the news, possible changes in the previous, expectations and announced figures are made by the data provider institutions. Darkex cannot be held responsible for possible changes that may arise from similar situations
MARKET COMPASS
The important news of the day for digital assets was that the new President Trump signed the highly anticipated decree on the Cryptocurrency Task Force yesterday. Trump’s silence on the crypto world, which has put pressure on digital asset prices in recent days, has come to an end. In the details of the decree, we see that almost every issue that the President mentioned during the election campaign is included, and the Unit in question is expected to submit a report to Trump after six months. Nevertheless, crypto assets did not rise after this important news flow. We attribute this to a phenomenon of anticipation, the details of which are known, expected and already included in the prices.
Wall Street futures seem to be affected by profit selling after yesterday’s rises. A slightly negative opening is expected. President Trump’s softening stance on tariffs had a positive impact on US indices yesterday. Later in the day, US data will be under the spotlight of the markets. In digital assets, we think that the situation after the non-incoming rise indicates that the horizontal and pressurized course will continue for a while.
From the short term to the big picture.
The victory of former President Trump on November 5, which was one of the main pillars of our bullish expectation for the long-term outlook in digital assets, produced a result in line with our predictions. In the aftermath, the appointments made by the president-elect and the increasing regulatory expectations for the crypto ecosystem in the US and the emergence of BTC as a reserve continued to be in our equation as positive variables. Then, 4 days after taking over the White House, the new President signed the decree of the Cryptocurrency Work Unit, which was among his election promises, and we think that the outputs it will produce in the coming days will continue to reflect positively on digital assets.
On the other hand, although it is expected to continue at a slower pace, the expectations that the FED will continue its interest rate cut cycle (for now) and the fact that the volume in ETFs based on crypto assets indicates an increase in institutional investor interest support our upward forecast for the big picture for now. In the short term, given the nature of the market and pricing behavior, we think it would not be surprising to see occasional pauses or pullbacks in digital assets. However, at this point, it is worth emphasizing again that we think that the fundamental dynamics continue to be bullish.
TECHNICAL ANALYSIS
BTC/USD
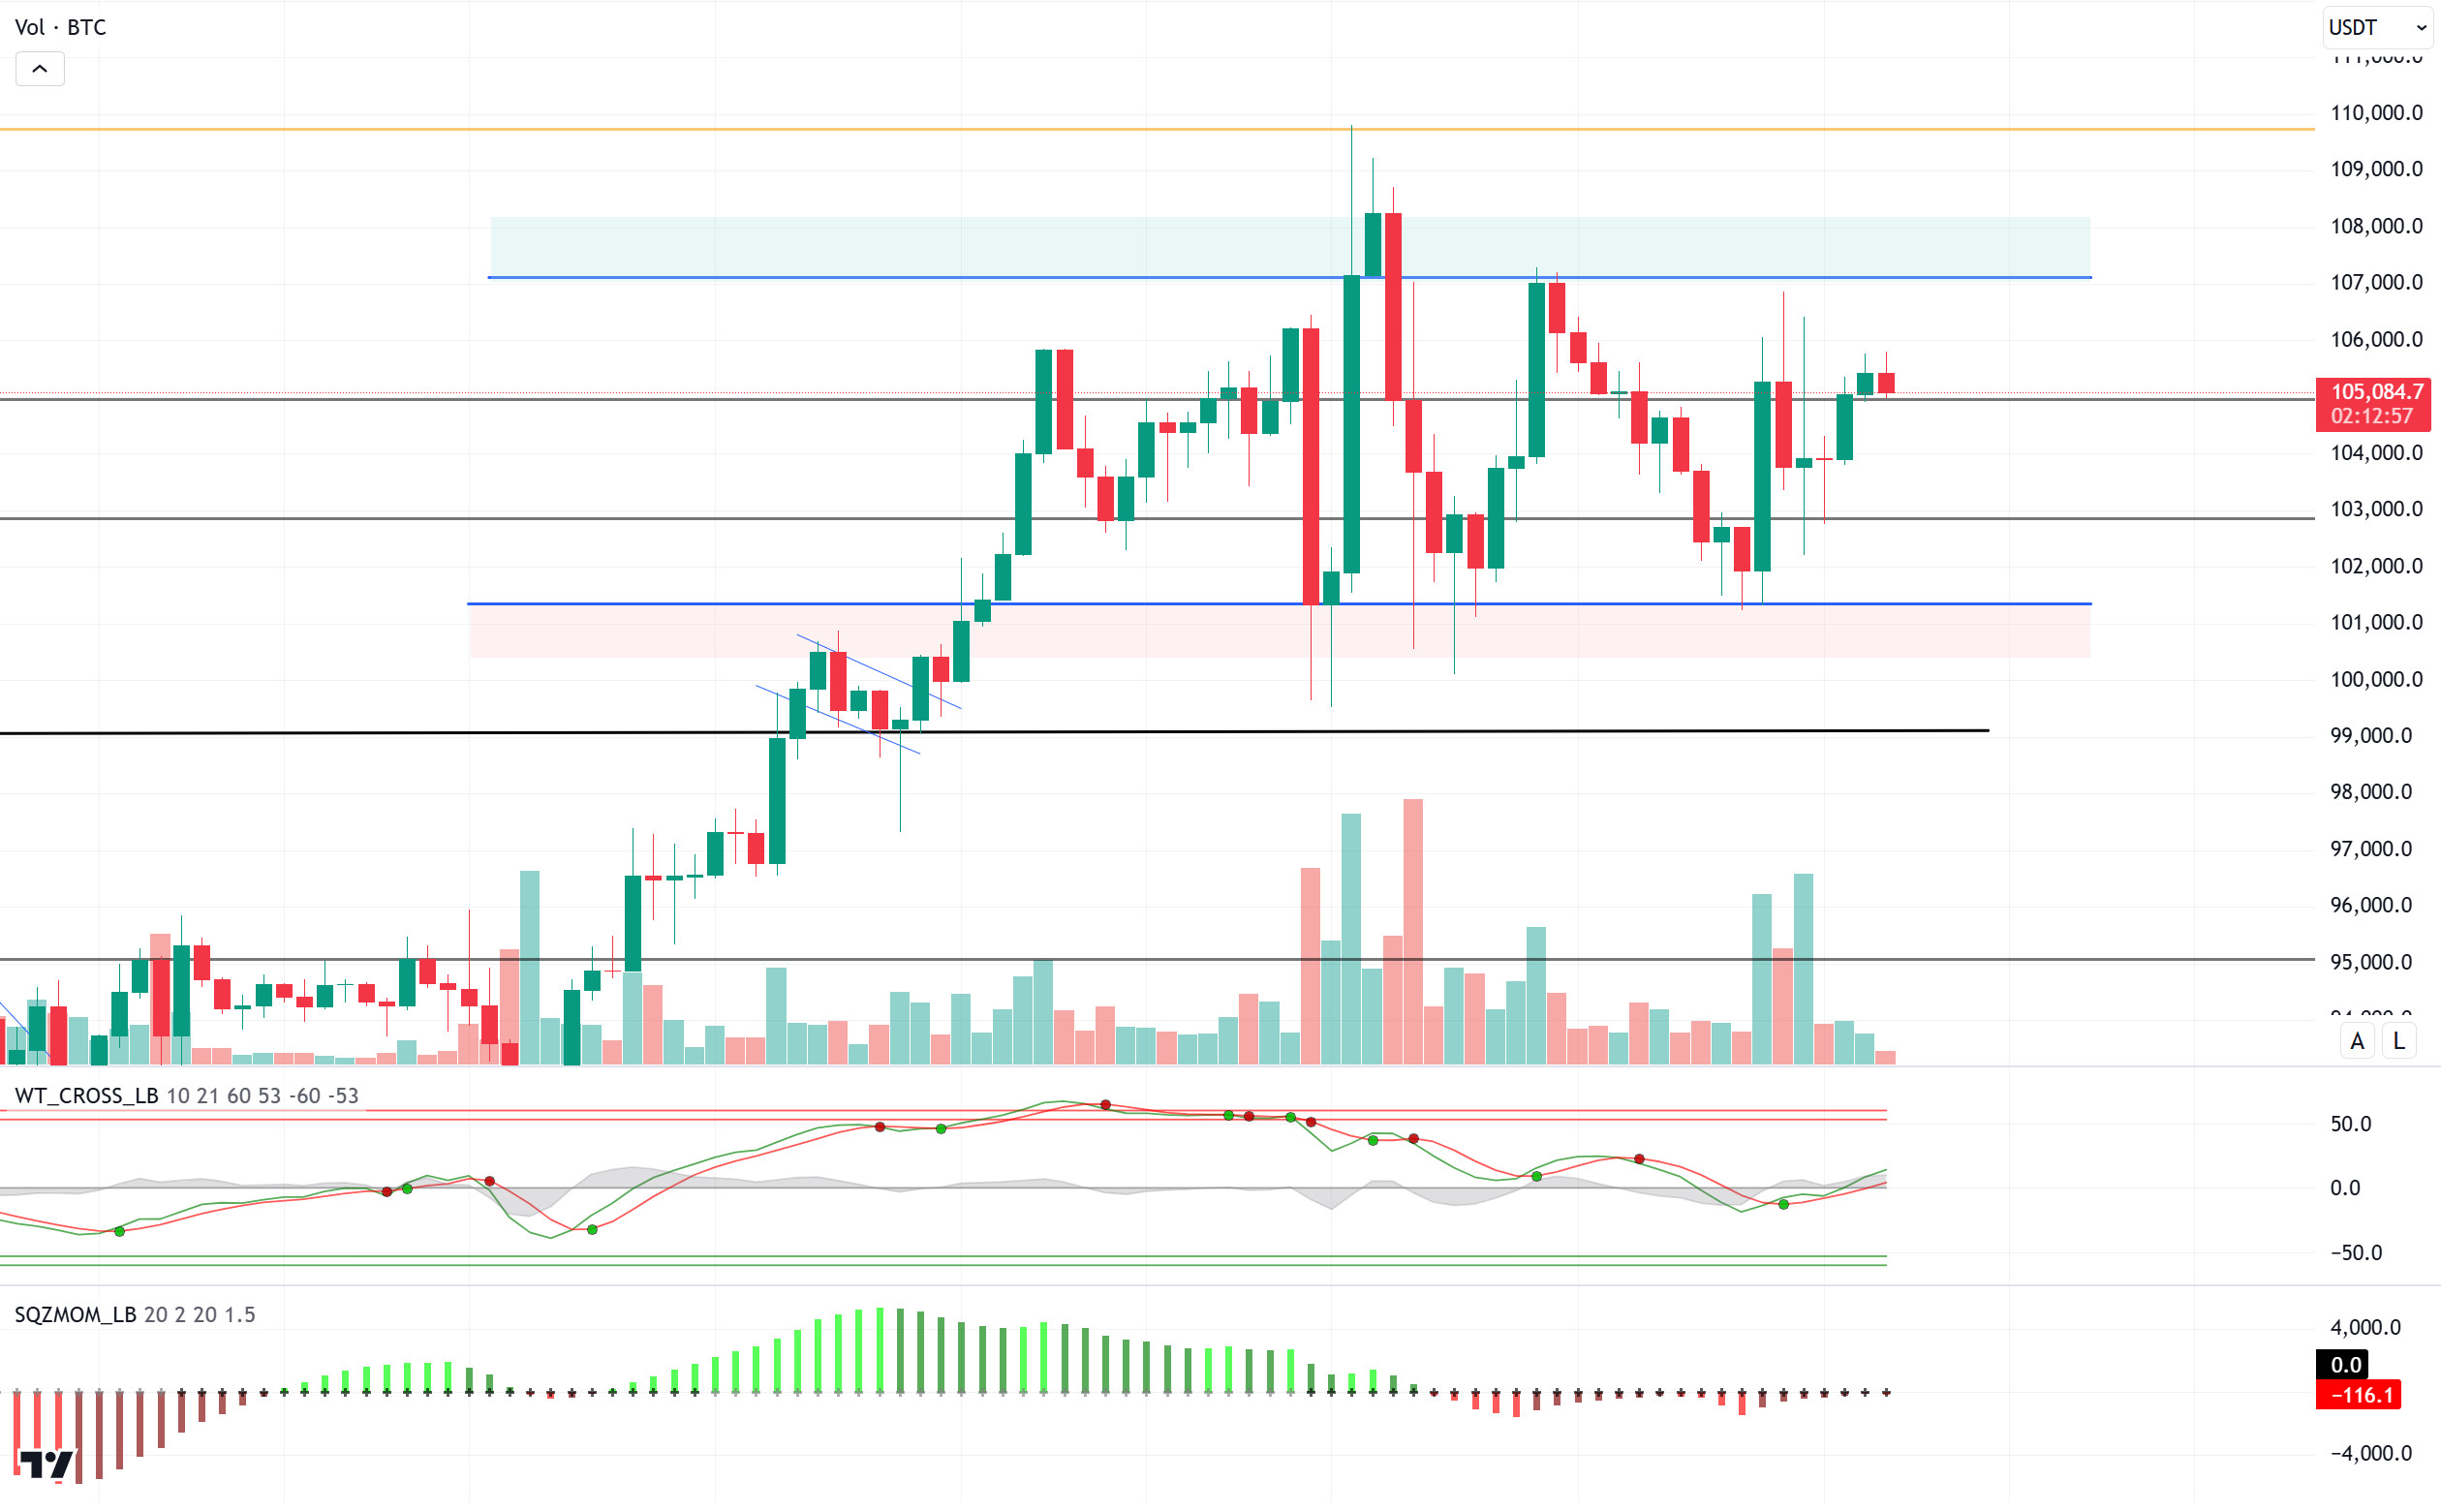
The “Bitcoin strategic reserve” issue, which Donald Trump has been raising since the summer months, took a new dimension with the decree published last night. The debate centered around the question of whether the US should create a general “crypto reserve” or only a “Bitcoin reserve”. While Bitcoin maximalists argued that the reserve should consist only of Bitcoin, the Treasury Department did not seem to favor the “Bitcoin strategic reserve” view.
When we look at the technical outlook, the price, which pushed the 105,000-resistance zone in the morning hours, managed to break this level and reached 105,800 levels. BTC, which has retreated to 105,084 as of now, is seen to be in an effort to hold above the resistance zone. Closures above these levels may bring upward movements. Indeed, while technical oscillators continue to signal buying, the momentum indicator is trying to regain strength. In a possible new wave of sales, we will follow the 104,400 level as a minor support point.
Supports: 104,400 – 102,800 – 101,400
Resistances 105,000 – 102,800 – 105,000
ETH/USDT
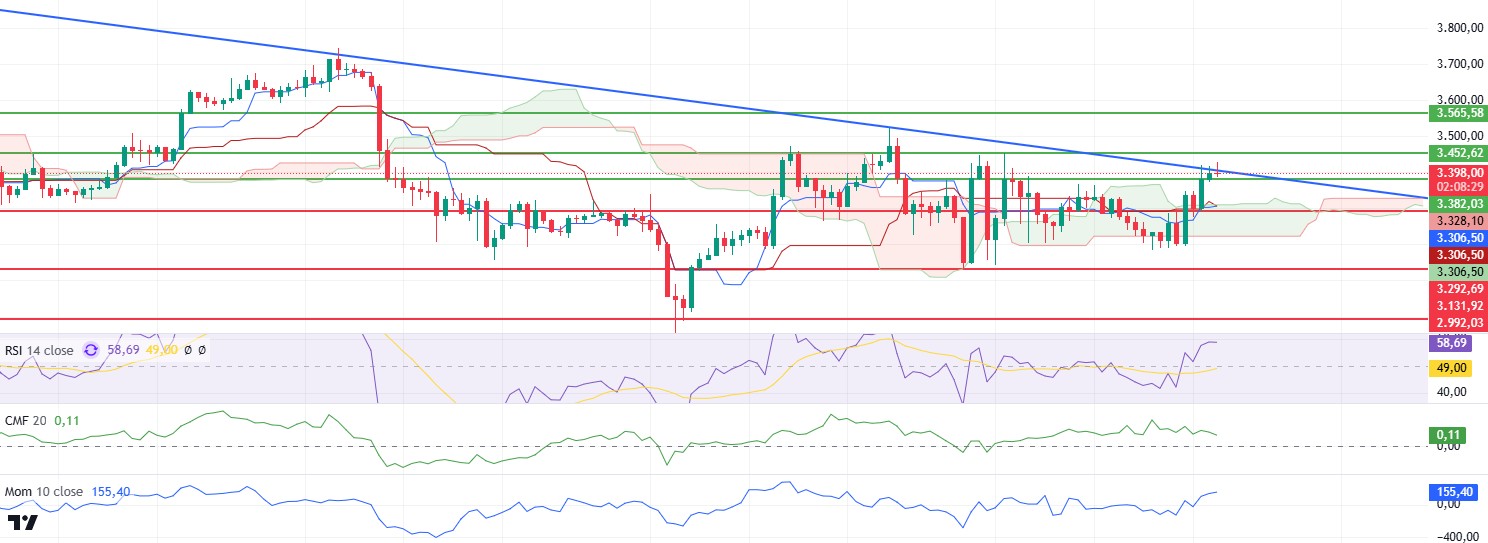
Following yesterday’s developments, ETH price followed a sideways trend during the day, but failed in its attempts to break through the trend line and fell back below the $3,400 level after the rejection from this area. Technical indicators provide important clues about the market outlook.
Looking at the Cumulative Volume Delta (CVD) data, it can be seen that the price increase was largely driven by the movements on the futures side. This has led to an increase in open interest and funding rate levels, and it is possible to say that these indicators present a negative picture. However, a strong buying support from the spot market may change this negative outlook. On the other hand, the Chaikin Money Flow (CMF) indicator also does not support a price increase, suggesting that investors should be cautious at current levels. However, the bullish trend in the Relative Strength Index (RSI) and momentum indicators is positive for price action. The RSI indicates that the market is not yet in overbought or oversold territory and that bullish potential remains.
Overall, the price’s rise without support from the spot market and the rejection from the trend line indicate that the negative outlook is strengthening. In this context, a daily close below $3,382 could trigger a correction in ETH price. However, if the price manages to stay above the trend line and close above the $3,452 level, the uptrend can be expected to continue more aggressively.
Supports 3,292 – 3,131 – 2,992
Resistances 3,382 – 3,452 – 3,565
XRP/USDT
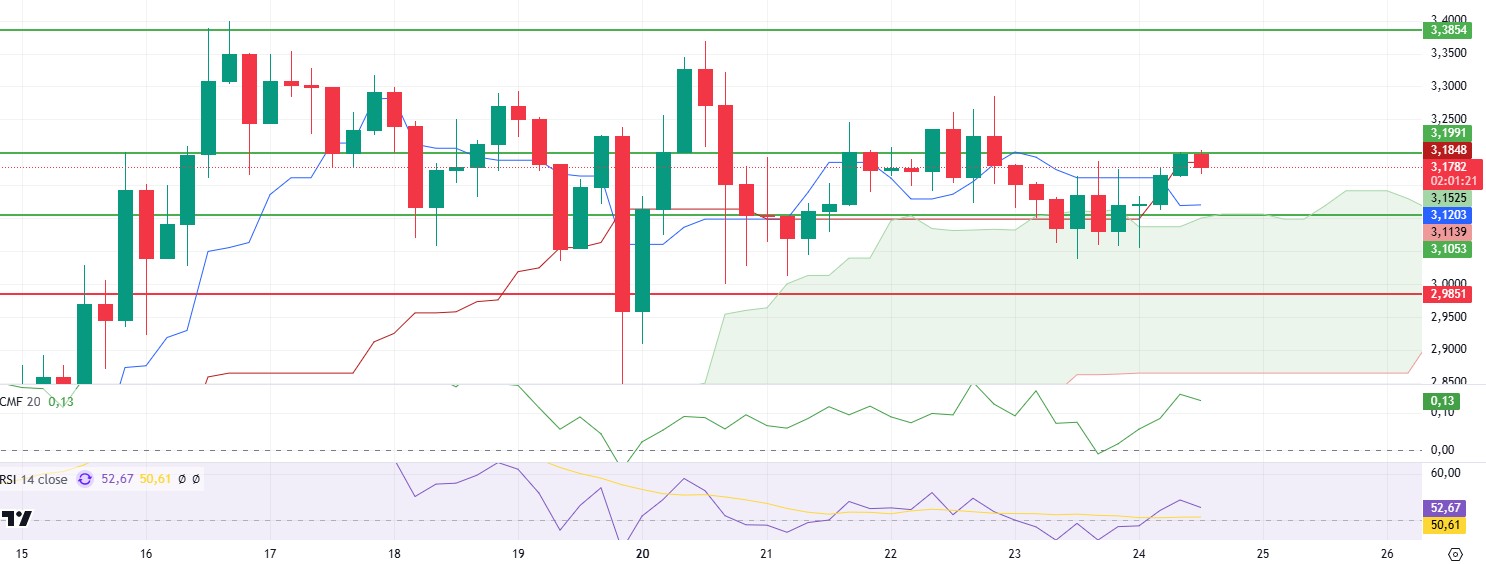
XRP, which managed to rise up to the 3.20 resistance level during the day, has been rejected from this region and has retreated slightly.
Chaikin Money Flow (CMF) moves in parallel with the price, does not create any mismatch and remains in the positive area, indicating that buyers remain strong. The Relative Strength Index (RSI) indicator is similarly moving in correlation with the price, accompanying the rise.
In this context, it seems likely that an upward movement up to 3.38 levels will come after the 3.20 resistance level is exceeded. Breaching the 3.10 kumo support level carries the risk of bringing deeper declines.
Supports 3.1053 – 2.9851 – 2.7268
Resistances 3.1991 – 3.3854 – 3.5039
SOL/USDT
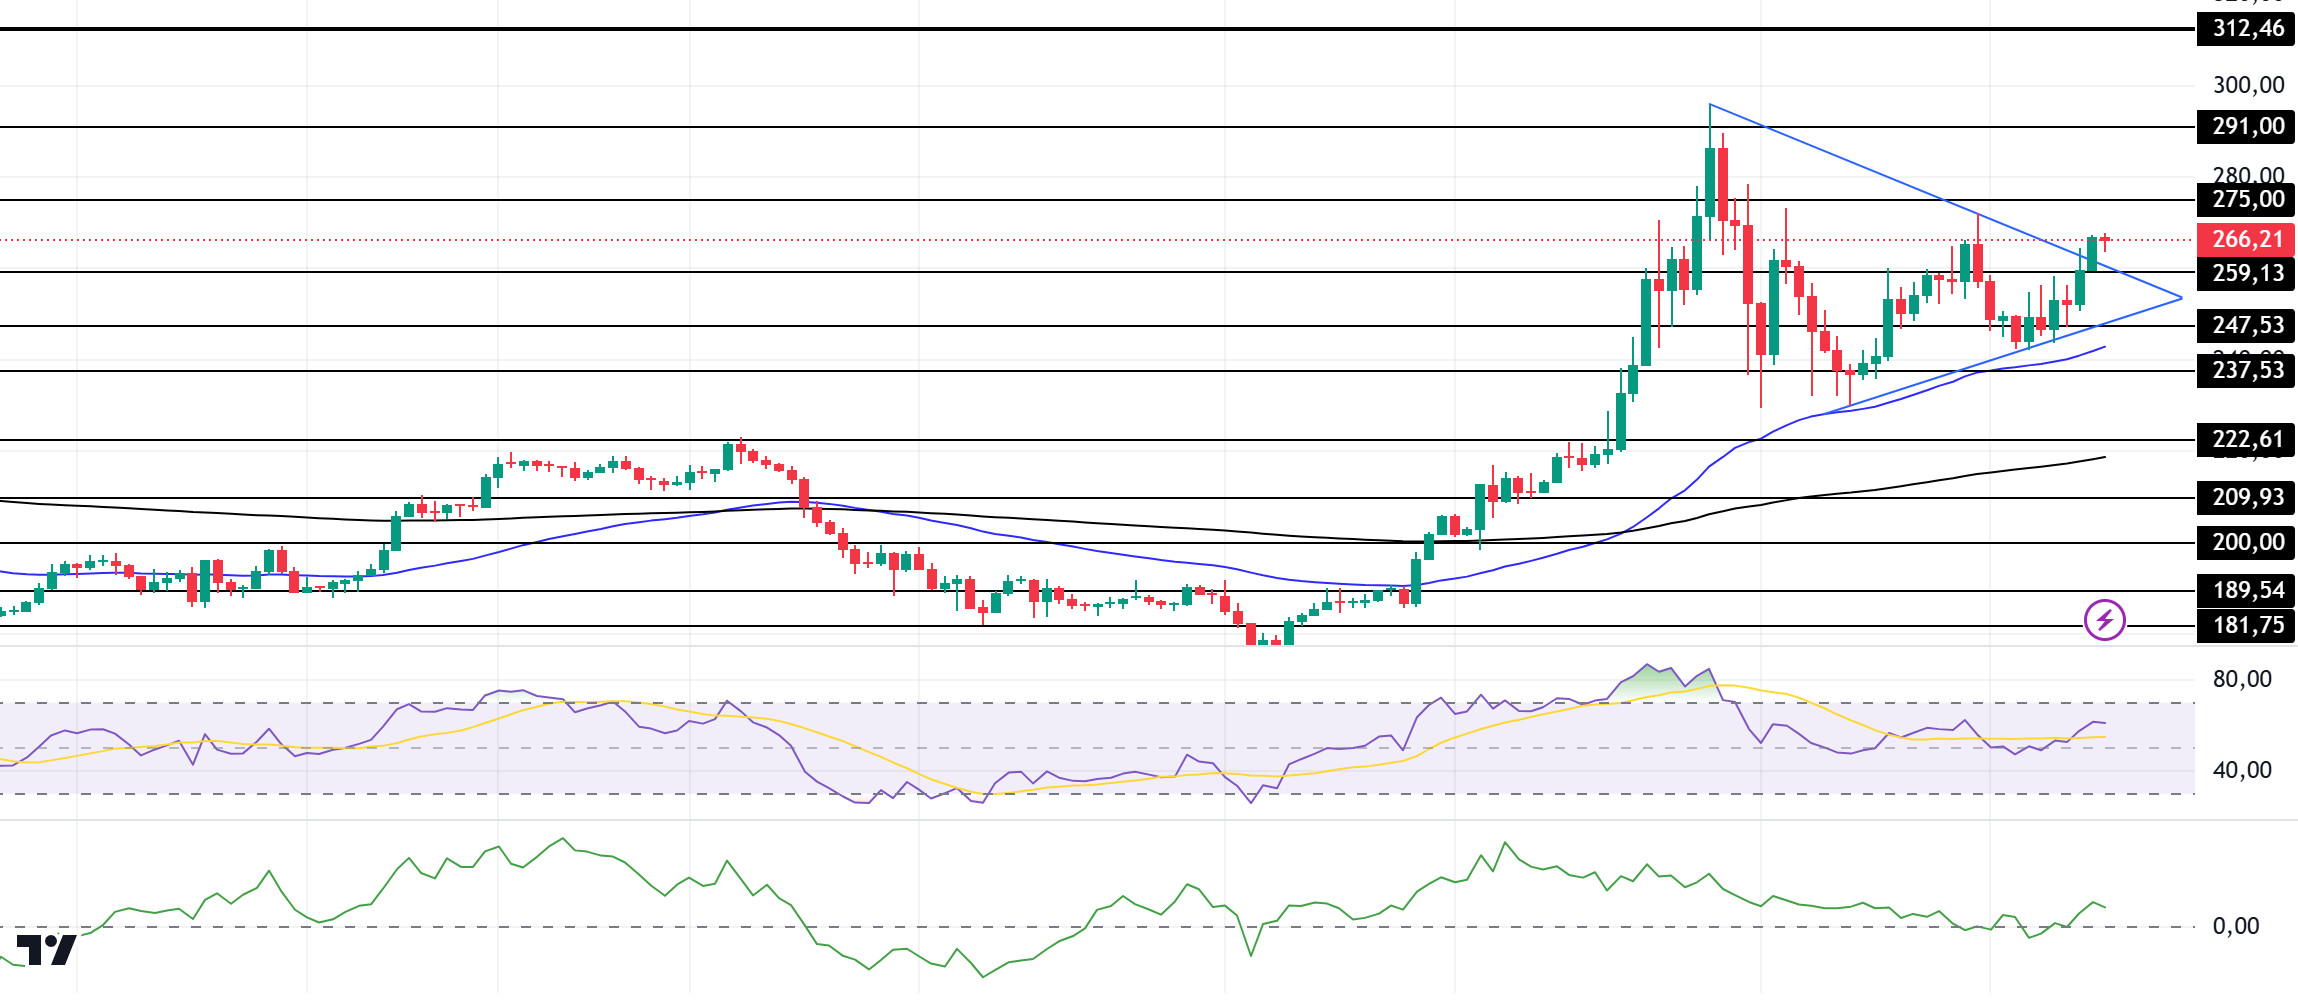
Solana’s total stablecoin supply surpassed $10 billion for the first time, reaching a new high. The value of stablecoins on the network has increased by nearly 110% since January, from $5.1 billion to $10.8 billion.
SOL broke the resistance of the symmetrical triangle pattern to the upside and turned slightly bullish. On the 4-hour timeframe, the 50 EMA (Blue Line) continues to be above the 200 EMA (Black Line). At the same time, the asset is above the 50 EMA and the 200 EMA. These could mean that the uptrend will continue in the medium term. When we examine the Chaikin Money Flow (CMF)20 indicator, it came from the neutral zone to the positive zone, but money inflows are decreasing. However, the Relative Strength Index (RSI)14 indicator came to the middle level of the positive zone. The 275.00 level appears to be a very strong resistance point in the rises driven by both the upcoming macroeconomic data and the news in the Solana ecosystem. If it breaks here, the rise may continue. In case of retracements for the opposite reasons or due to profit sales, the 209.93 support level can be triggered. If the price reaches these support levels, a potential bullish opportunity may arise if momentum increases.
Supports 259.13 – 247.53 – 237.53
Resistances 275.00 – 291.00 – 312.46
DOGE/USDT
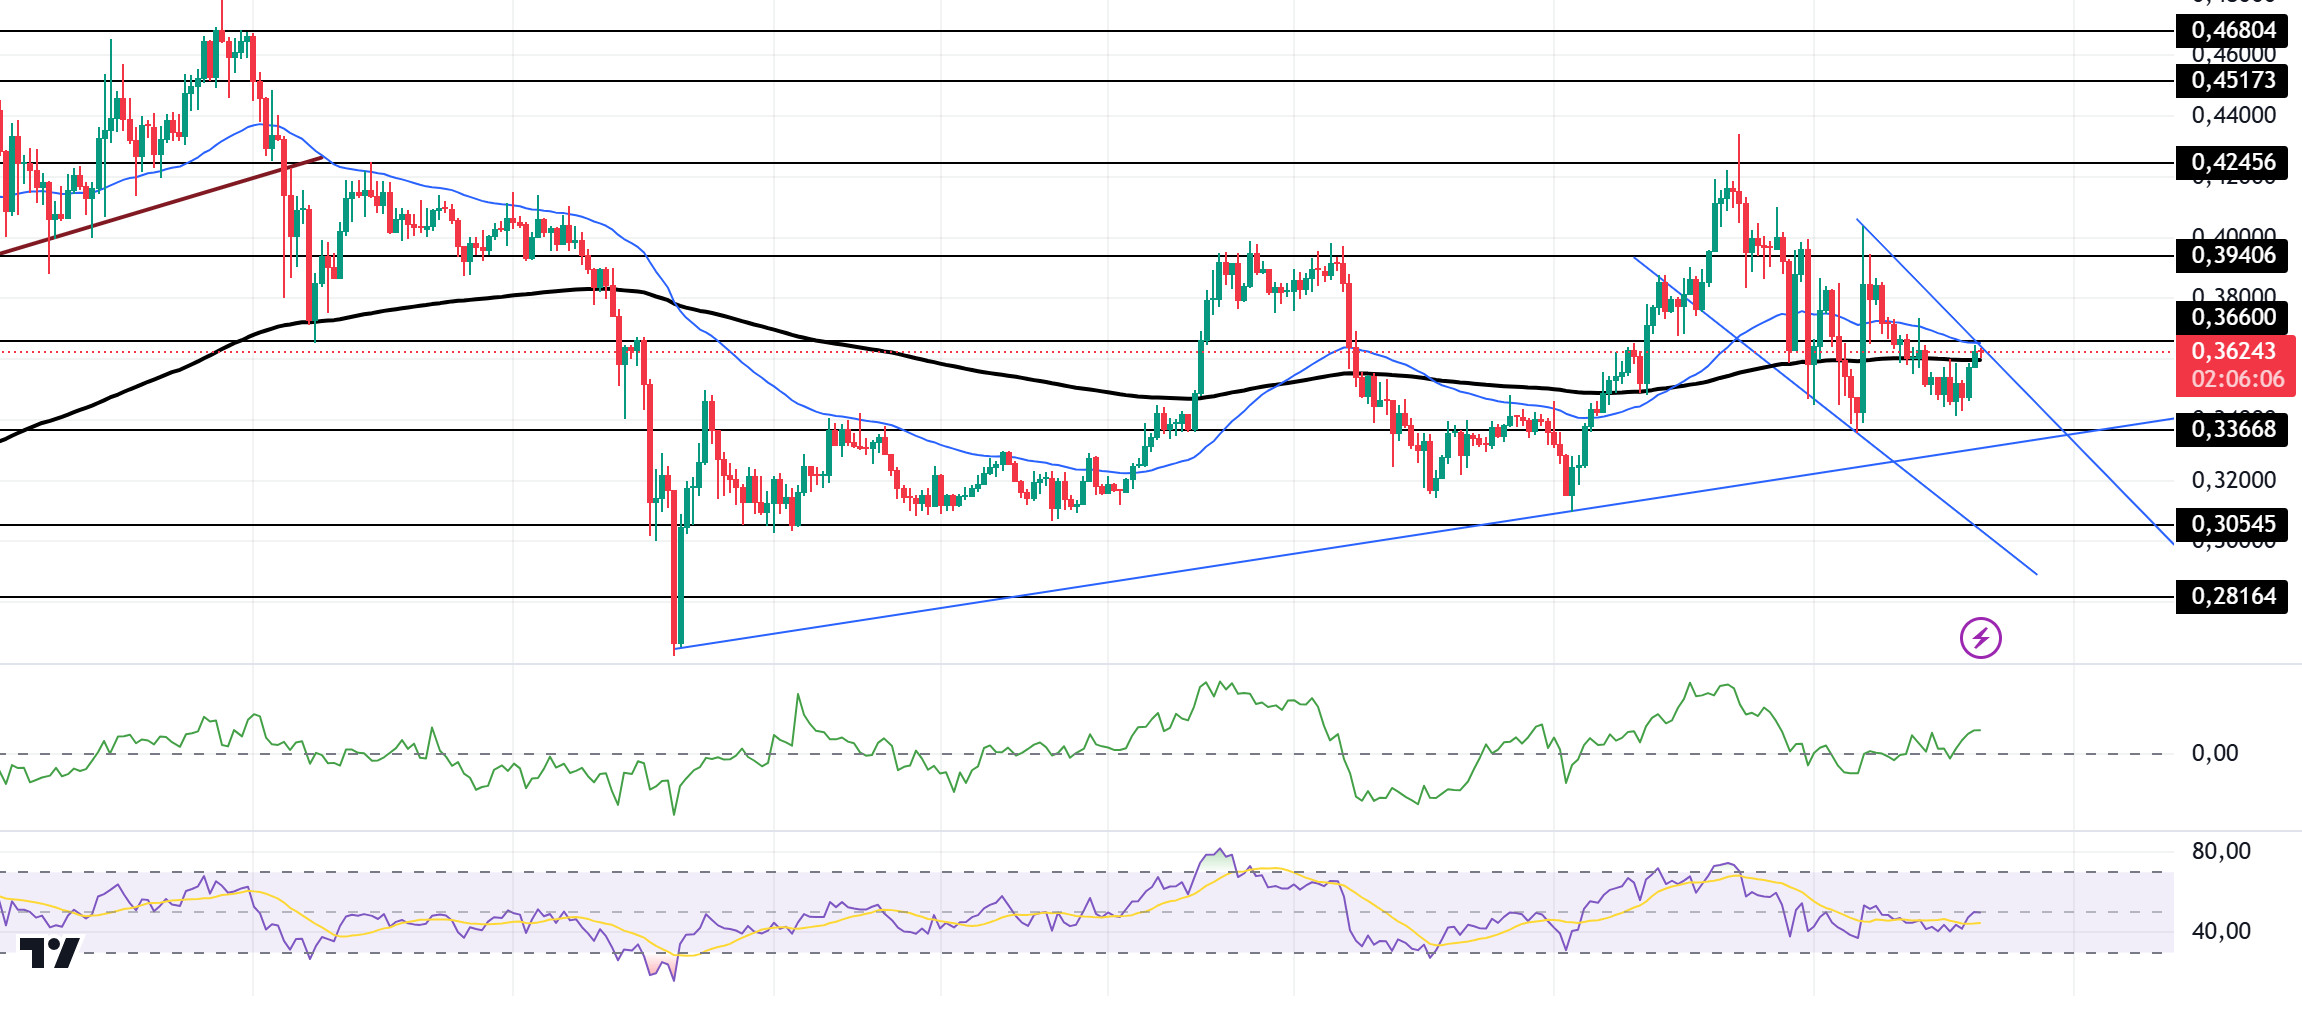
DOGE has been moving horizontally since our morning analysis. On the 4-hour timeframe, a falling wedge pattern seems to have formed. If this pattern works, the price may rise strongly. The asset is stuck between the 50 EMA (Blue Line) and the 200 EMA (Black Line) and is trying to find a direction. At the time of writing, the 50 EMA is working as resistance and the 200 EMA as support. The 50 EMA continues to hover above the 200 EMA. However, the 50 EMA has turned down. This could lead to a bullish reversal. When we examine the Chaikin Money Flow (CMF)20 indicator, it moved from the neutral zone to the positive zone and it is seen that money inflows are decreasing. However, Relative Strength Index (RSI)14 is in the neutral zone. The 0.39406 level stands out as a very strong resistance point in the rises due to political reasons, macroeconomic data and innovations in the DOGE coin. In case of possible pullbacks due to political, macroeconomic reasons or negativities in the ecosystem, the 0.33668 level, which is the base level of the trend, is an important support. If the price reaches these support levels, a potential bullish opportunity may arise if momentum increases.
Supports 0.33668 – 0.30545 – 0.28164
Resistances 0.36600 – 0.39406 – 0.42456
LEGAL NOTICE
The investment information, comments and recommendations contained herein do not constitute investment advice. Investment advisory services are provided individually by authorized institutions taking into account the risk and return preferences of individuals. The comments and recommendations contained herein are of a general nature. These recommendations may not be suitable for your financial situation and risk and return preferences. Therefore, making an investment decision based solely on the information contained herein may not produce results in line with your expectations.

