
MARKET SUMYMARY
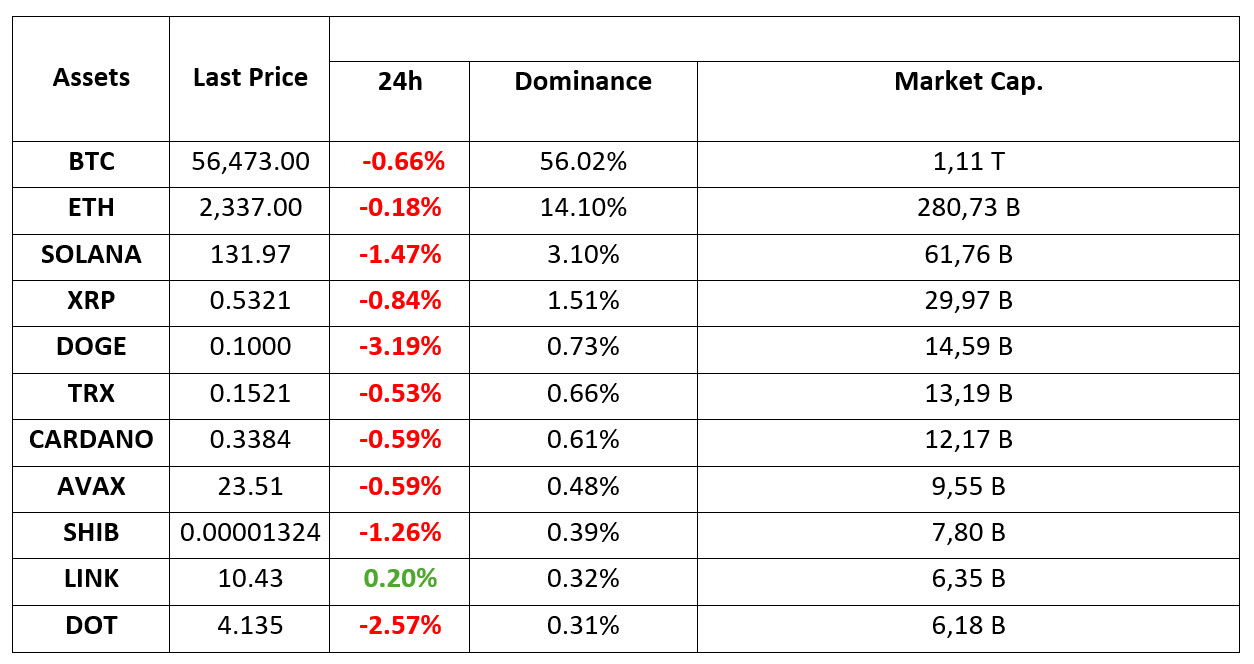
Latest Situation in Crypto Assets
*Prepared on 11.09.2024 at 07:00 (UTC)
WHAT’S LEFT BEHIND
Trump-Harris debate ends in a draw
The highly anticipated debate between US presidential candidates Kamala Harris and Donald Trump turned into a high-tension showdown. Polymarket data shows that the debate ended in a draw, with US Presidential candidate Harris gaining 3% in the polls at the end of the debate and crypto not being mentioned at all.
US Bitcoin ETFs hit $117 million in daily inflows; Ether ETFs turn green
About $117 million flowed into U.S. spot Bitcoin exchange-traded funds (ETFs) in Tuesday trading, while the group of nine spot Ethereum ETFs returned to the green after a period of losses, according to data from Farside Investors.
China’s Real Estate Crisis Sparks Fears
According to Wise Advice, China’s real estate stocks have fallen to their lowest levels since 2008. This comes on the heels of Evergrande’s bankruptcy in August 2023, which caused Bitcoin to plunge 20%. Now, with China’s real estate sector representing more than 18% of global GDP (up from just 4% in 2008), the stakes are higher. The fact that many US companies and banks have significant exposure to this market raises fears that a collapse in US equities could drag down Bitcoin and with it the broader crypto market.
HIGHLIGHTS OF THE DAY
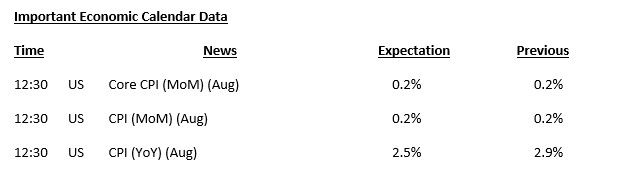
INFORMATION:
*The calendar is based on UTC (Coordinated Universal Time) time zone. The economic calendar content on the relevant page is obtained from reliable news and data providers. The news in the economic calendar content, the date and time of the announcement of the news, possible changes in the previous, expectations and announced figures are made by the data provider institutions. Darkex cannot be held responsible for possible changes that may arise from similar situations.
MARKET COMPASS
Global markets have turned their attention to the US inflation data to be released today. Investors are cautiously waiting ahead of these critical figures.
Before;
- We watched the first and only live television debate between Trump and Harris before the elections in November. Americans seem to agree that Harris was the winner of the debate. Although it is difficult to say that there was a clear impact, the dollar index was negatively affected by the situation.
- Asian markets are generally negative and European stock markets are expected to start the day calm (slightly positive). Bank of Japan (BoJ) official Nakagawa stated that interest rates could be raised further if necessary and the Yen appreciated on the back of the weak dollar. In addition, Waller from the FED stated that he was open to a significant rate cut if necessary and the USD/JPY parity fell with these headlines.
- As we mentioned in our analysis yesterday evening, we saw a pullback in digital assets led by BTC. Bitcoin retested the peak it tested on September 4 and we saw a decline from these price levels. Today’s inflation data may be the decisive dynamic after this market behavior, which can be seen before the release of important data and the fragility in risk appetite.
Important Bend for Markets: US Inflation Data
Although the focus has shifted from inflation to employment after FED Chair Powell’s speech at Jackson Hole, the dose of the rise in prices is still of great importance. From this point of view, US inflation data will be one of the most critical data in recent days. In July, the core CPI (core CPI) in the US pointed to an increase of 0.2%. The increase in prices is expected to be of this magnitude in August as well. Considering that the pricing behavior in the market is shifting towards the FED’s interest rate decisions (from recession concerns), we can say that a lower-than-expected inflation data set may have a positive impact on digital currencies by strengthening the expectation that the FED will increase the possibility of interest rate cuts with larger steps. Conversely, higher-than-expected inflation data is more likely to have a negative impact.
TECHNICAL ANALYSIS
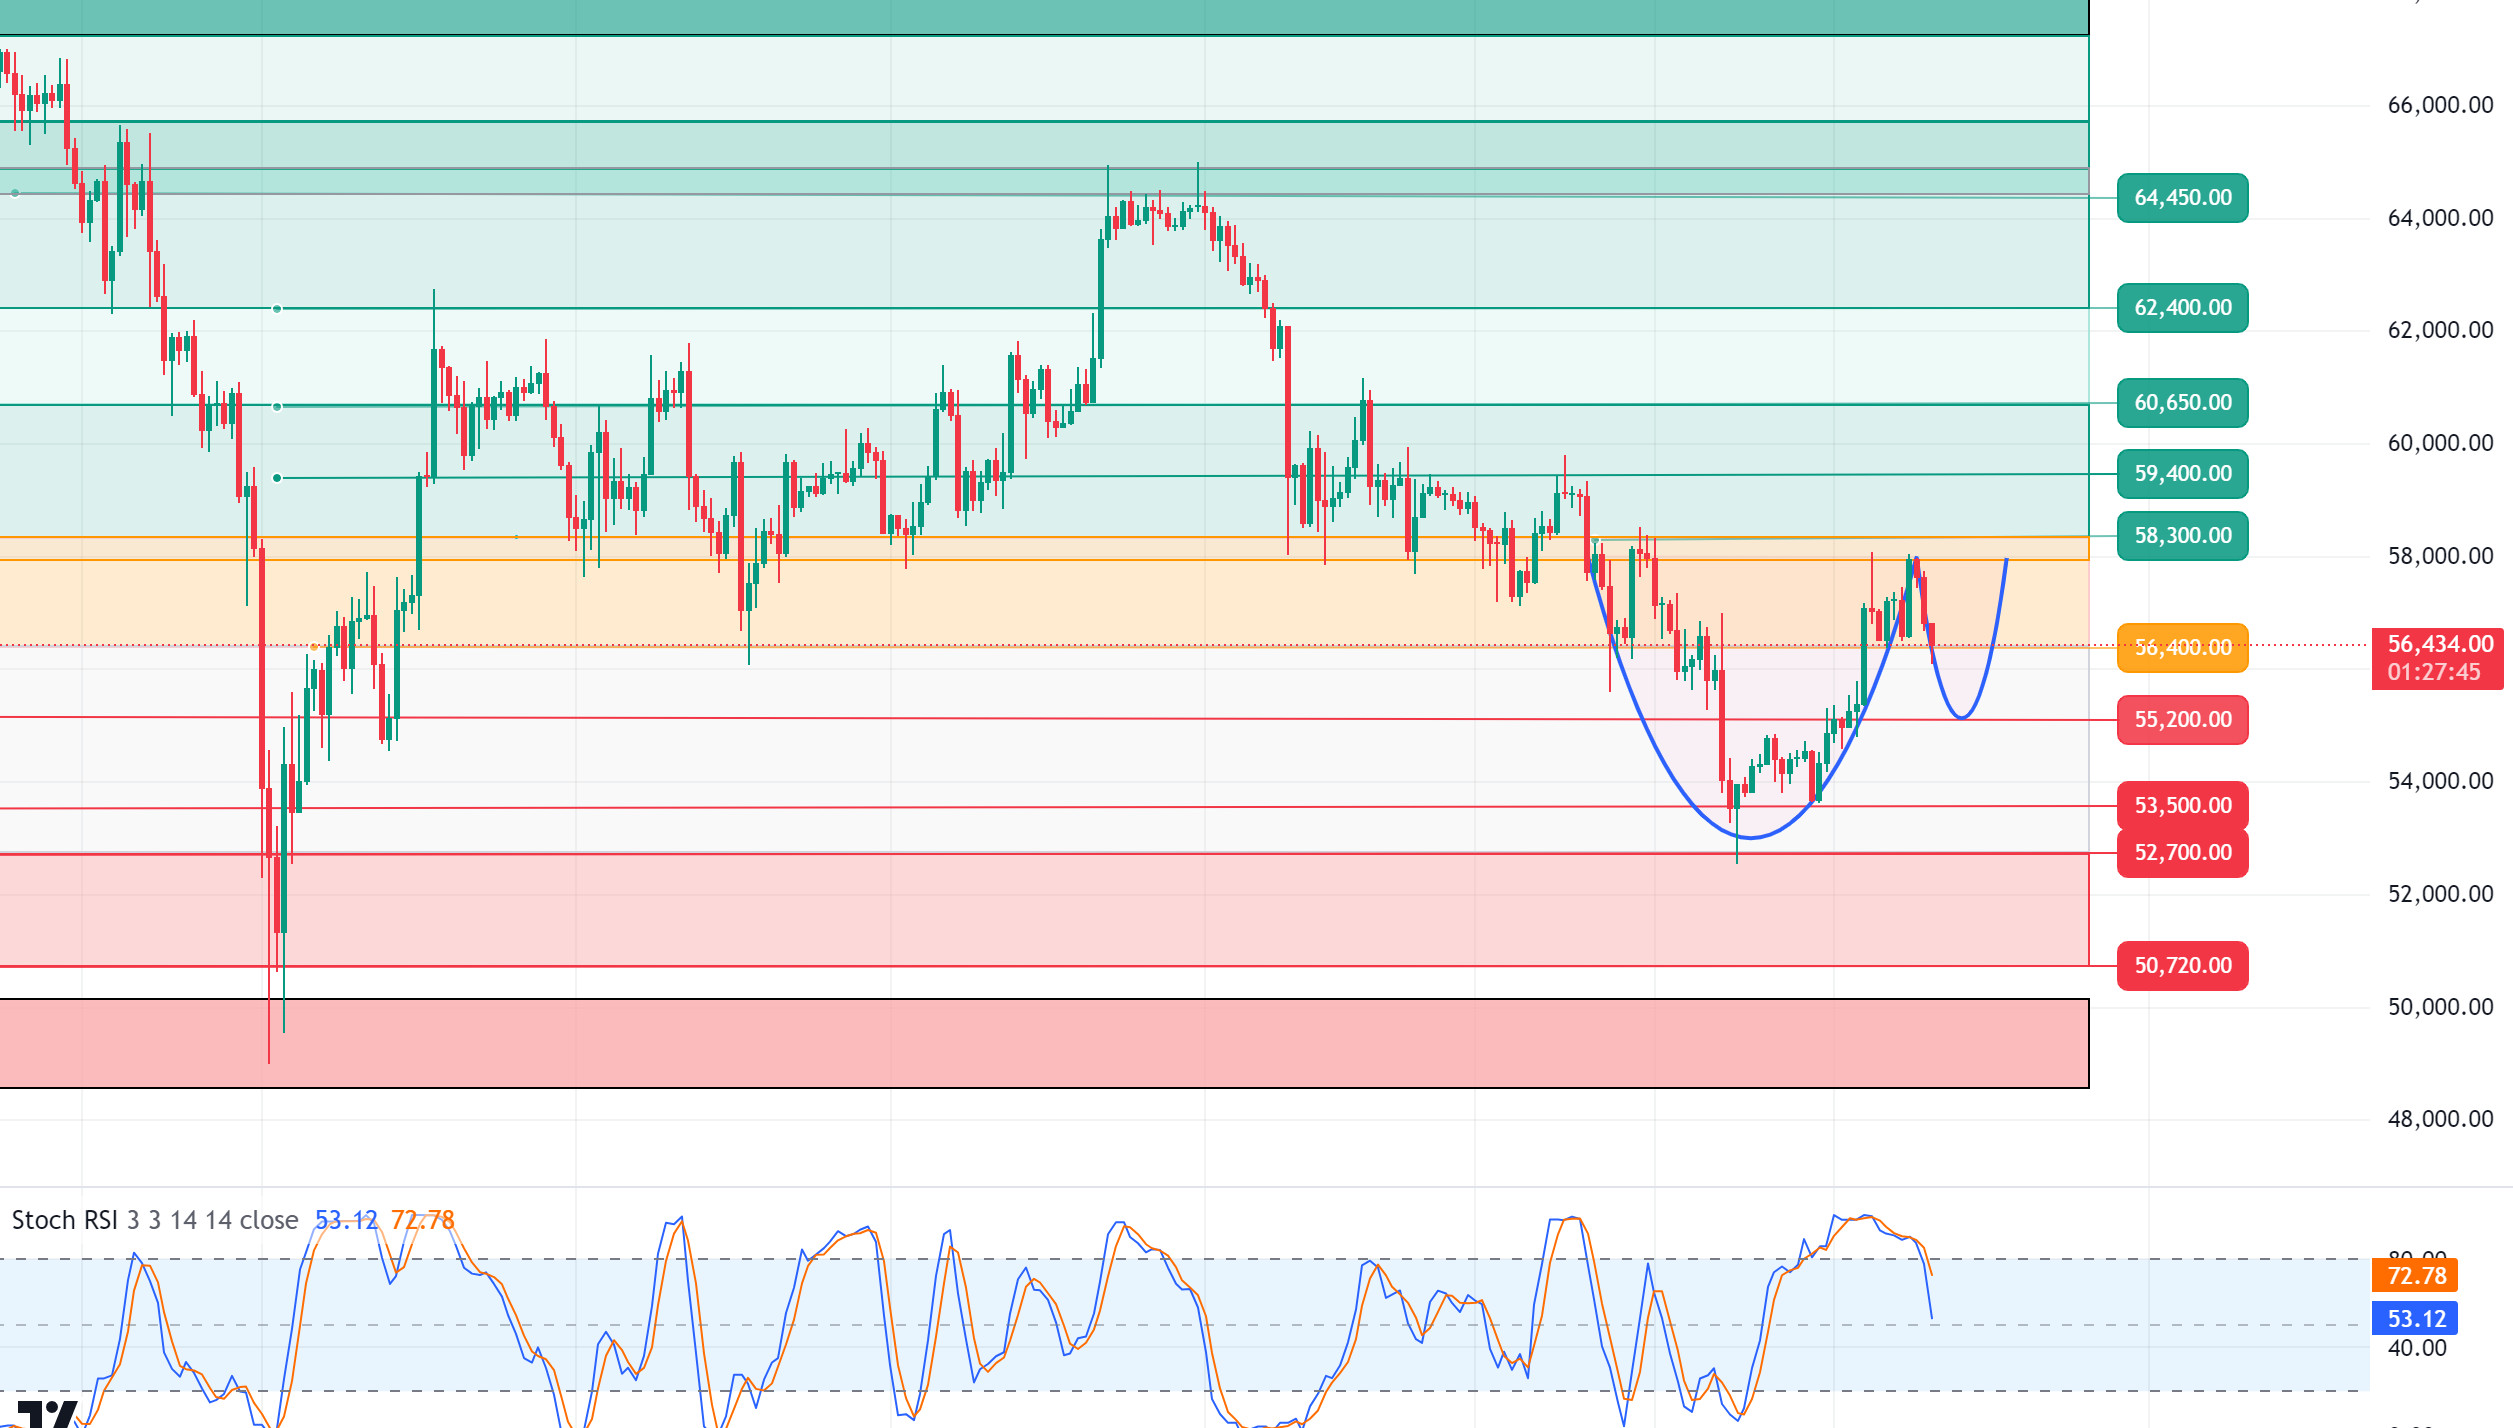
BTC/USDT
Bitcoin after the US Presidential Debate! Before the US presidential elections, the eyes were on the debate where presidential candidates D.Trump and Kamala Harris came together for the first time. The fact that the surveys opened to mention the crypto market in the debate remained at the level of 13% shows that the crypto issue was not expected in the debate. As a matter of fact, the fact that Bitcoin and cryptocurrencies were not mentioned in the debate reflected the expectations. Today, we can say that it is a critical day with inflation data from the US and volatility may increase. In the BTC 4-hour technical analysis, we saw that the price, which tested 58,000 levels, has not gained momentum to cross here for the moment. We can say that BTC, which retreated to the support level of 56,400, may point to a bowl handle pattern from trend continuation patterns. If the handle part is completed, the pattern may remain valid and 60,650 levels can be targeted again in the long term. However, 4-hour closures below the support level may move the price back to 55,200 and the RSI, which has been showing a negative mismatch for a while, may support this expectation by correlating with the price again and turning its direction down.
Supports 55,200 – 56,400 – 53,500
Resistances 57,200 – 58,300 – 59,400
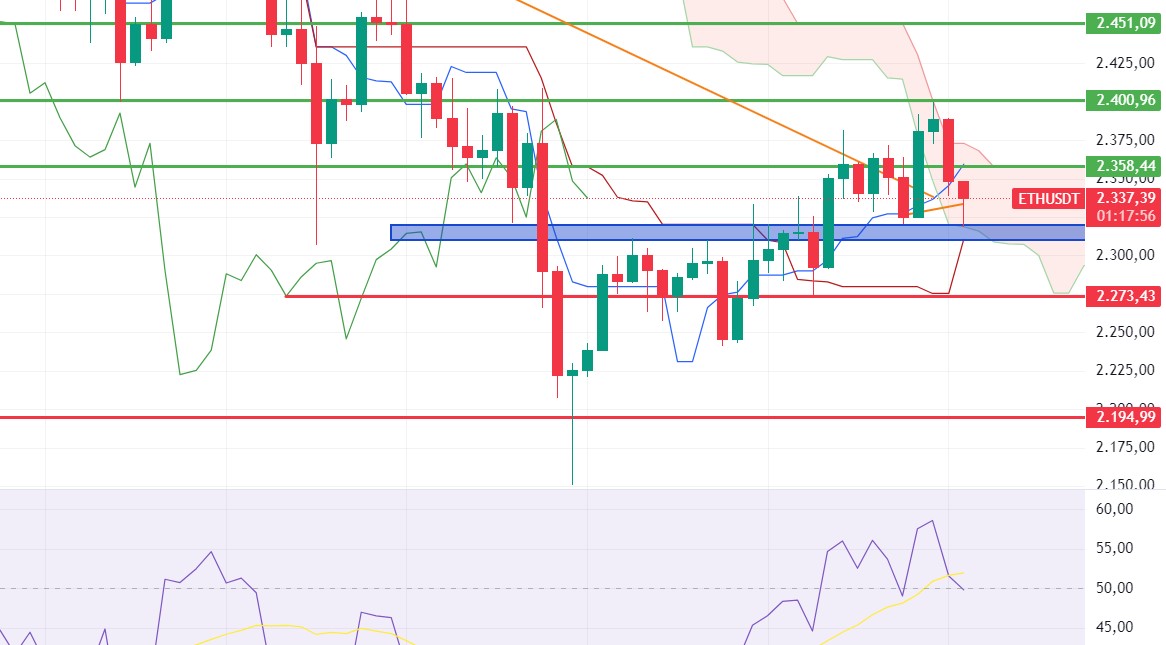
ETH/USDT
Ethereum, which rose to 2,400 resistance in the night hours, declined as a result of the positive outcome of the Trump and Kamala debate on the Kamala side. Kumo cloud support received a reaction at 2,320. Due to the positive mismatch in the RSI and the momentum still looking positive, we may see another attack to 2,358 resistance levels during the day. The breakout of this level may bring rises up to 2,400 levels. A downside breaks of the 2,320 kumo cloud support and 2,310 tenkan level may deepen the decline.
Supports 2,320 – 2,310 – 2,273
Resistances 2,358 – 2,400 – 2,451
LINK/USDT
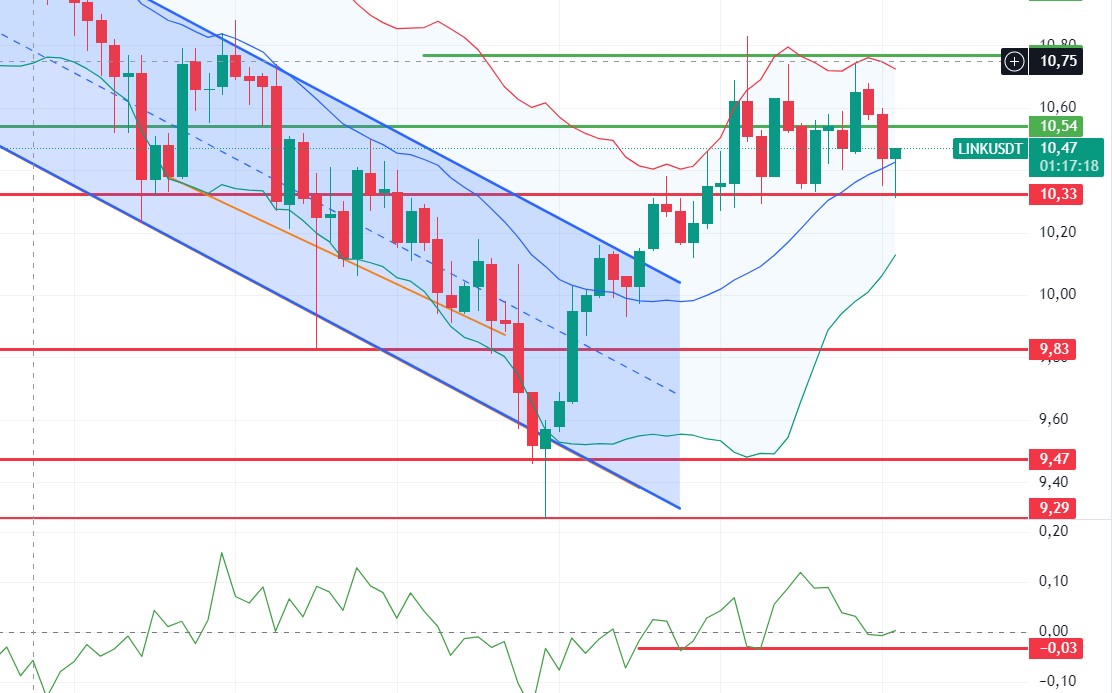
Although LINK fell to 10.33 support after the debate, it seems to have recovered quickly. The regaining of the Bollinger middle band seems positive. There are also positive structures in CMF and OBV. The regain of 10.54 may provide an increase to the Bollinger upper band 10.77. The loss of 10.33 looks quite negative and may bring a decline to 9.83.
Supports 10.33 – 9.82 – 9.47
Resistances 10.54 – 10.98 – 11.45
SOL/USDT
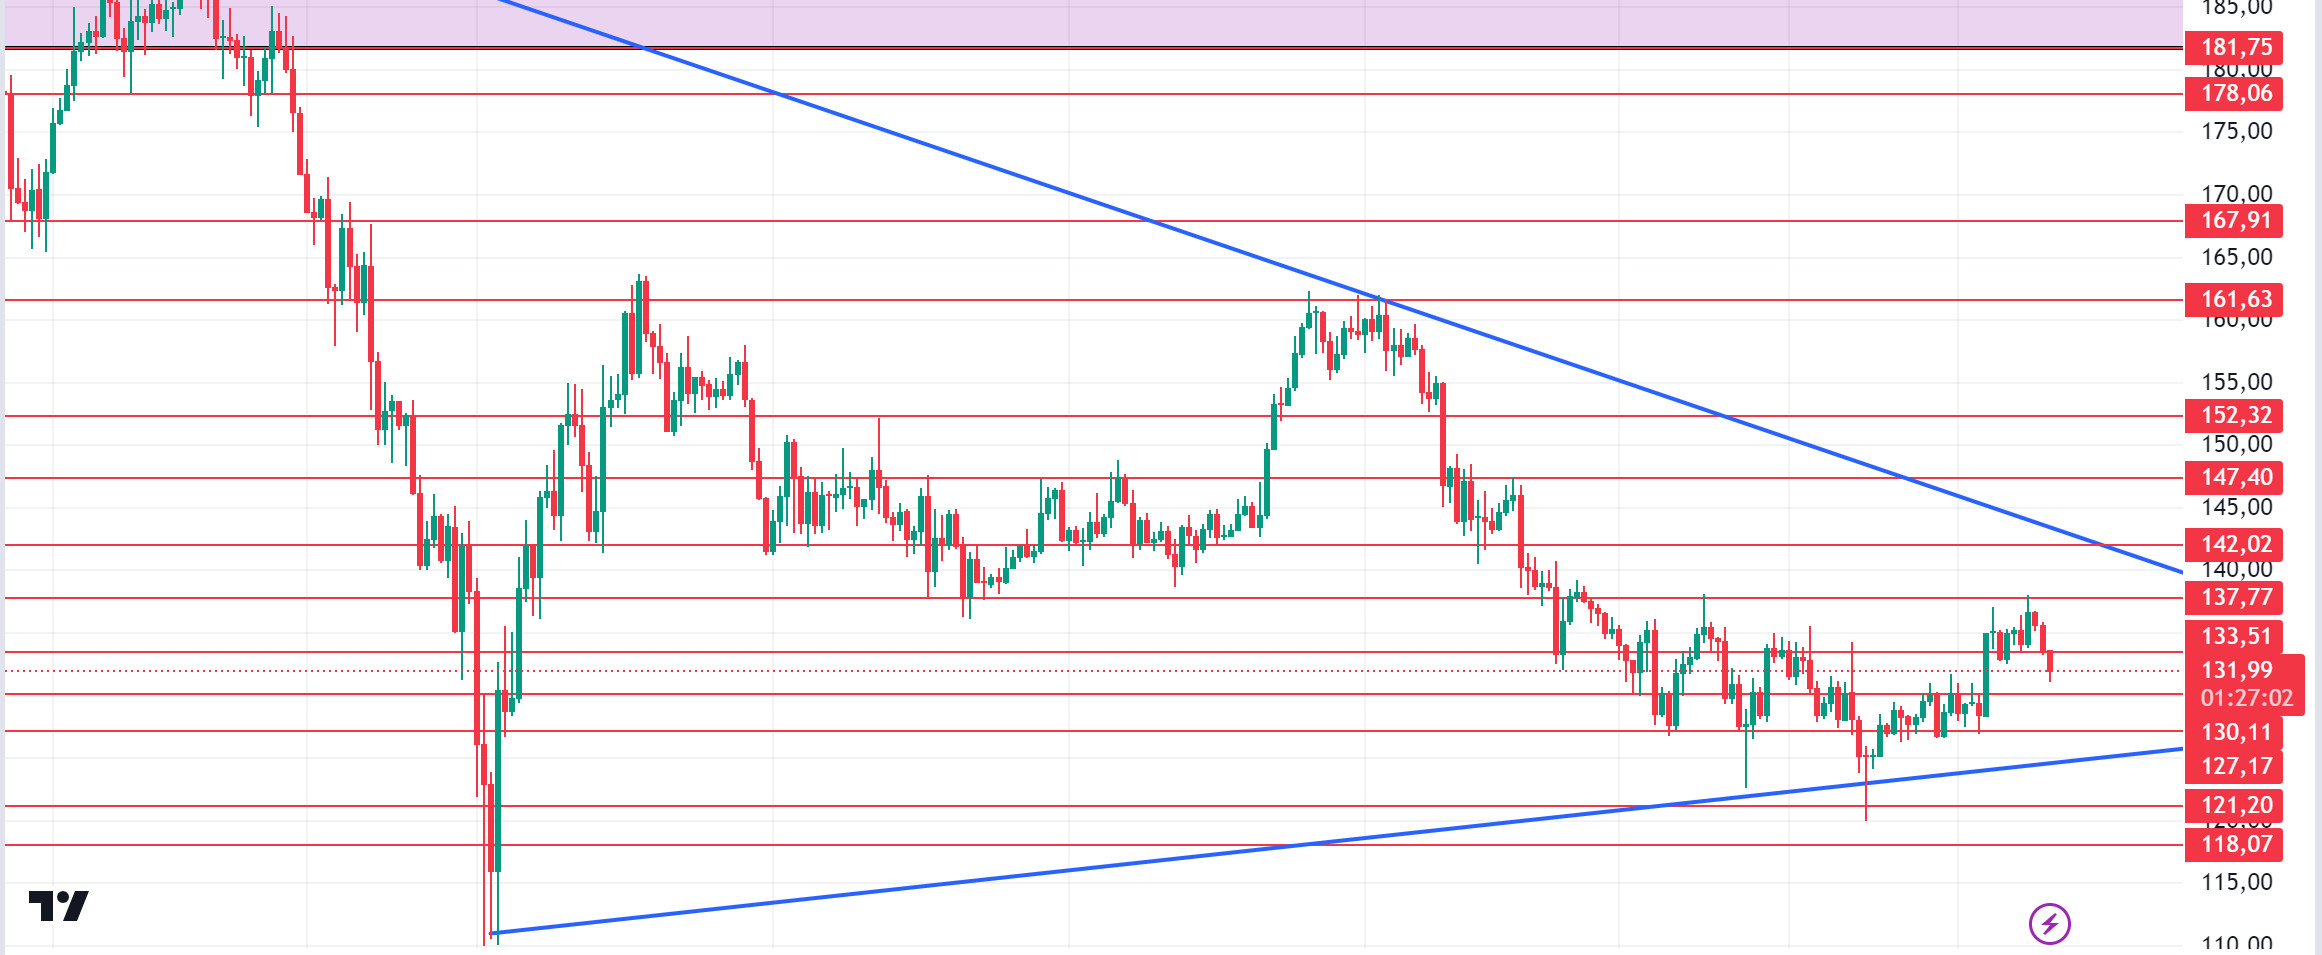
Consumer price index inflation data coming from the US today is among the important data. In addition, in the Trump – Kamala meeting, Trump’s chances of winning in Polymarket decreased from 52% to 50%, causing selling pressure in the market. In the Solana ecosystem, according to data from Defillama, defi exhibited remarkable TVL statistics. More than 70 million SOLs have been locked and are currently valued at $9.591 billion. This allowed it to maintain its position as the third-largest DeFi hub. The Solana price may rise due to the interest in this DeFi base. Technically, we see a narrowing triangle pattern. SOL, which has been accumulating in a certain band since April, may test the resistance levels of 133.51 – 137.77 if the rises continue due to the increase in volumes. In case of profit sales due to yesterday’s rises, support levels of 130.11 – 127.17 should be followed.
Supports 130.11 – 127.17 – 121.20
Resistances 133.51 – 137.77 – 142.02
ADA/USDT
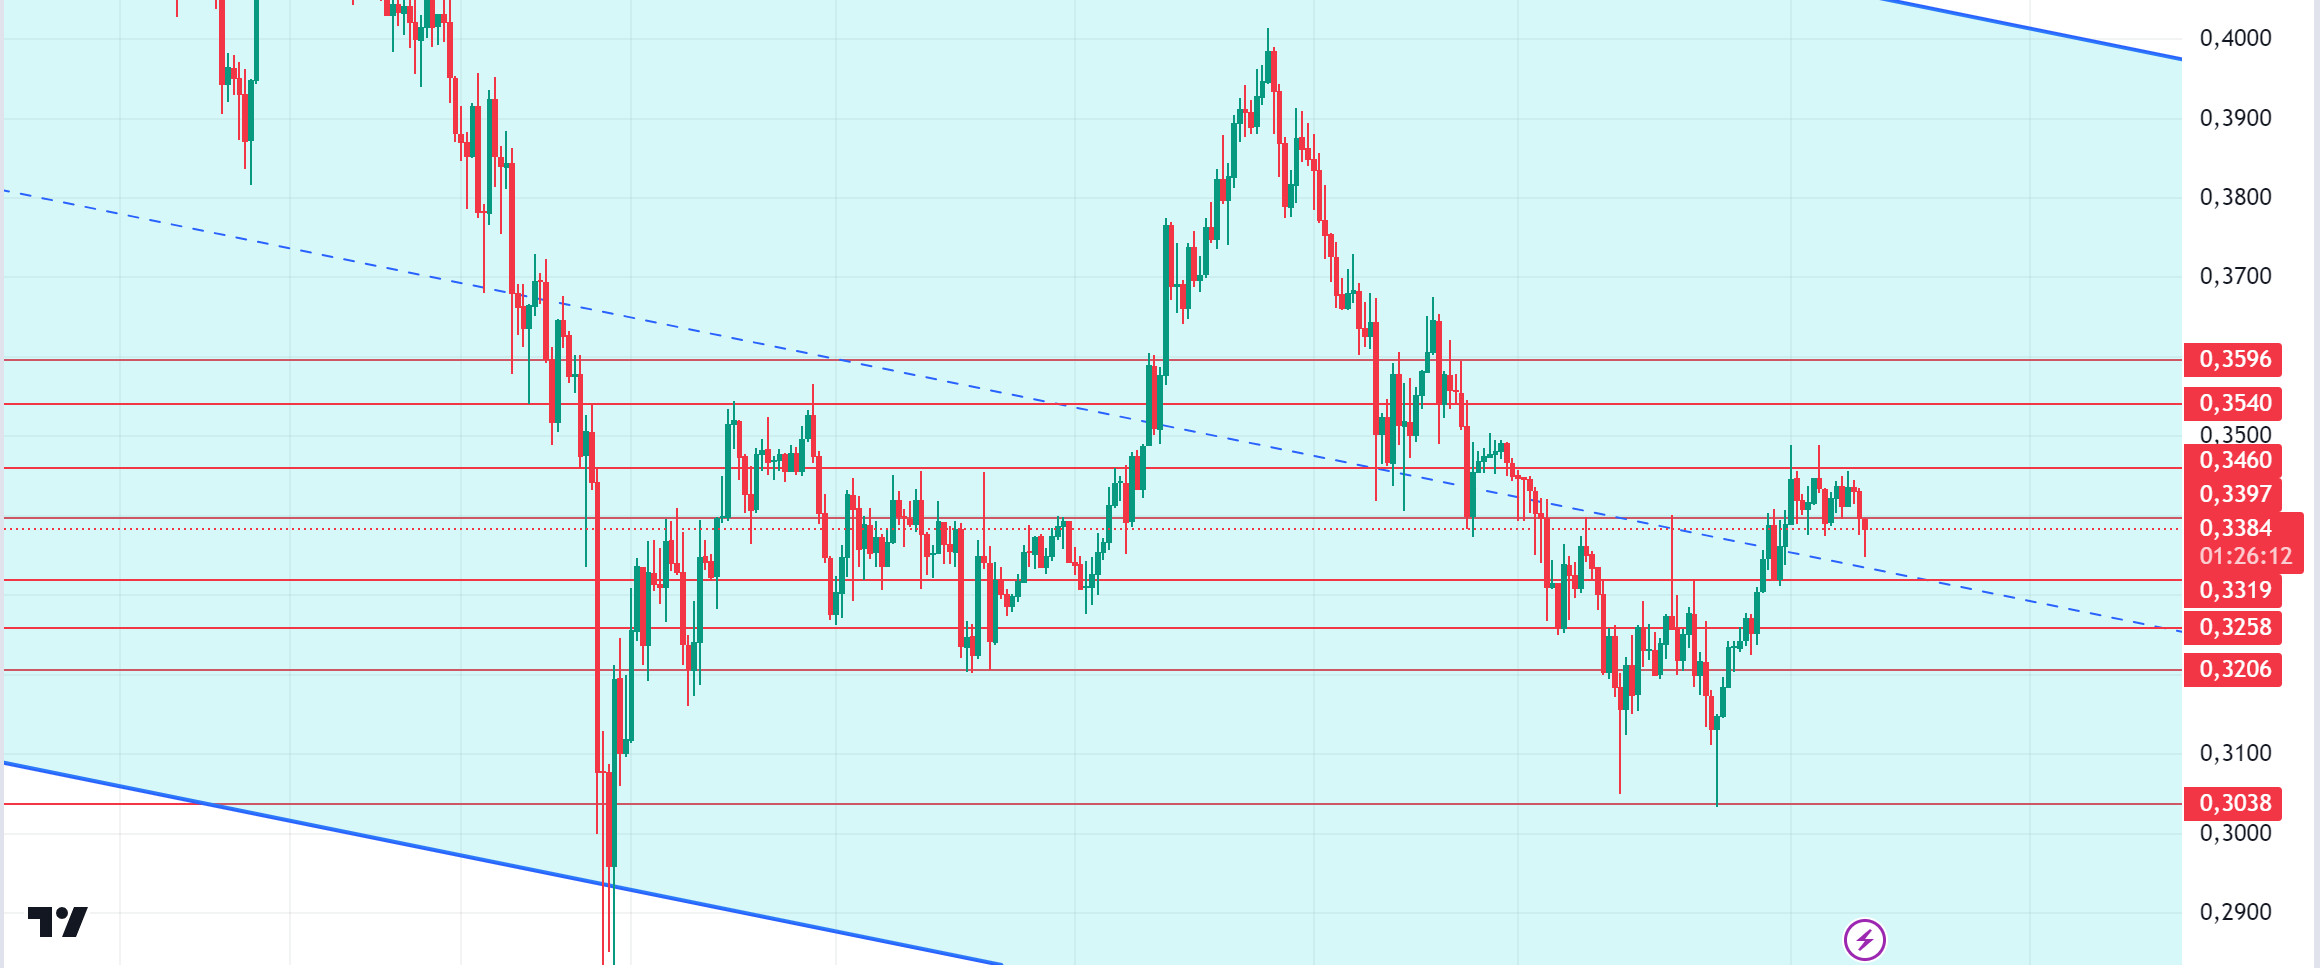
Consumer price index inflation data coming from the US today is among the important data. Also during the Trump – Kamala meeting, Trump’s chances of winning in Polymarket fell from 52% to 50%, causing selling pressure in the market. On-chain activity increased, with trading volume reaching $286.81 million. ADA is consolidating in a narrow range between $0.3020 and $0.3950. When we look at the chart of ADA, it is priced at the middle levels of the falling channel. ADA’s trading volume also fell 3.16% in the last 24 hours, with a total volume of $ 232 million. This drop in volume may prevent ADA from exceeding the 0.3950 resistance. In this scenario, 0.3319 – 0.3258 levels can be followed as support levels. A stronger volume increase will be needed to confirm the bullish breakout. If the volume increases, 0.3397 – 0.3460 levels can be followed.
Supports 0.3319 – 0.3258 – 0.3206
Resistances 0.3397 – 0.3460 – 0.3540
AVAX/USDT
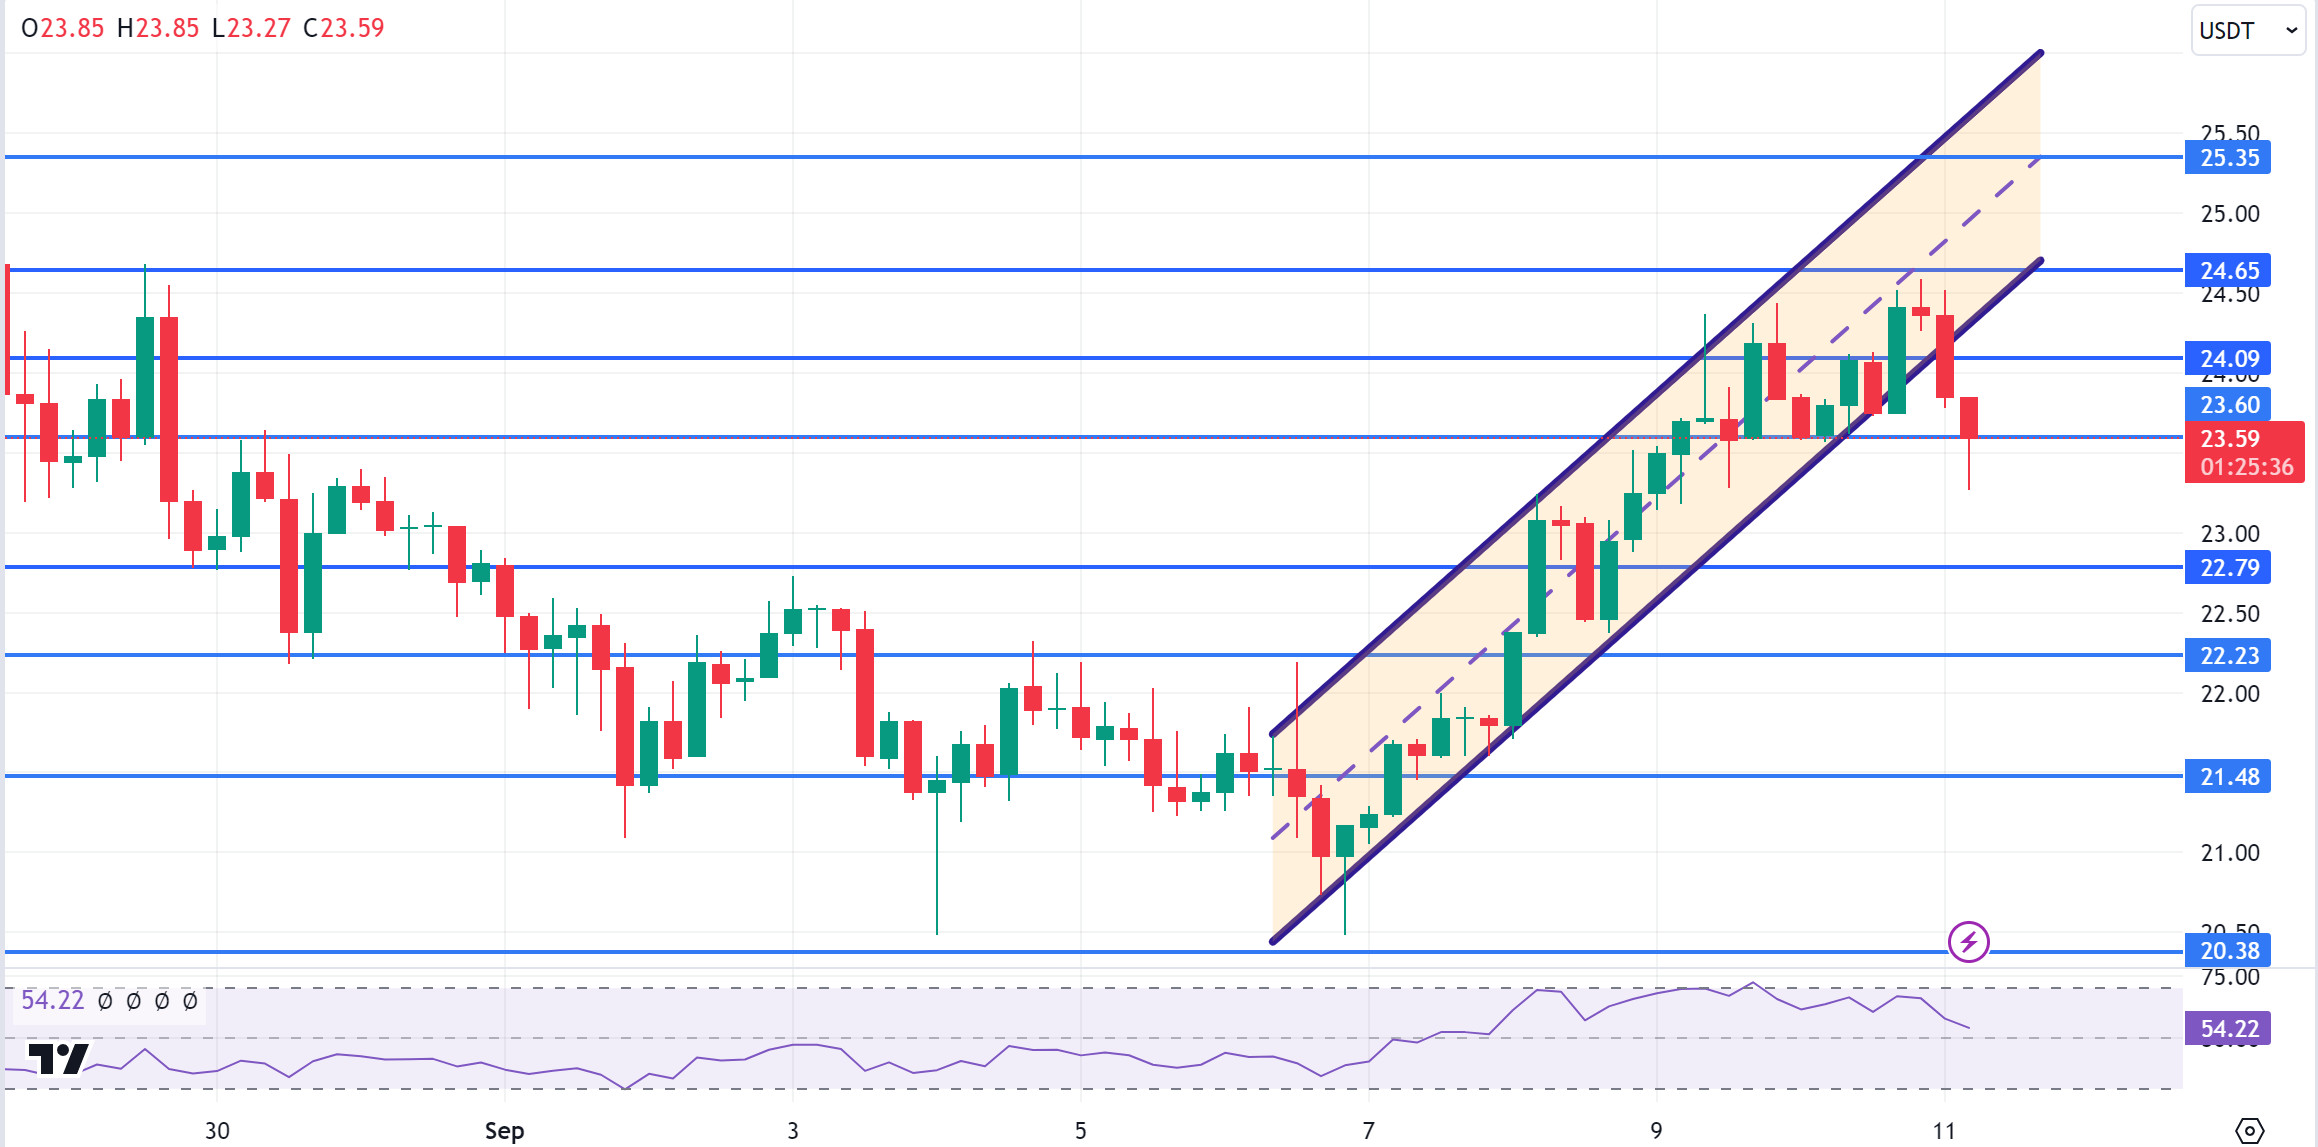
AVAX, which opened yesterday at 23.25, rose 2.5% during the day and closed at 23.84. There is no planned data flow that will affect the markets today. Markets are waiting for the inflation data to be announced tomorrow.
AVAX is currently trading at 23.66 and continues its movement within the rising channel on the 4-hour chart. It is in the lower band of the channel and may want to move towards the middle and upper band with the reaction it will receive from here. In such a case, it may test the 24.09 and 24.65 resistances. If it fails to get a reaction from the lower band of the channel and breaks the 23.60 support downwards, it may test the 22.79 and 22.23 supports. As long as it stays above 20.38 support during the day, we can expect it to maintain its upward demand. With the break of 20.38 support, sales may deepen.
Supports 23.60 – 22.79 – 22.23
Resistances 24.09 – 24.65 – 25.35
TRX/USDT
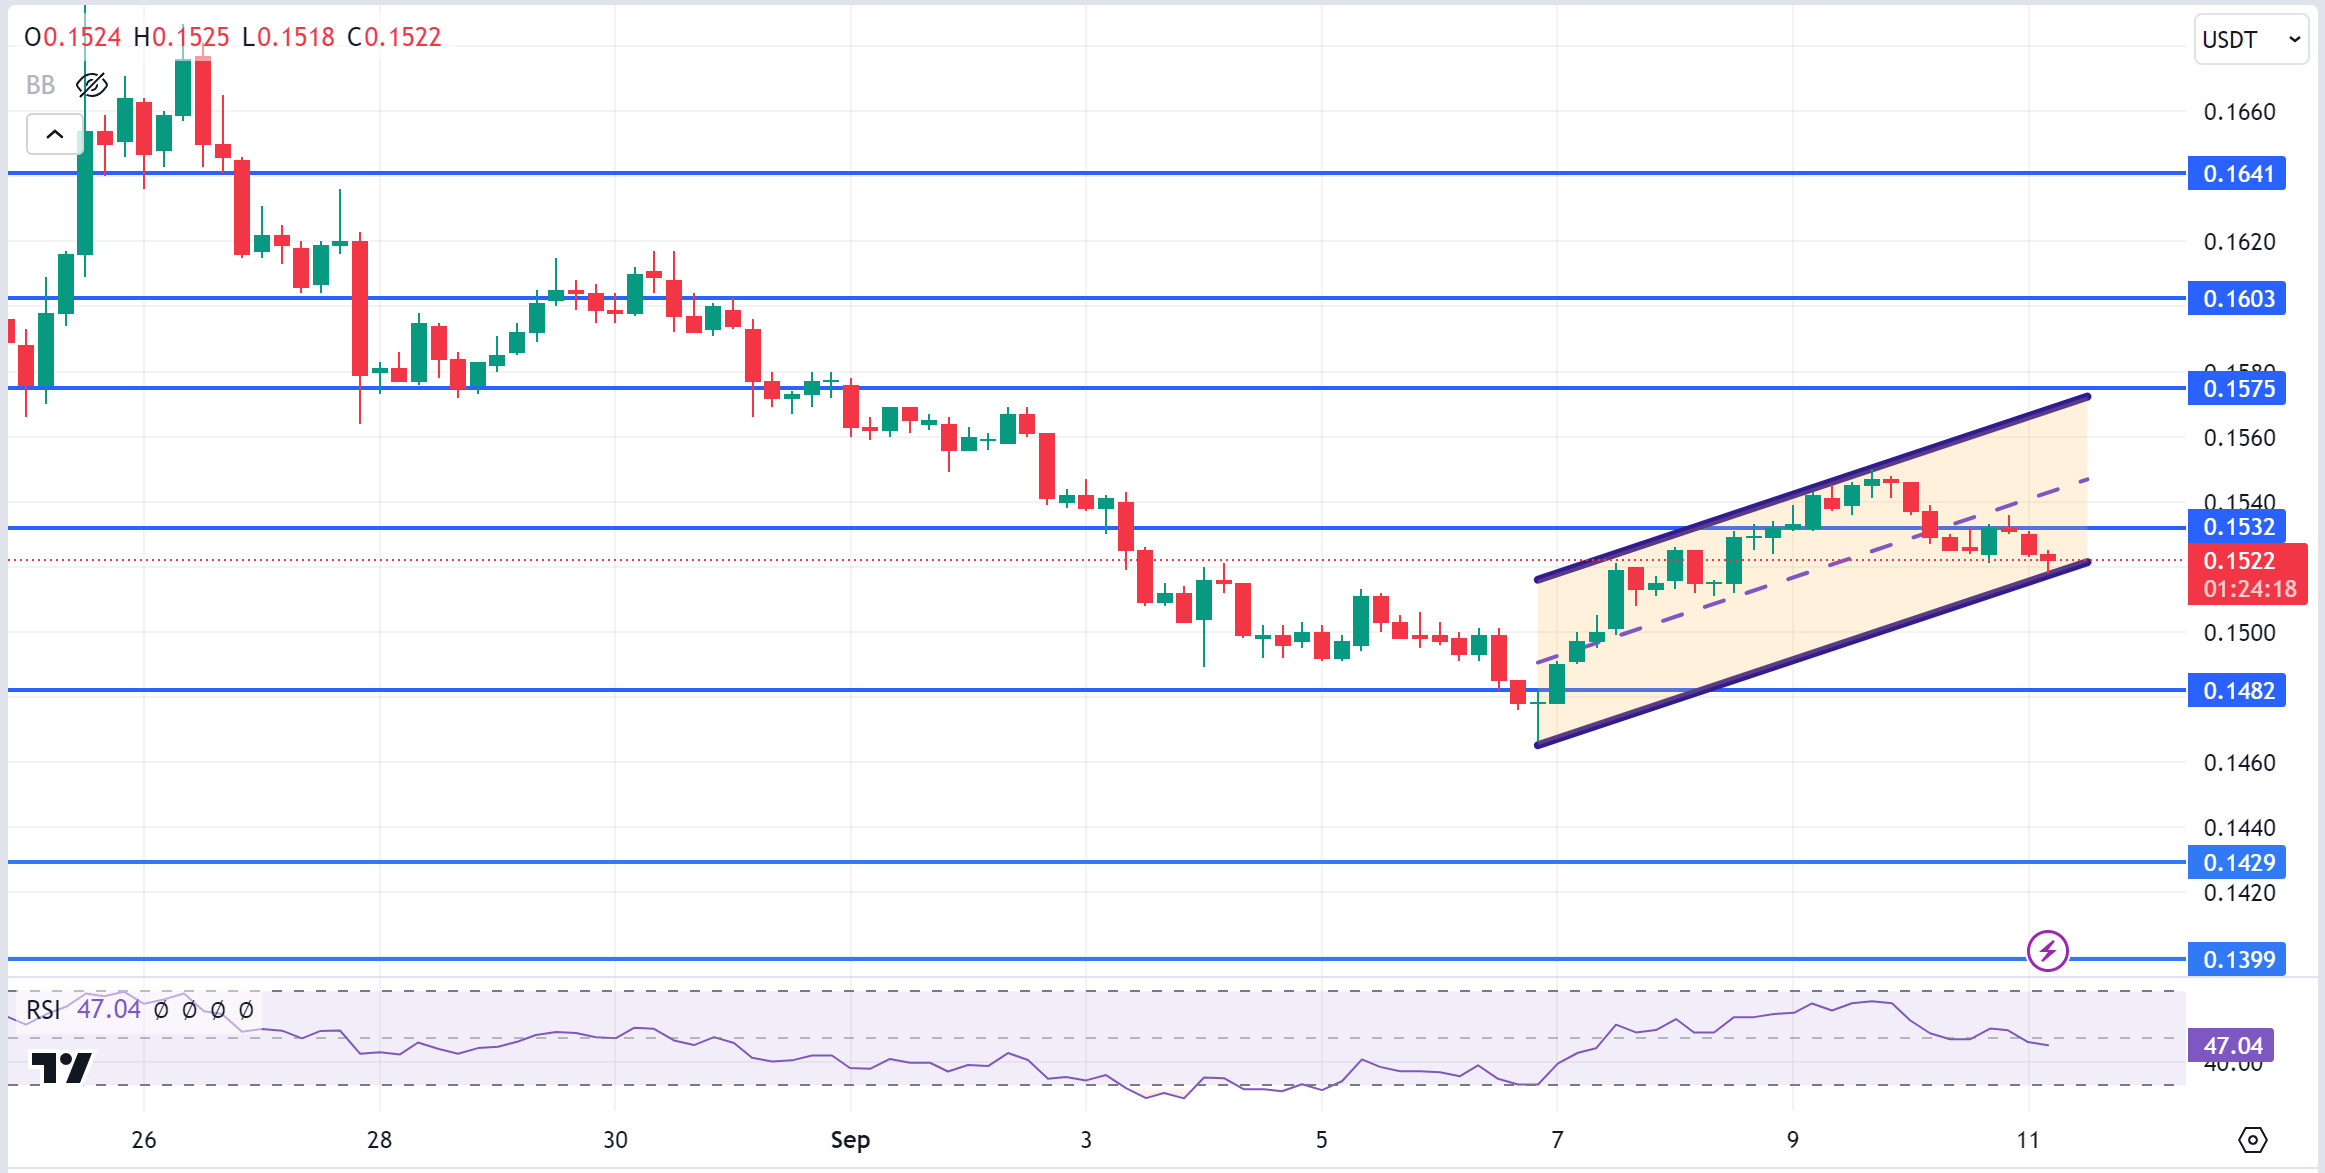
TRX, which started yesterday at 0.1532, rose about 1% during the day and closed at 0.1546. As today is a quiet day in terms of planned data, we can expect volumes to remain low. Markets are waiting for the US CPI data to be released tomorrow.
TRX, which is currently trading at 0.1528, has approached the Bollinger mid-band on the 4-hour chart. If it breaks the 0.1532 support downwards, a buying reaction can be expected from the Bollinger middle band. In such a case, it may move towards the upper band. However, if the sales deepen in the Bollinger middle band, it may move to the lower band and may want to test the 0.1482 support. As long as TRX stays above 0.1482 support, it can be expected to continue its upward trend. If this support breaks down, selling pressure may increase.
Supports 0.1532 – 0.1482 – 0.1429
Resistances 0.1575 – 0.1603 – 0.1641
XRP/USDT
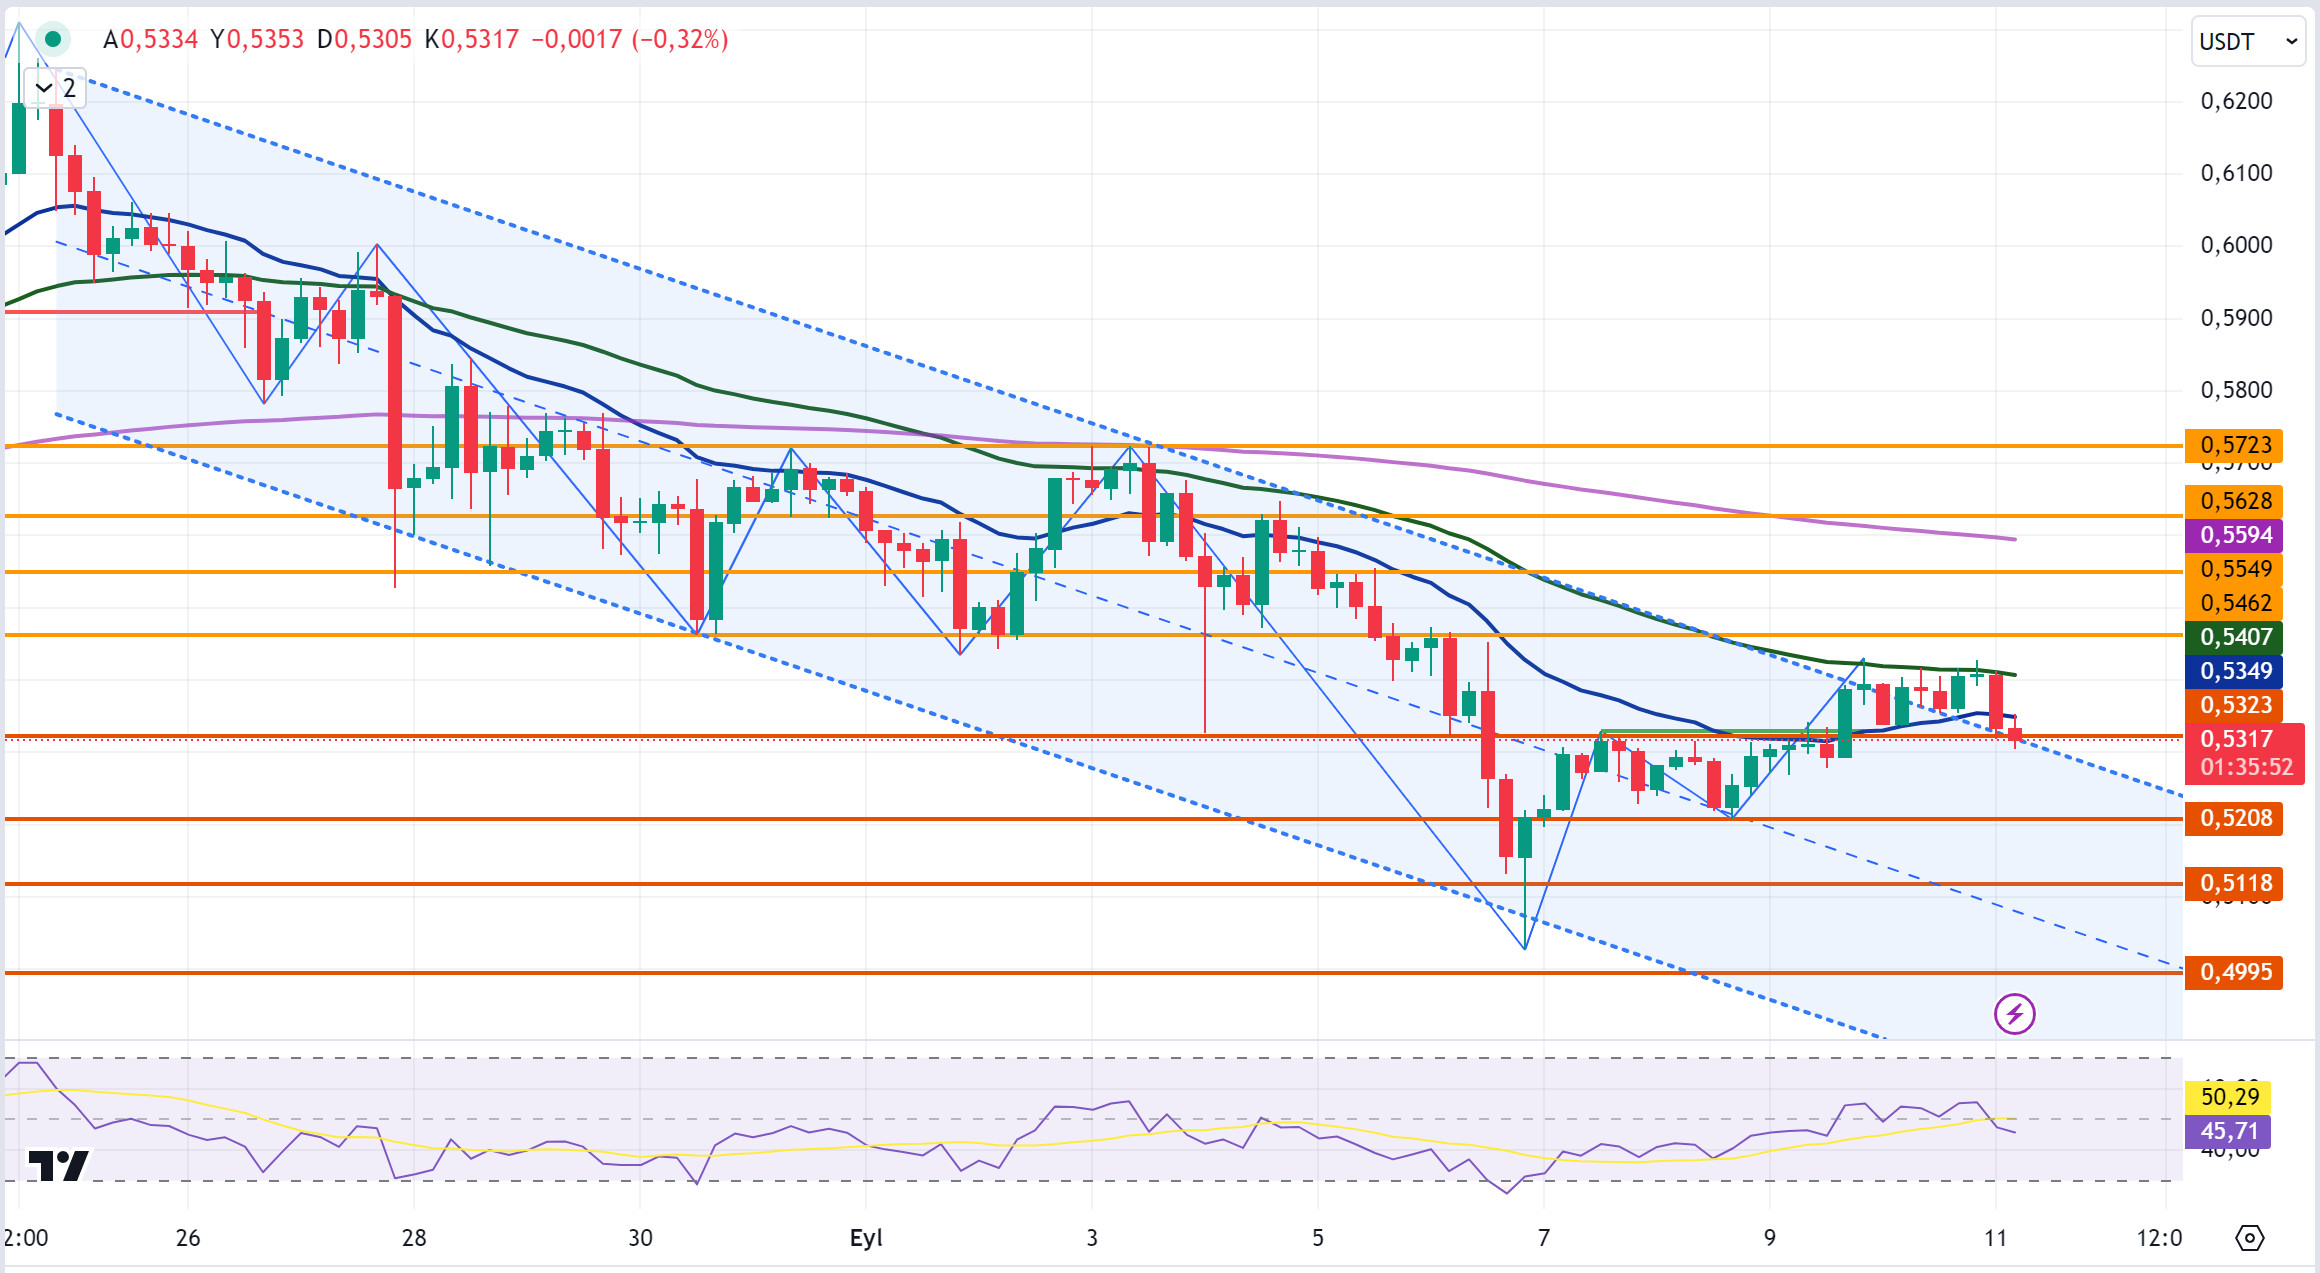
XRP, which started today at 0.5405, continues to trade at 0.5317 with a 1.7% loss in value. In the 4-hour analysis, XRP, which moved in a horizontal band between the EMA20 (Blue Color) and EMA50 (Green Color) levels yesterday, broke the EMA20 level on the first candle today and tested the 0.5323 level with its decline. Currently, XRP is below the 0.5323 support level and has not yet closed the candle according to the 4-hour analysis. If XRP breaks the 0.5323 support level at the close of the candle and continues its decline, it may test the 0.5208-0.5118 support levels. If it fails to break the support level and then turns bullish, it may test the 0.5462-0.5549-0.5628 resistance levels.
Supports 0.5323 – 0.5208 – 0. 5118
Resistances 0.5462 – 0.5549 – 0.5628
DOGE/USDT
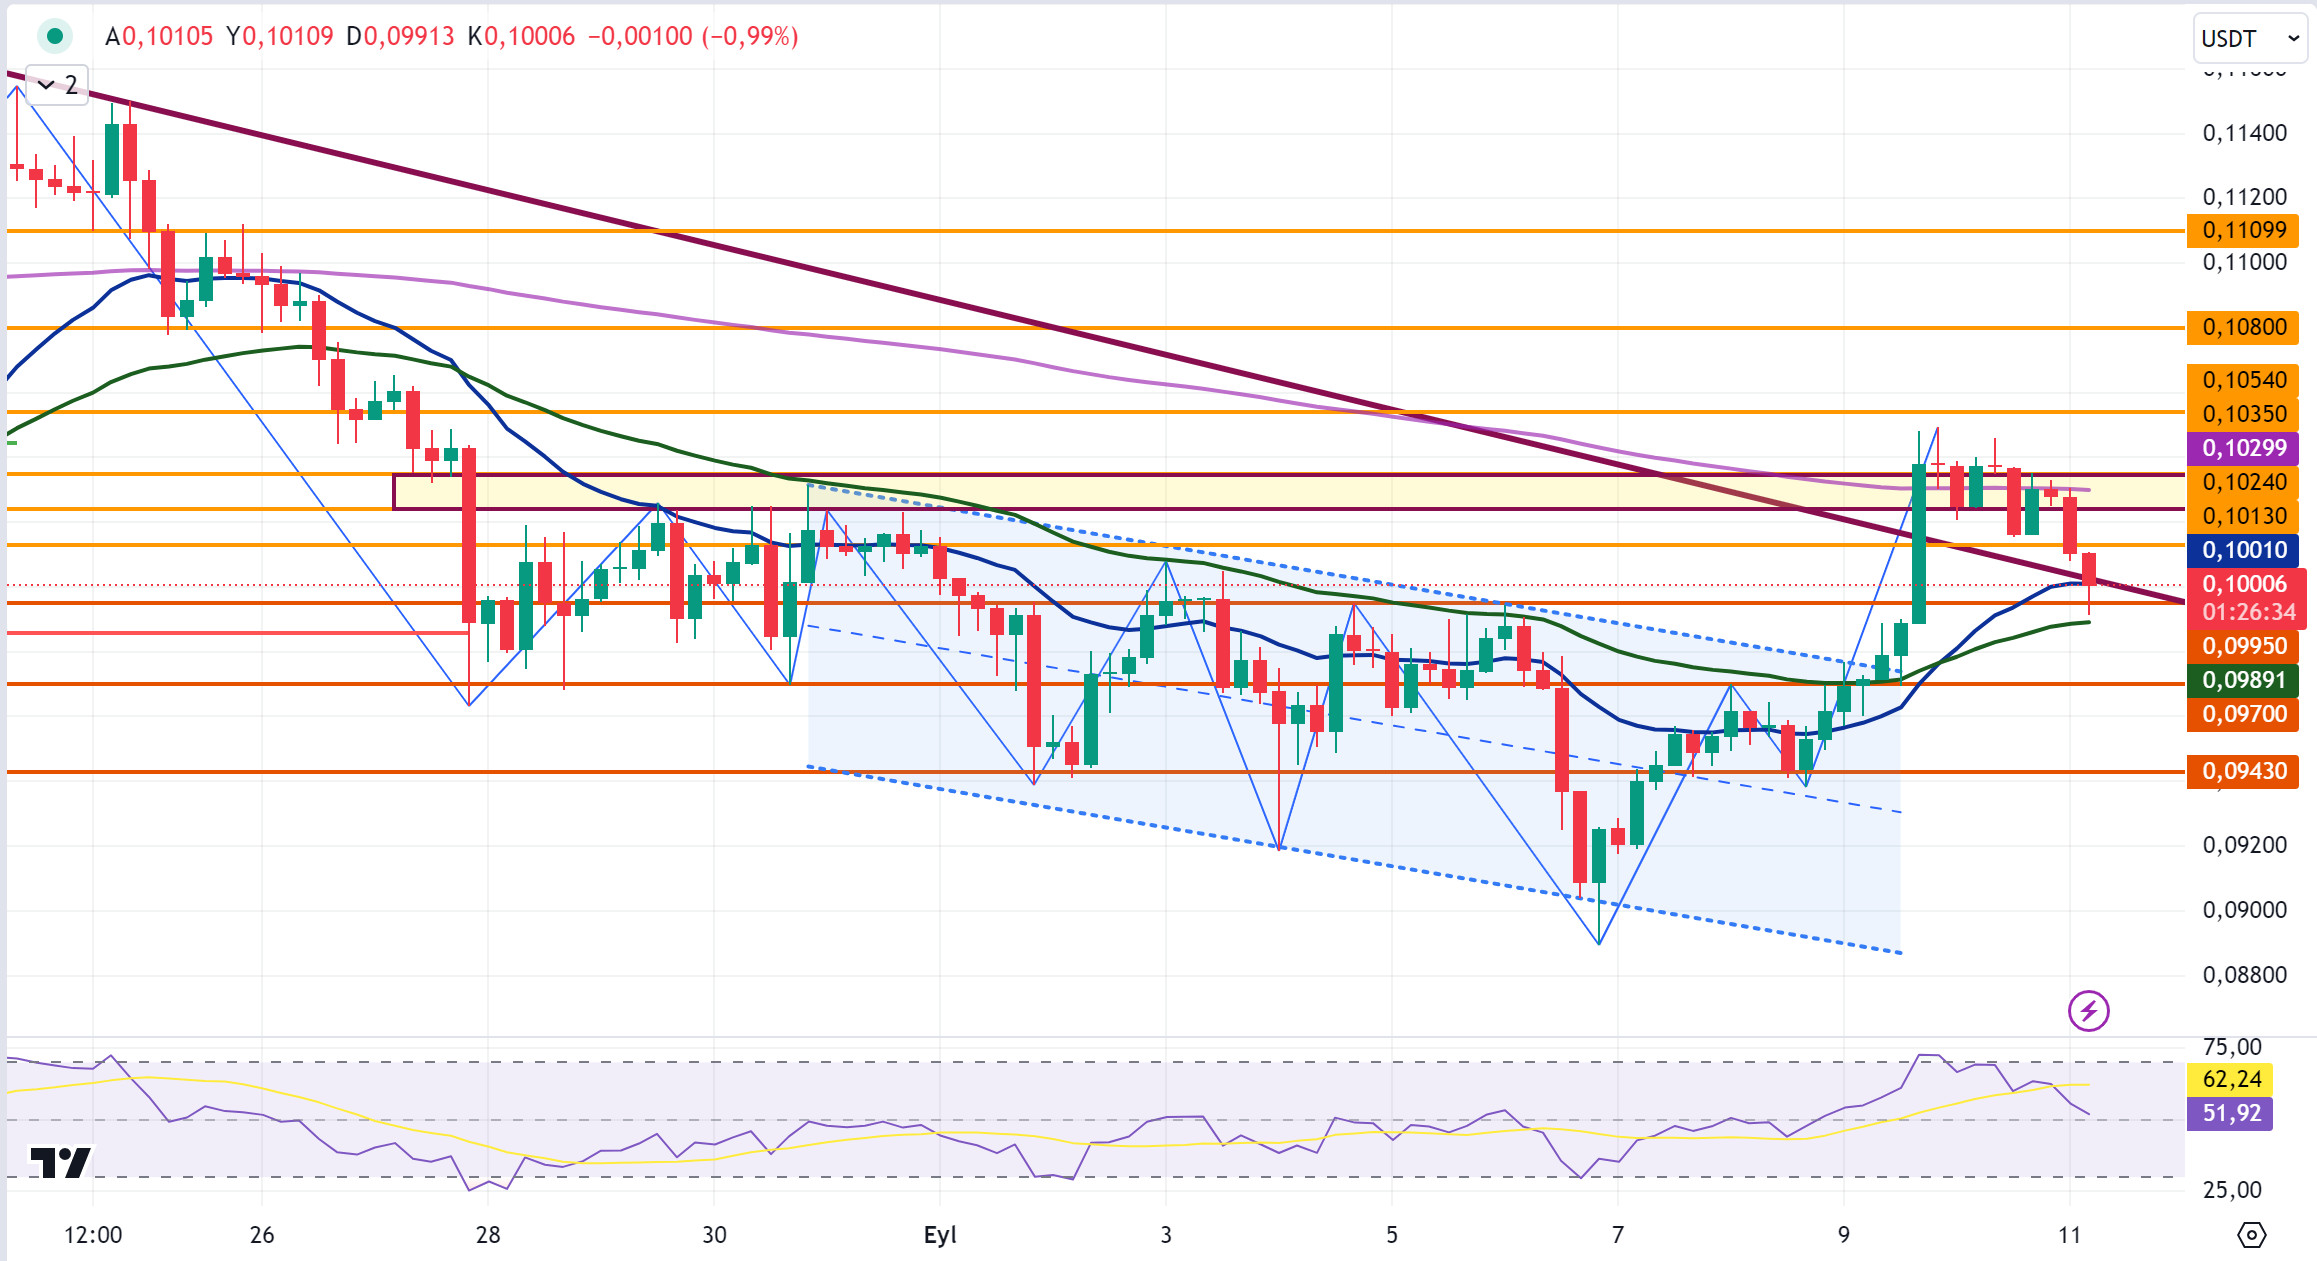
After starting the day at 0.1027, DOGE fell 2.6% to 0.1000. Ahead of the US presidential elections, the crypto market declined during the live debate between the presidential candidates, and DOGE lost 1.7% during this debate, which took place in the first candle in the 4-hour analysis, and continued to decline afterwards.
In the 4-hour analysis, DOGE fell as low as 0.0990 in the last candle today. DOGE, which has recovered a little with the reaction purchases here, continues to trade at the EMA20 (Blue Color) level. In case the decline continues with the downward break of the EMA20 level, DOGE may test the support levels of 0.0995-0.0970-0.0943. If it continues to trade above the EMA20 level and then starts to rise, it may test the resistance levels of 0.1013-0.1035-0.1054.
Supports 0.0995 – 0.0970 – 0.0943
Resistances 0.1013 – 0.1035 – 0.1 054
DOT/USDT
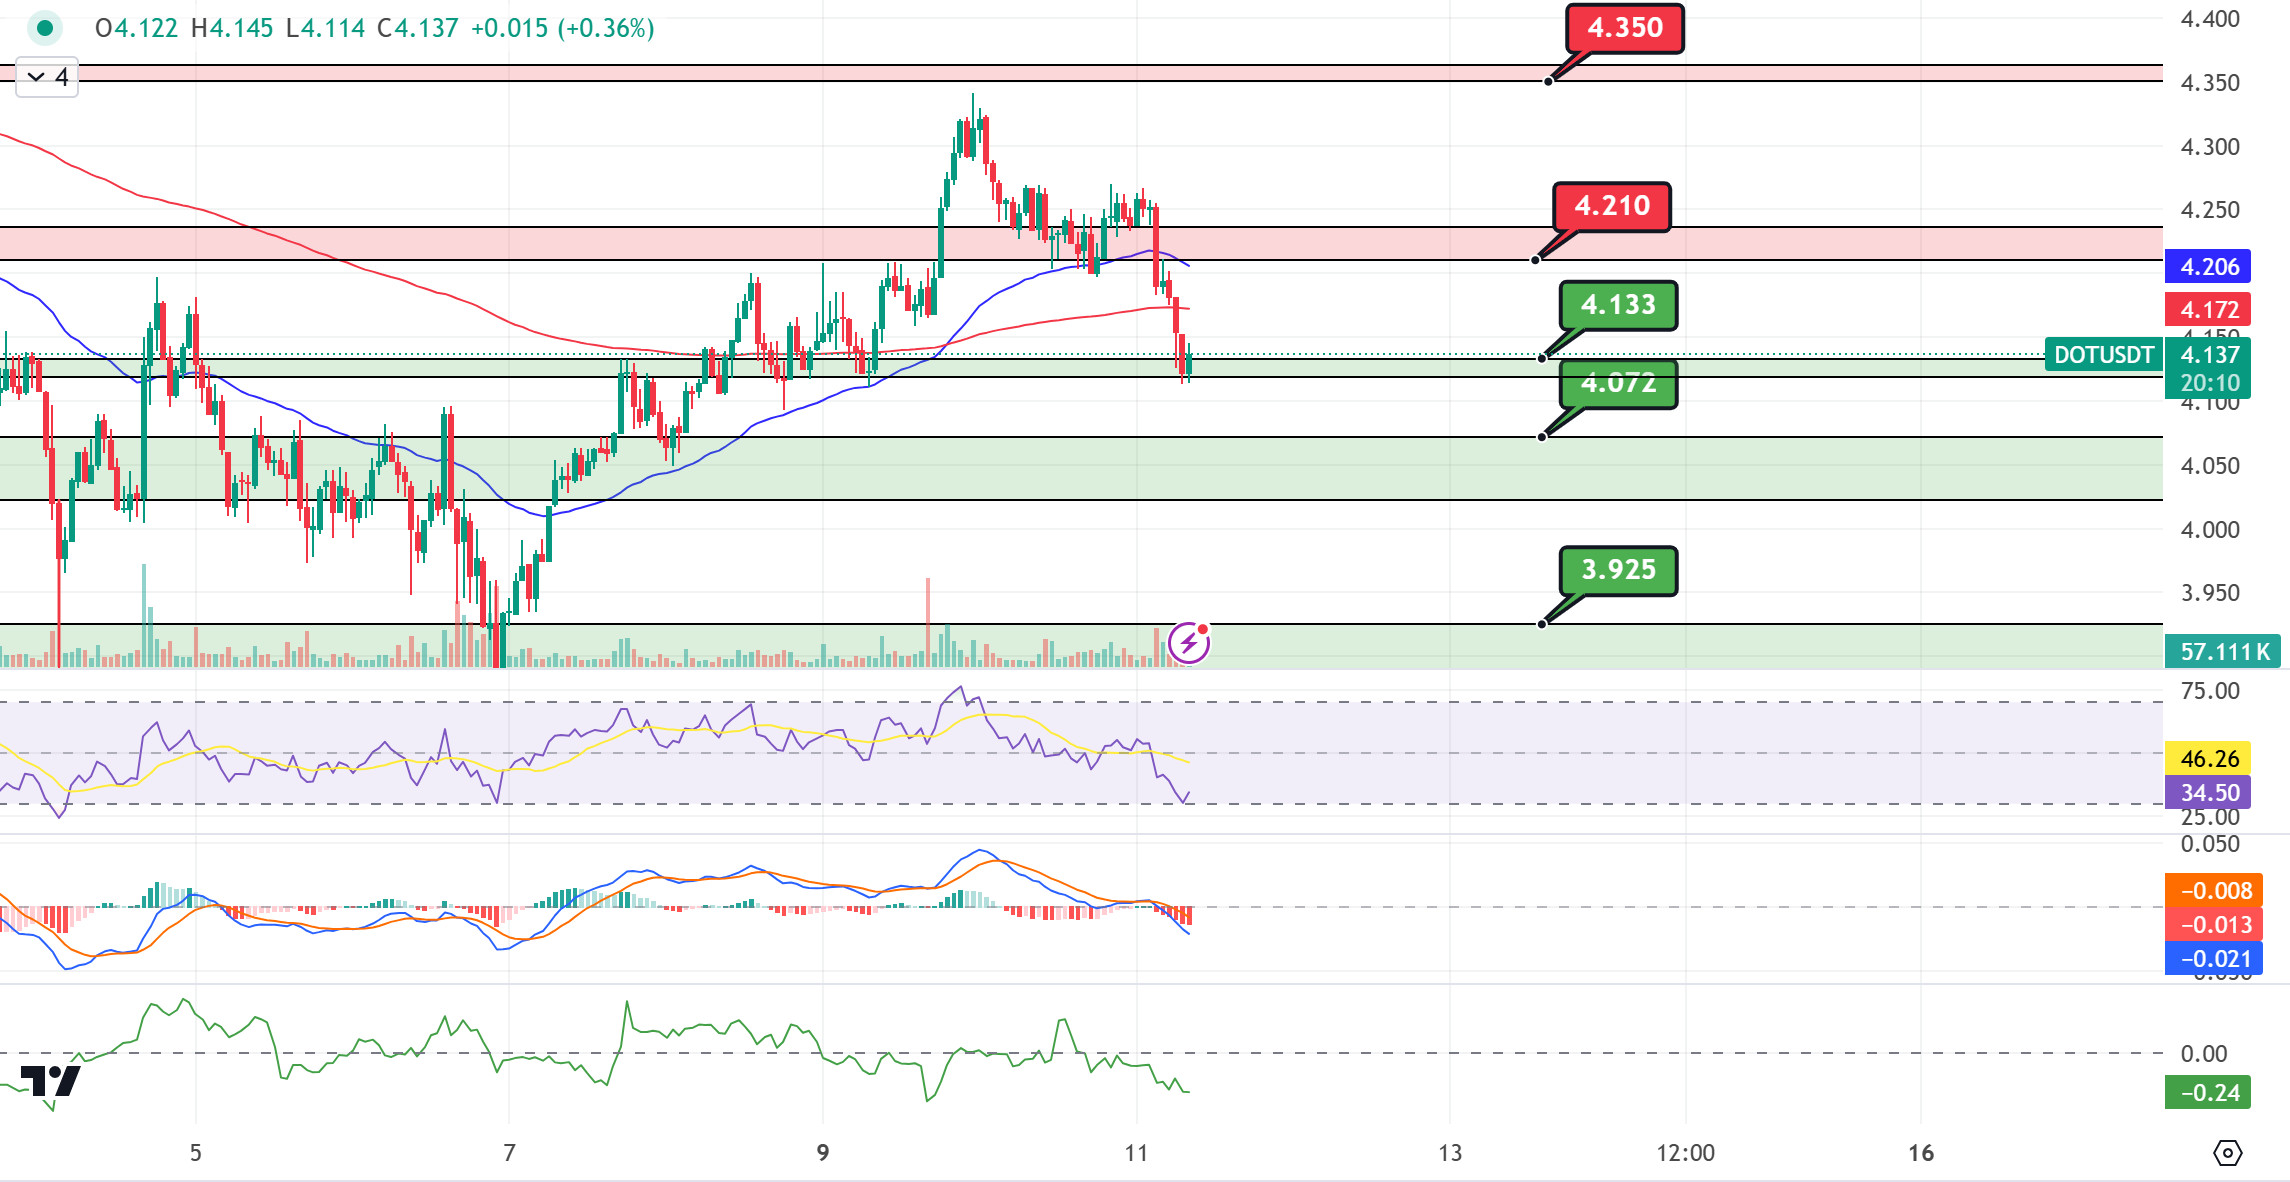
Bitcoin was not mentioned at all in yesterday’s debate between Kamala Harris and Donald Trump. Discussions on the US economic problems caused selling pressure in the cryptocurrency market. When we examine the Polkadot chart, the price broke down the 4,210 support and fell to the 4,133 support level. Polkadot, which received a reaction from the support level of 4.133, may move back towards 4.210 levels if it can hold above the 4.133 level. On the other hand, when we examine the MACD and CMF oscillators, we can say that the selling pressure continues. If the price closes candles below the 4.133 support band, it may retreat to the next support level of 4.072.
(Blue line: EMA50, Red line: EMA200)
Supports 4,133 – 4,072 – 3,925
Resistances 4.210 – 4.350 – 4.454
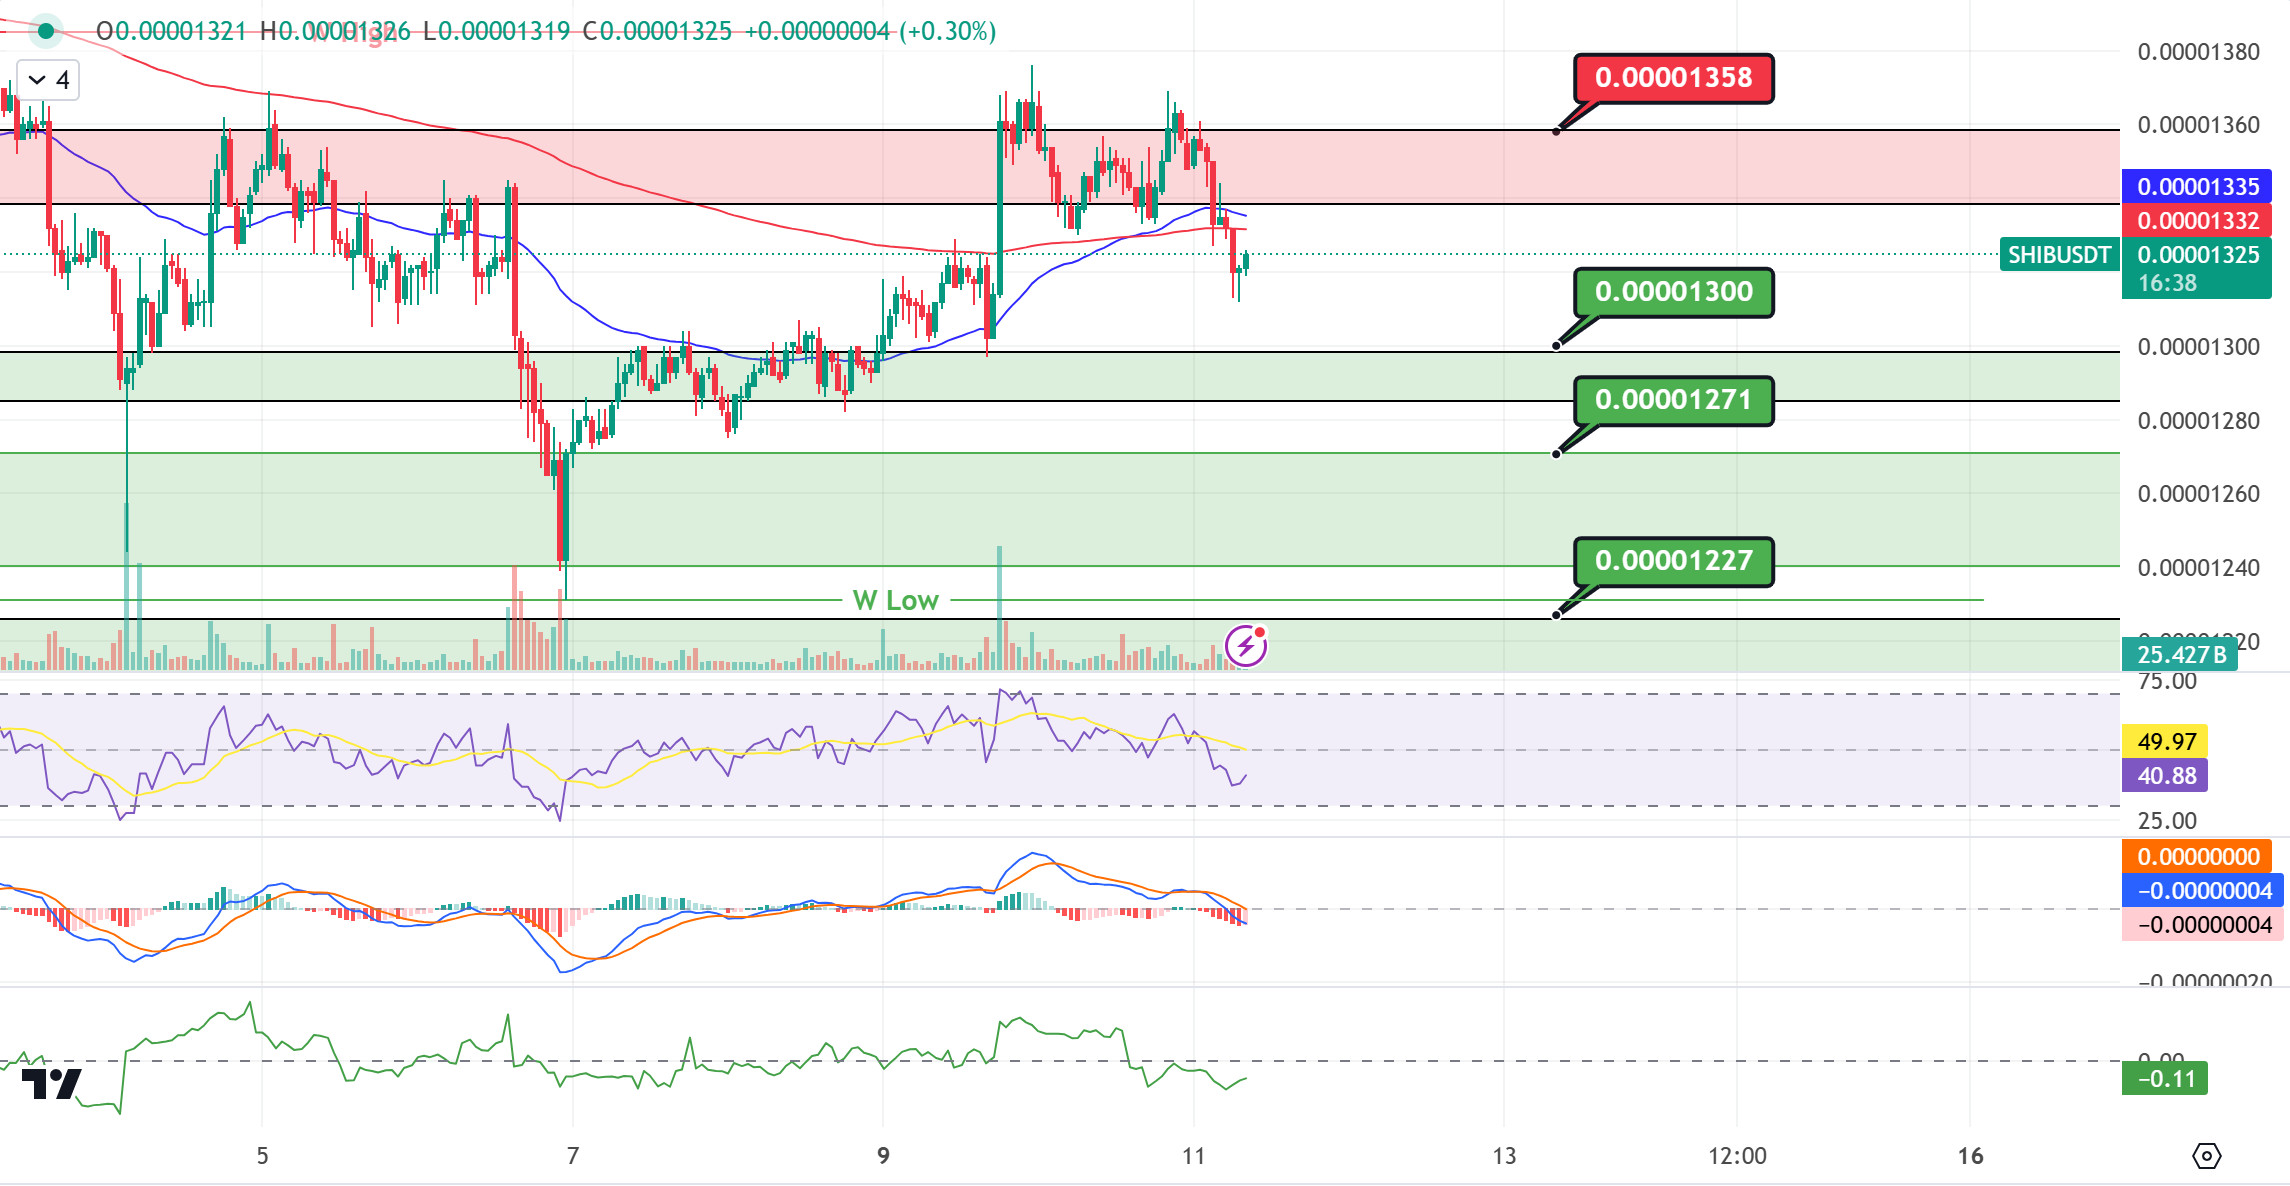
SHIB/USDT
Following the negative fallout from the Kamala Harris vs. Donald Trump debate in the US, Indodax (Indonesia’s largest crypto exchange) was hit by a cyberattack and $22 million in crypto assets were stolen. 9 billion Shiba Inu (SHIB) tokens were also seized in this attack.
When we examine the SHIB chart, the price continues to move down with the reaction it received from the 0.00001358 level. When we examine the MACD oscillator, we can say that the selling pressure on the price is decreasing. If the price closes the candle above the EMA 200 with increasing buyer pressure, it may want to break the selling pressure at 0.00001358. In the negative scenario, the price may retreat to the support at 0.00001300.
(Blue line: EMA50, Red line: EMA200)
Supports 0.00001300 – 0.00001271 – 0.00001227
Resistances 0.00001358 – 0.00001412 – 0.00001443
LEGAL NOTICE
The investment information, comments and recommendations contained herein do not constitute investment advice. Investment advisory services are provided by authorized institutions on a personal basis, taking into account the risk and return preferences of individuals. The comments and recommendations contained herein are of a general nature. These recommendations may not be suitable for your financial situation and risk and return preferences. Therefore, making an investment decision based solely on the information contained herein may not produce results in accordance with your expectations.
