
MARKET SUMMARY
Latest Situation in Crypto Assets
| Asset | Last Price | 24h Change | Dominance | Market Cap |
|---|---|---|---|---|
| BTC | $67,802.00 | 1.07% | 57.72% | $1.34 T |
| ETH | $2,619.00 | 0.34% | 13.58% | $314.77 B |
| SOLANA | $152.77 | 0.22% | 3.09% | $71.58 B |
| XRP | $0.5447 | -1.99% | 1.33% | $30.85 B |
| DOGE | $0.1337 | 9.47% | 0.85% | $19.58 B |
| TRX | $0.1589 | -0.60% | 0.59% | $13.75 B |
| CARDANO | $0.3453 | -0.08% | 0.52% | $12.06 B |
| AVAX | $27.50 | -0.31% | 0.48% | $11.16 B |
| SHIB | $0.00001862 | 3.94% | 0.47% | $10.95 B |
| LINK | $11.35 | 2.93% | 0.31% | $7.12 B |
| DOT | $4.211 | -0.06% | 0.27% | $6.35 B |
*Prepared on 10.18.2024 at 14:00 (UTC)
WHAT’S LEFT BEHIND
Bitcoin’s Market Dominance
Bitcoin’s market dominance reached 58.91%, the highest level since April 2021. On October 15, Bitcoin’s dominance rose to 58.91% after funds entering the market bought Bitcoin. With the Bitcoin price surpassing $68,000, the uptrend is expected to continue.
SEC Appeals Ripple Decision
The SEC took a remarkable step by appealing its decision in the Ripple case. It is demanding a re-examination of the decisions against Ripple CEO Brad Garlinghouse and Chris Larsen.
Elon Musk’s ‘D.O.G.E.’ Quotes
Elon Musk’s mention of ‘D.O.G.E.’ ignites Dogecoin rally! Dogecoin hit a three-month high after Elon Musk mentioned ‘D.O.G.E.’ at an event supporting Donald Trump.
HIGHLIGHTS OF THE DAY
Important Economic Calendar Data
| Time | News | Expectation | Previous |
|---|---|---|---|
| 16:10 | US FOMC Member Waller Speaks | N/A | N/A |
INFORMATION
*The calendar is based on UTC (Coordinated Universal Time) time zone. The economic calendar content on the relevant page is obtained from reliable news and data providers. The news in the economic calendar content, the date and time of the announcement of the news, possible changes in the previous, expectations and announced figures are made by the data provider institutions. Darkex cannot be held responsible for possible changes that may arise from similar situations.
MARKET COMPASS
The rally in digital assets, led by Bitcoin, which continues to hold on to its recent gains, seems to have lost some steam during European trading. Crypto-friendly Trump’s closer victory according to Polymarket data and continued inflows to ETFs continue to be the driving force. Expectations that the US Federal Reserve (FED) will continue to cut interest rates, albeit at a slower pace, new messages of support for the economy from institutions in China and developments in the Middle East are among the dynamics that cause rises.
BTC, which retested its last peak at $68,400 two days ago today, encountered resistance at this level. The rise, which came with positive news and positive perception components, turned into a breather. We maintain our bullish expectation as the main direction, but we can say that we have entered the session hours where it will not be a surprise to see a retracement or a horizontal course. Over the weekend after the traditional markets close, this effect may gain some more weight due to the nature of the market. In addition to our expectation of a short-term and short-term correction, we believe that the risks of designing strategies for downward movements are higher than for upward ones. In this regard, we believe that investors who want to position on potential pullbacks would not be making an irrational move, but they should be aware that they will have to deal with more factors to be considered.
TECHNICAL ANALYSIS
BTC/USDT
Bitcoin continues to be priced at its peak with low volatility. The increasing interest of institutional investors in recent days has led to the stabilization of the Bitcoin price. With the market dominance in an uptrend, Bitcoin, which is trying to gain momentum for the continuation of the upward movement in its price, is not correcting before a new ATH level. Although there is a mixed course in global markets on the last trading day of the week, the lack of data that may affect the price at the weekend will turn the eyes to the statements of the US presidential candidates about crypto.
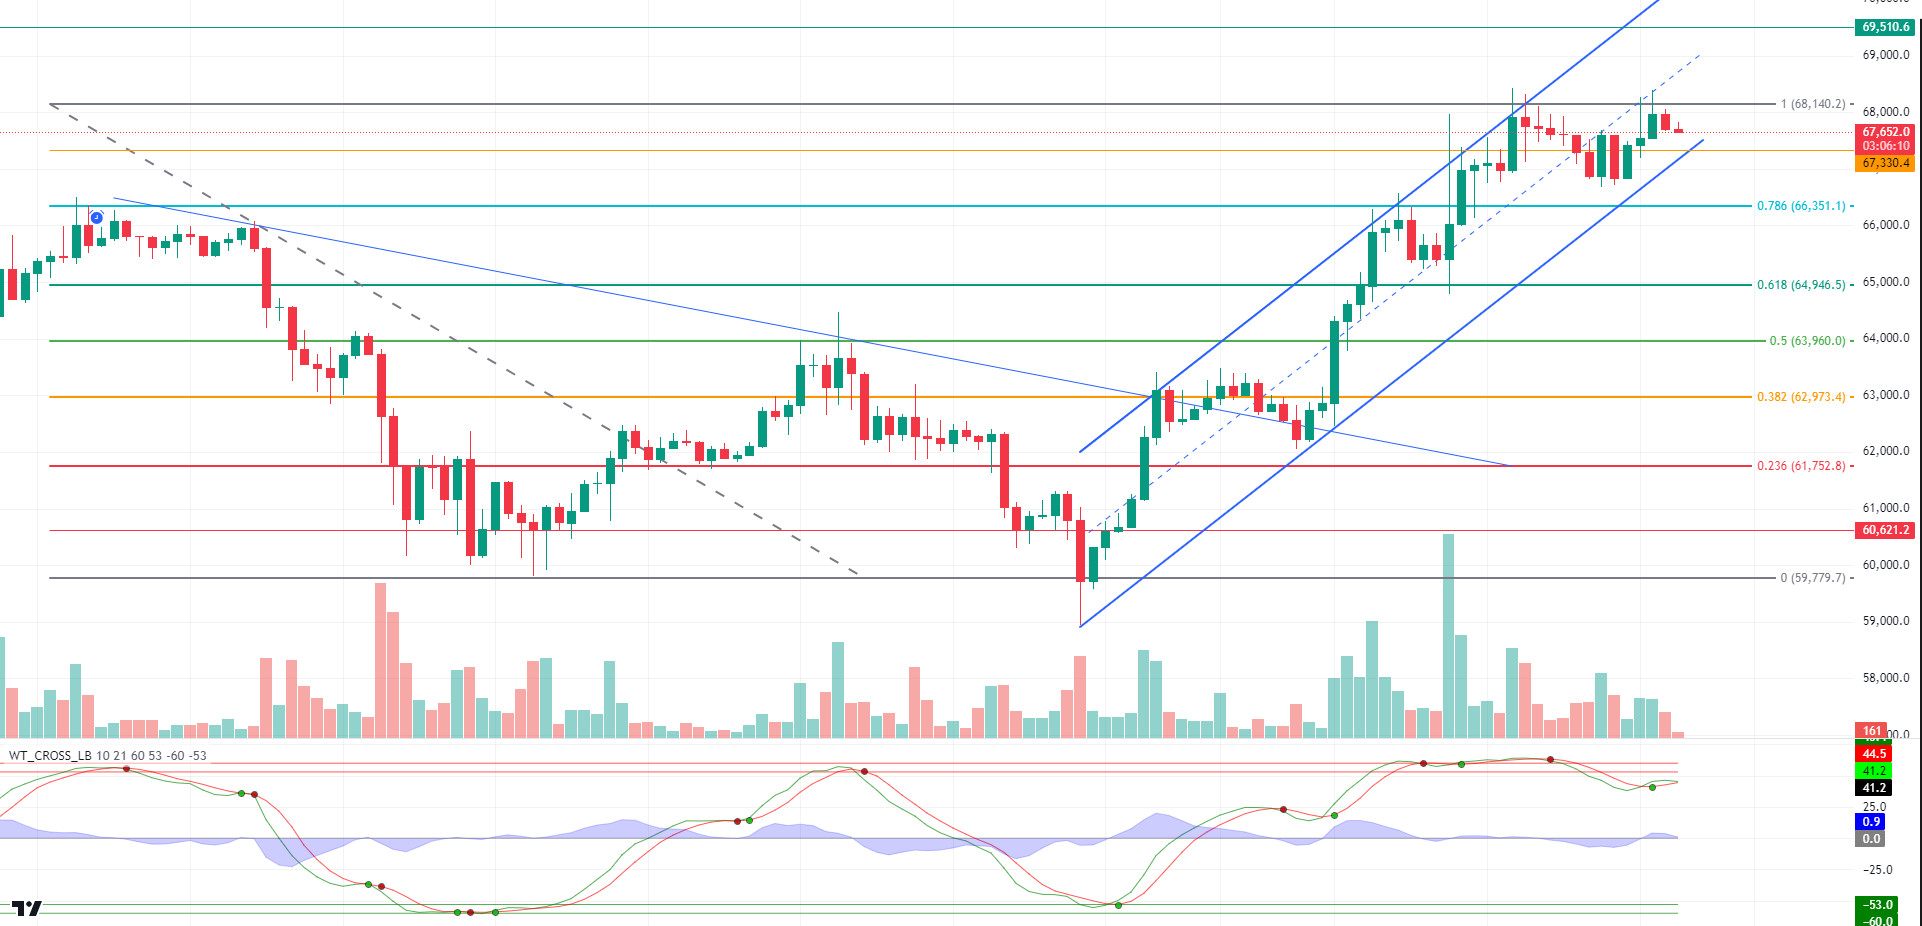
When we look at the BTC 4-hour technical analysis chart, it continues to push the Fibonacci 1 (68,140) level by pricing within the rising trend channel. Although it tried to exceed this level during the day, it is seen that it has not yet broken through. Testing the 69.510 level, which is the resistance level in the upward breakout, will be the last support resistance band range before the ATH level. The Wave trend oscillator, our technical indicator, has been moving in the overbought zone for a long time. In case of a potential correction expected by the market, hourly closes below the intermediate support level of 67,300 on hourly charts may bring a retracement towards the Fibonacci 0.786 (66,350) level.
Supports 67,330 – 66,350 – 64,946
Resistances 68,140 – 69,678 – 71,470
ETH/USDT
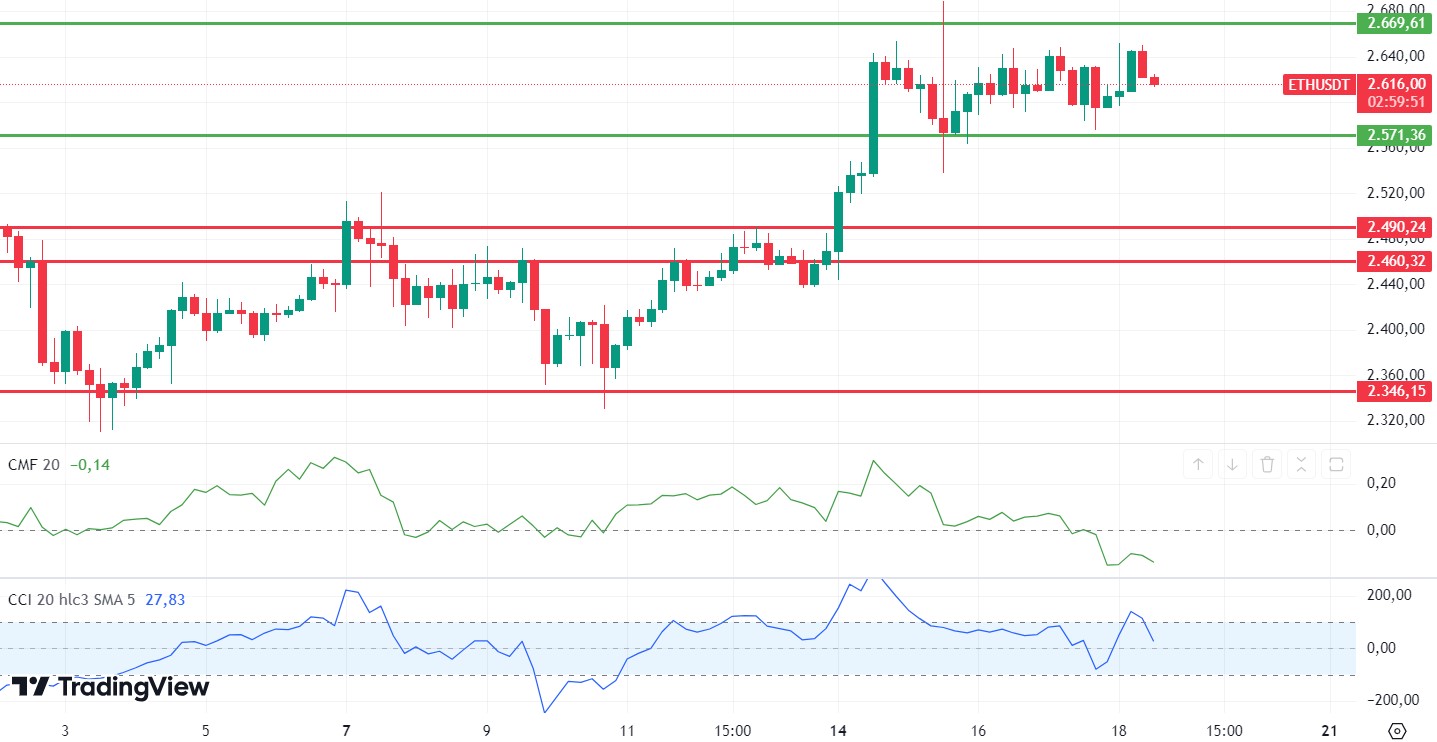
ETH fell as low as 2,600 with negative divergences on the Relative Strength Index (RSI), Commodity Channel Index (CCI) and Chaikin Money Flow (CMF) mentioned in the morning analysis. At the same time, the decline can be expected to continue for ETH, which lost the tenkan level of the Ichimoku indicator with this decline. The negativity seen in CMF and the declines in Cumulative Volume Delta (CVD) indicate that the buying appetite is decreasing. In this context, declines can be expected until the 2,571 main support level in the evening hours. However, a possible break of the 2,669 level may reinforce the uptrend and provide hard candles with volume.
Supports 2,571 – 2,490 – 2,460
Resistances 2,669 – 2,731 – 2,815
LINK/USDT
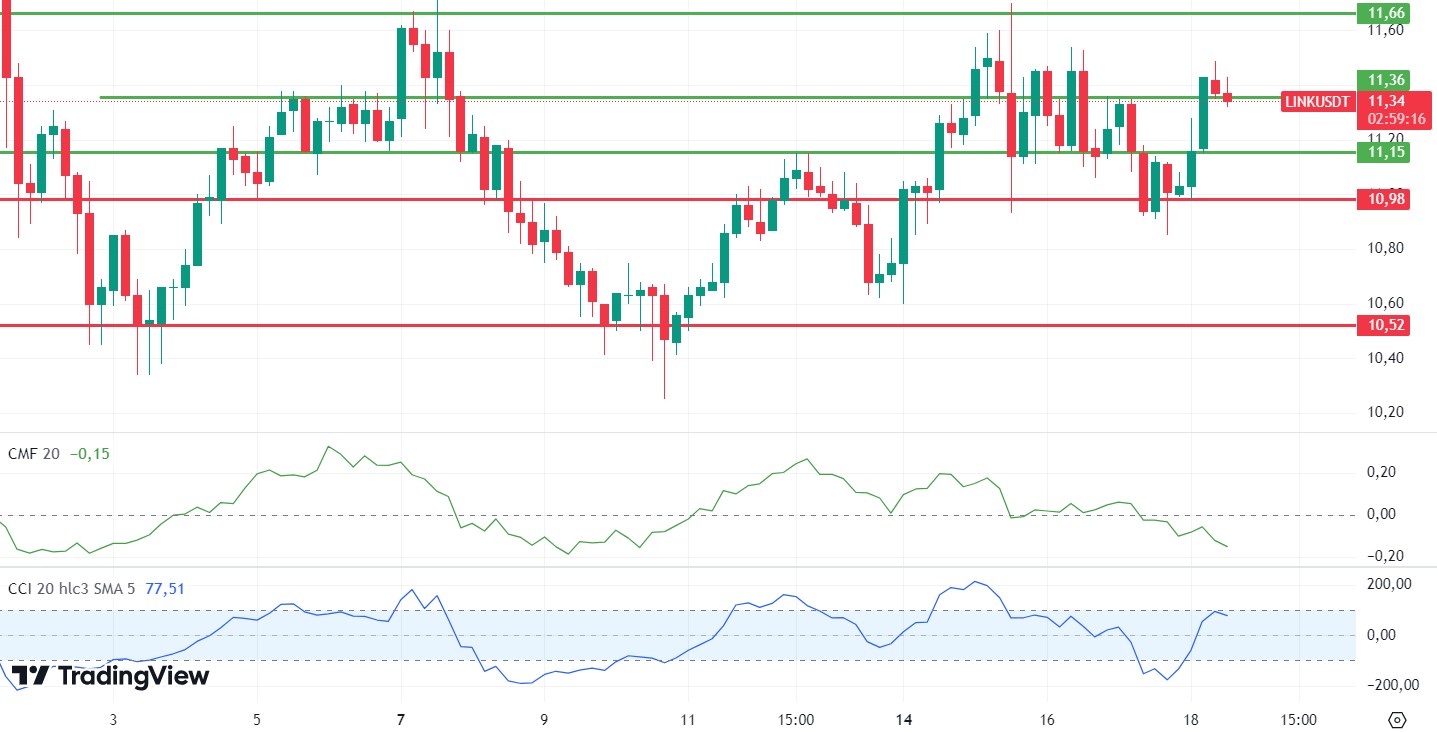
LINK, which fell below 10.98 support with the general decline in the crypto market during the day, has now risen above the kumo cloud again with the reaction it received from this level. With the negativity seen in Chaikin Money Flow (CMF), it can be said that the decline may continue. The kijun level of the Ichimoku indicator, the 11.15 level, is the new resistance point and movements above this level may enable the 11.36 resistance to be tested again.
Supports 10.98 – 10.52 – 9.89
Resistances 11.15 – 11.36 – 11.66
SOL/USDT
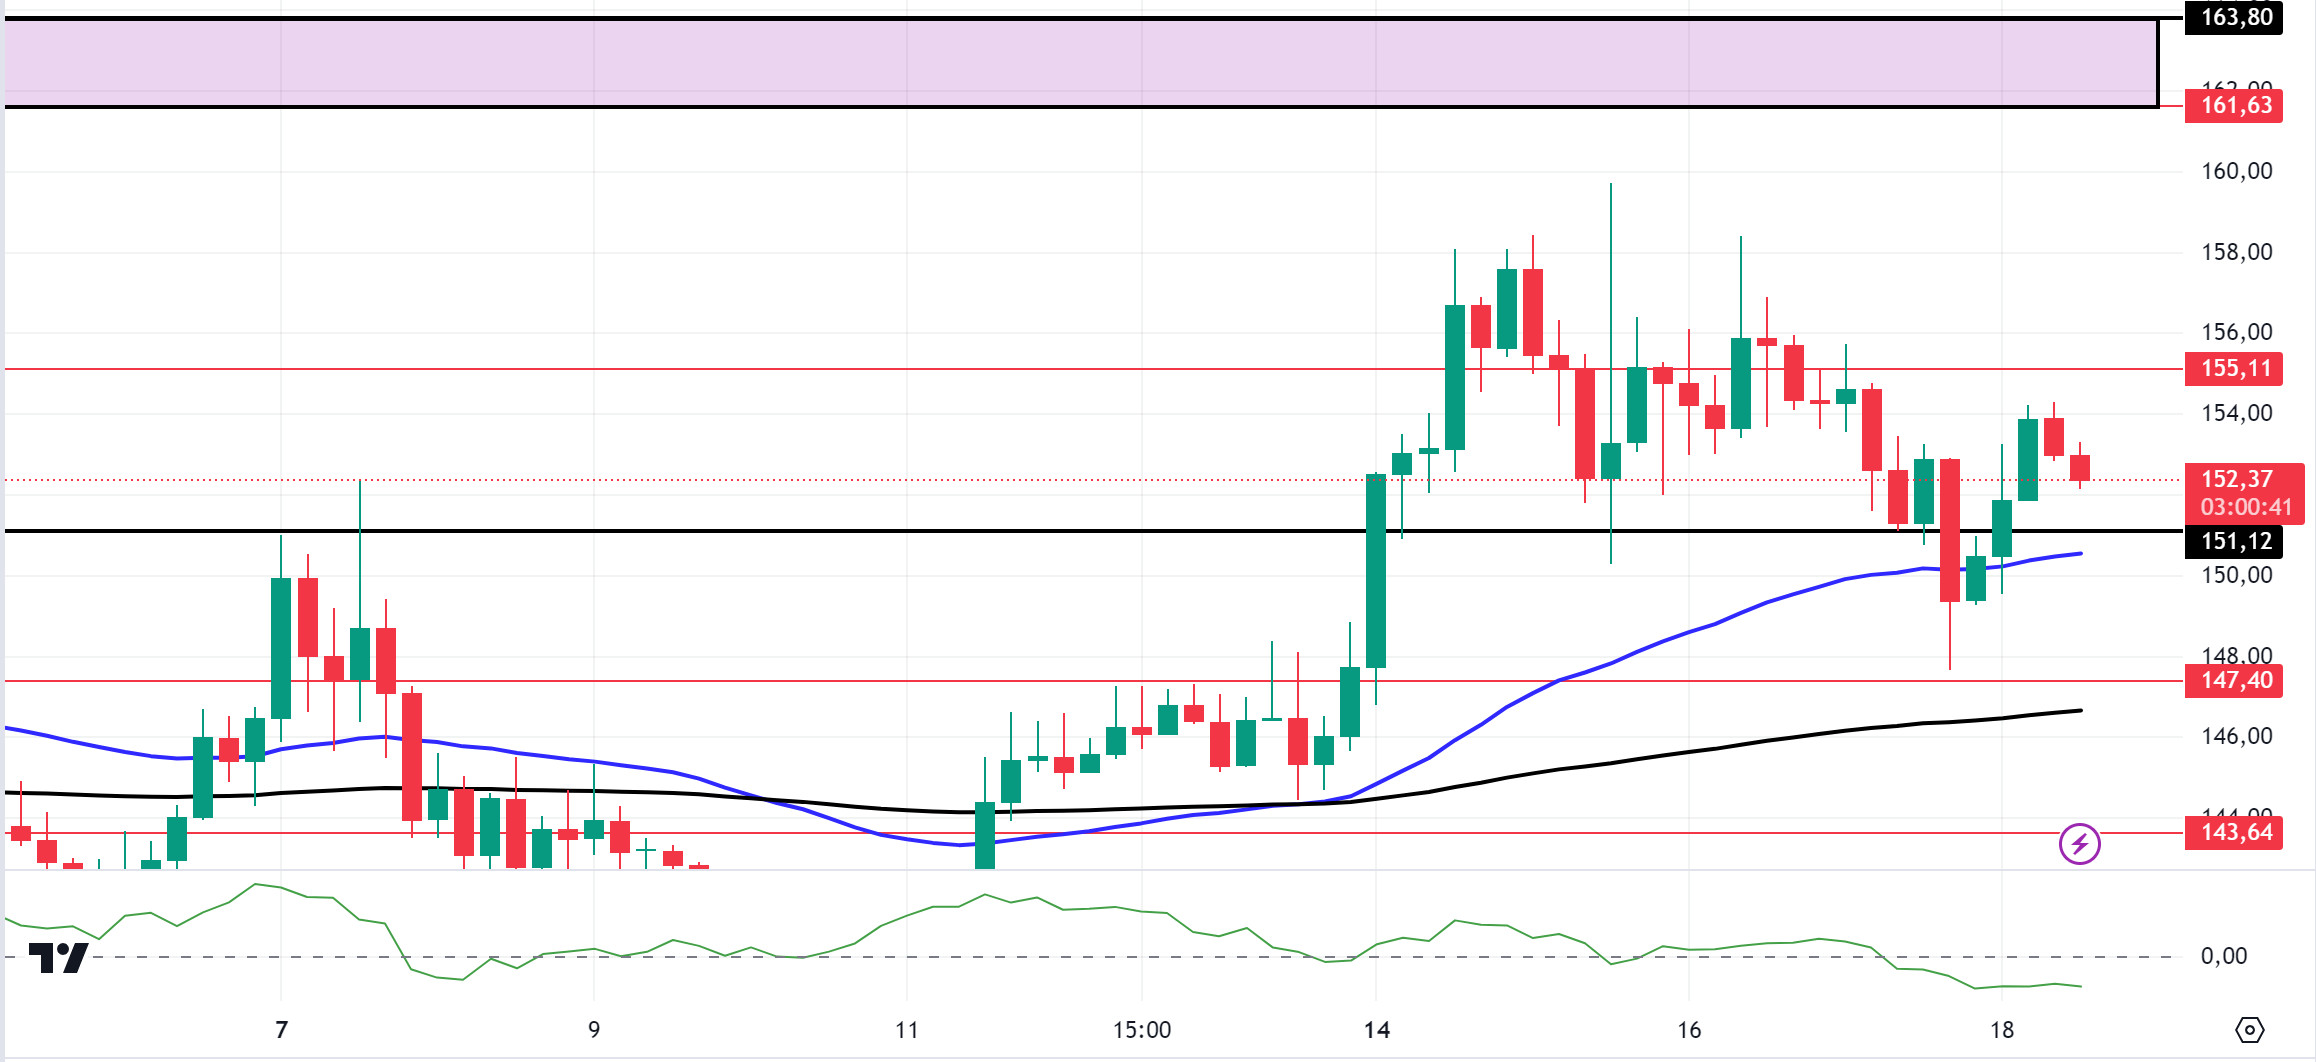
The horizontal SOL chart has moved sideways since our analysis in the morning. On the 4-hour timeframe, the 50 EMA (Blue Line) continues to be above the 200 EMA (Black Line). This could mean that the uptrend will continue. The price received support around 147.40, an important level. But when we look at the Chaikin Money Flow (CMF)20 indicator, this rise can be seen as a general market correction. The money flow in the chain is seen as negative. Therefore, the price is unable to break above the critical resistance which is the most important to continue the uptrend. This means that the SOL price could fall. The 161.63 level is a very strong resistance point in the uptrend driven by both macroeconomic conditions and innovations in the Solana ecosystem. If it breaks above this level, the uptrend may continue strongly. As the price continues to consolidate within key support and resistance zones, the recent rejection from resistance could signal a potential decline towards the support zone. Therefore, support levels of 151.12 – 147.40 should be followed. If the price hits these support levels, a potential bullish opportunity may arise.
Supports 151.12 – 147.40 – 143.64
Resistances 155.11 – 161.63 – 163.80
ADA/USDT
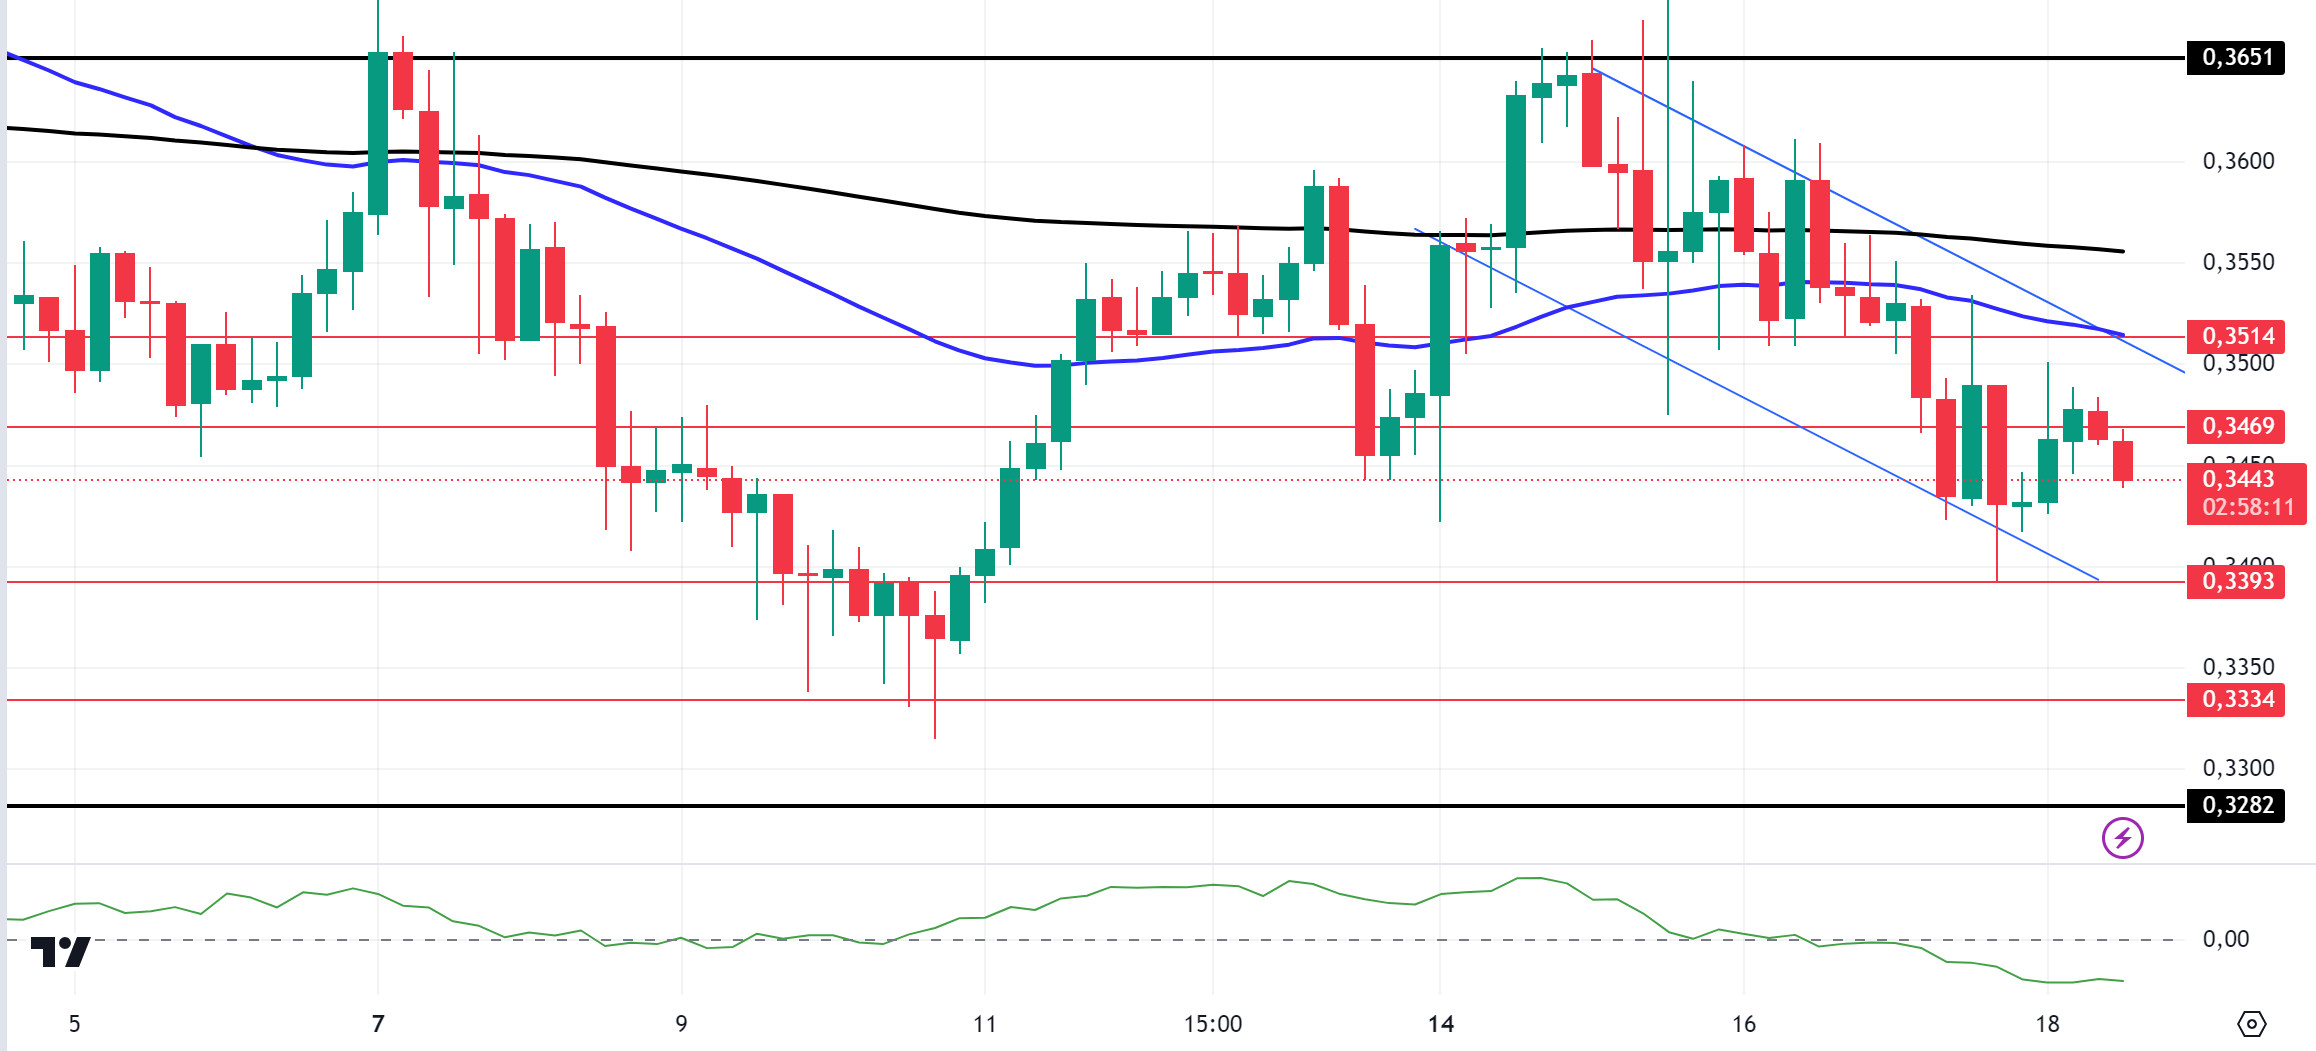
ADA price has been flat since our analysis in the morning. On the 4-hour chart, the downtrend that started on October 15th continues. ADA is struggling to gather enough volume to recover from its recent pullback. The Chaikin Money Flow (CMF)20 indicator is moving in negative territory. This indicates that money inflows are gradually decreasing. On the 4-hour chart, the price is pricing below the 50 EMA AND the 200 EMA. At the same time, the 50 EMA (Blue Line) continues to hover below the 200 EMA (Black Line). This supports that the trend is bearish. If macroeconomic data is positive for cryptocurrencies, it will retest the 0.3651 resistance level. The decrease in money flow and the recent rejection from the resistance could signal a potential decline towards the support zone. If this happens, 0.3282 is a support level and can be followed as a good place to buy.
Supports 0.3393 – 0.3334 – 0.3282
Resistances 0.3469 – 0.3514 – 0.3651
AVAX/USDT
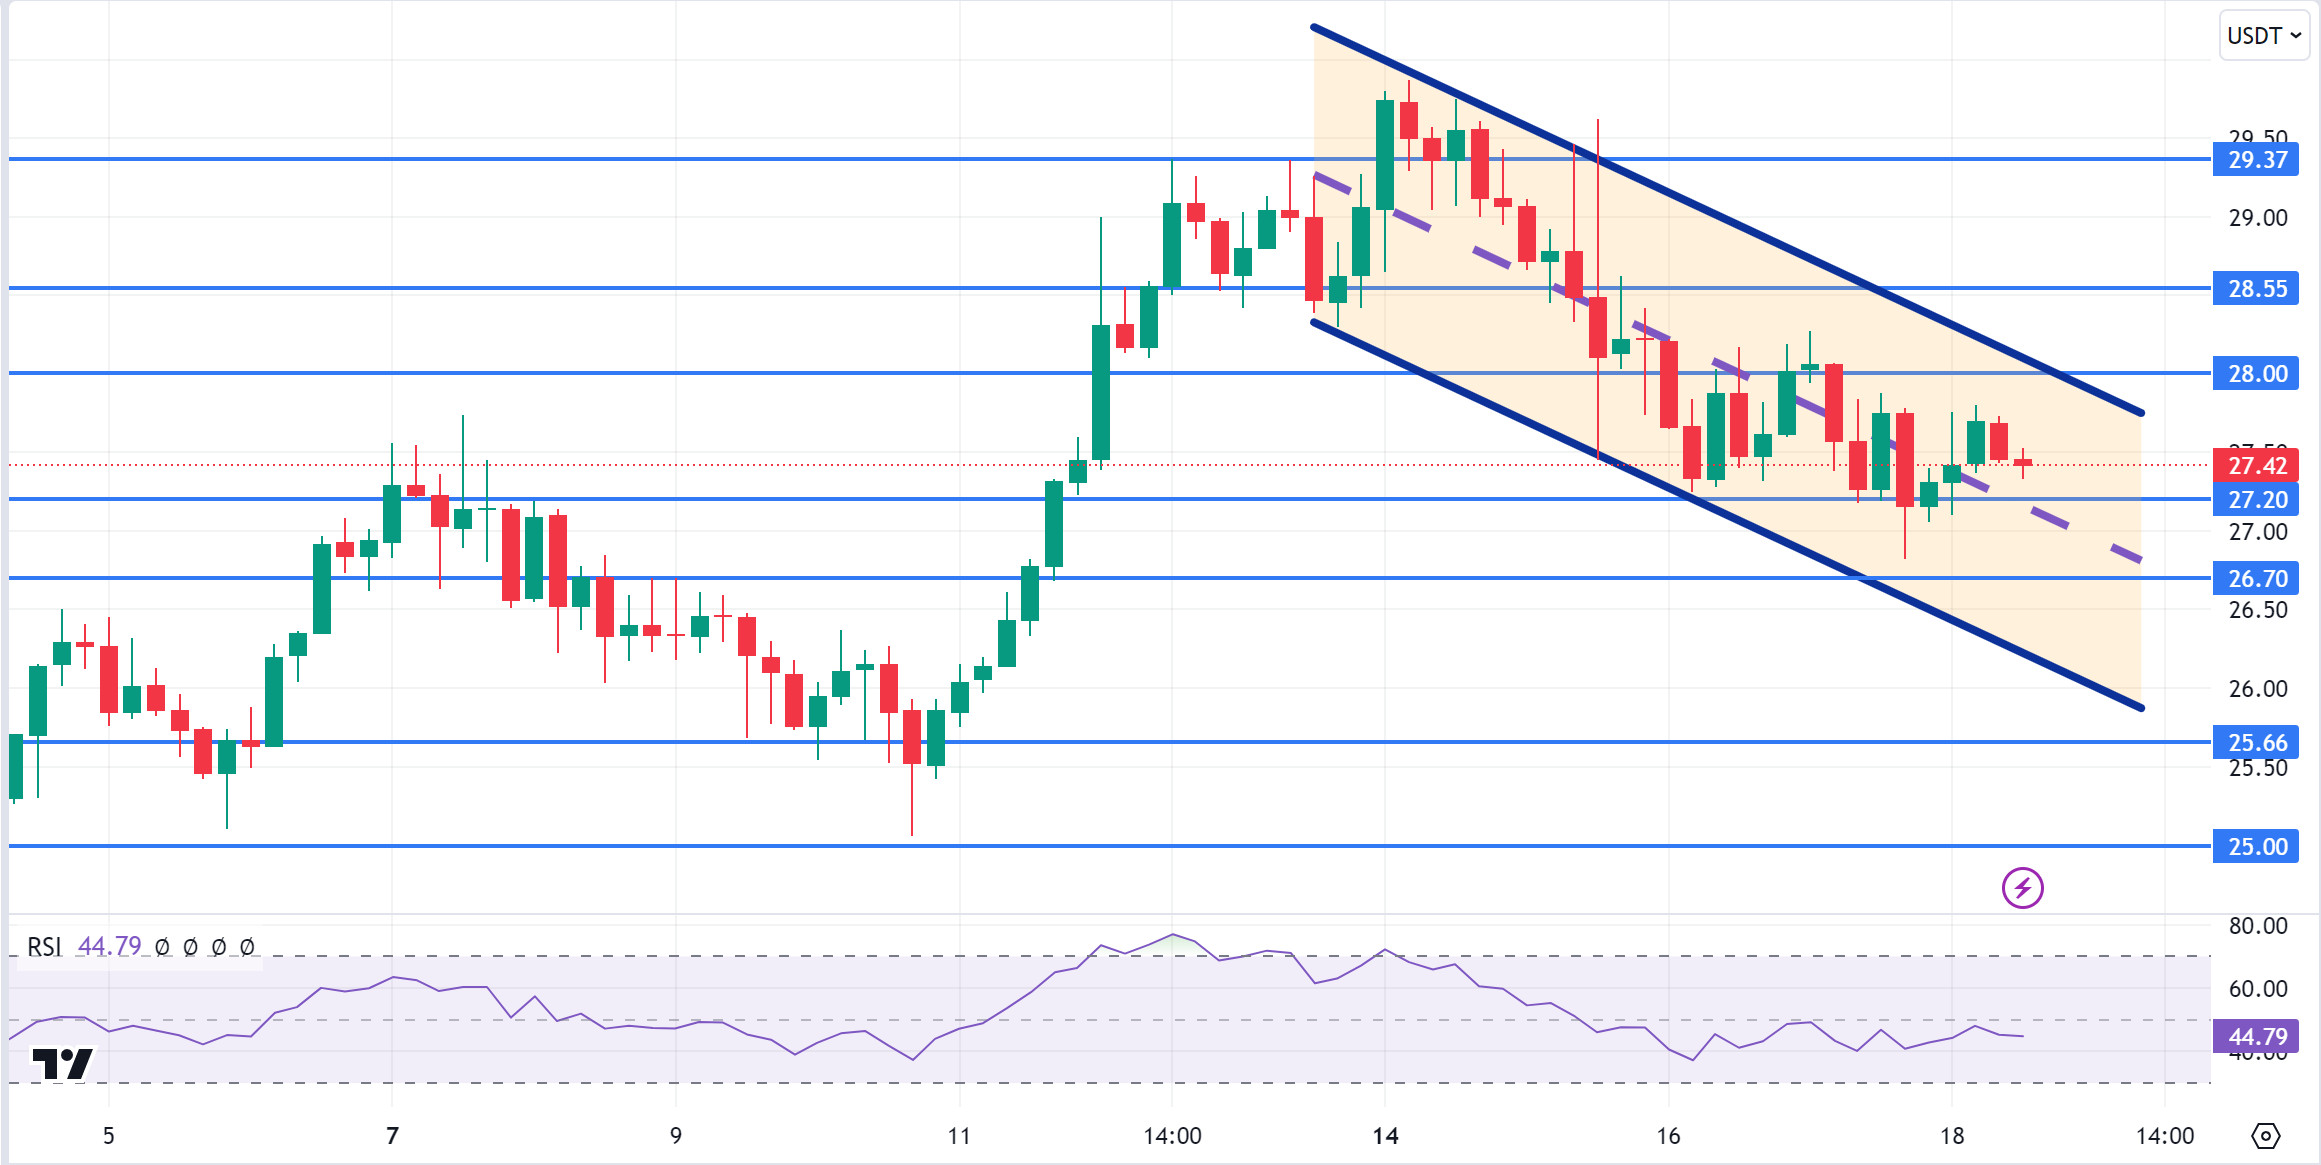
AVAX, which opened today at 27.31, is trading at 27.42, up about 0.5% during the day. Today, there is no planned data to be announced especially by the US and expected to affect the market. For this reason, it may be a low-volume day where we may see limited movements. News flows from the Middle East will be important for the market.
On the 4-hour chart, it is moving in a downtrend. It is in the middle band of the downtrend and with a Relative Strength Index value of 44, it can be expected to rise from here and move to the upper band. In such a case, it may test the 28.00 resistance. Sales may increase in case of negative news about the increasing tension in the Middle East. In such a case, it may test 26.70 support. As long as it stays above 25.00 support during the day, the desire to rise may continue. With the break of 25.00 support, sales may increase.
Supports 27.20 – 26.70 – 25.66
Resistances 28.00 – 28.55 – 29.37
TRX/USDT
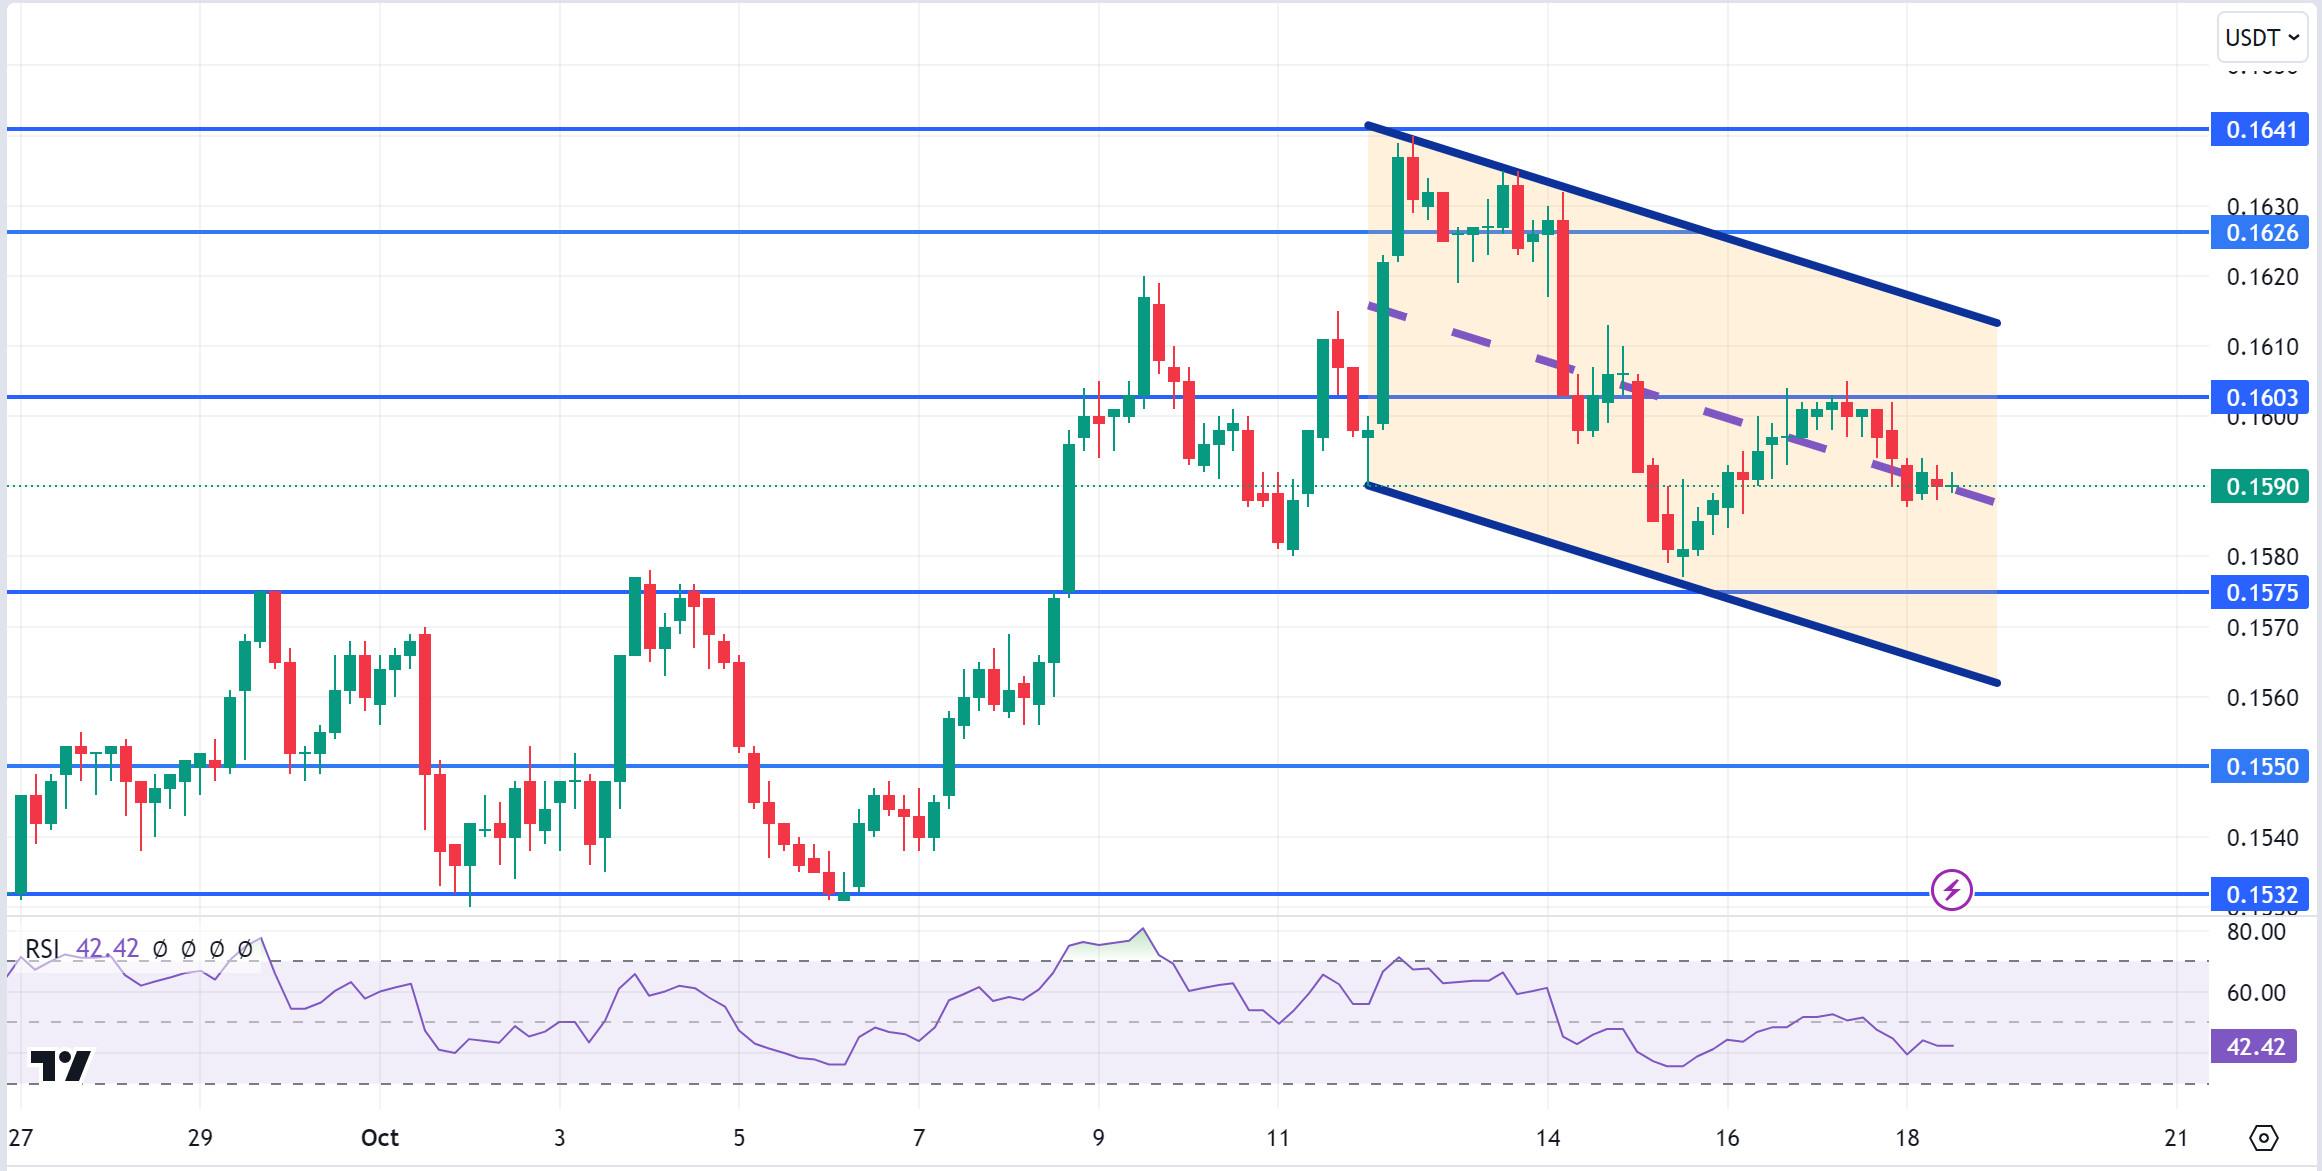
TRX, which started today at 0.1593, fell slightly during the day and is trading at 0.1590. There is no scheduled data for the market today. The market will be closely following the news flows regarding the tension in the Middle East.
On the 4-hour chart, it is in the middle band of the downtrend. With a Relative Strength Index value of 42, it can be expected to rise slightly from its current level. In such a case, it may test the 0.1603 resistance by moving up from the trend mid-band. However, if it cannot close the candle above 0.1603 resistance, it may test 0.1575 support with the selling pressure that may occur. As long as TRX stays above 0.1482 support, the desire to rise may continue. If this support is broken downwards, sales can be expected to increase.
Supports 0.1575 – 0.1550 – 0.1532
Resistances 0.1603 – 0.1626 – 0.1641
XRP/USDT
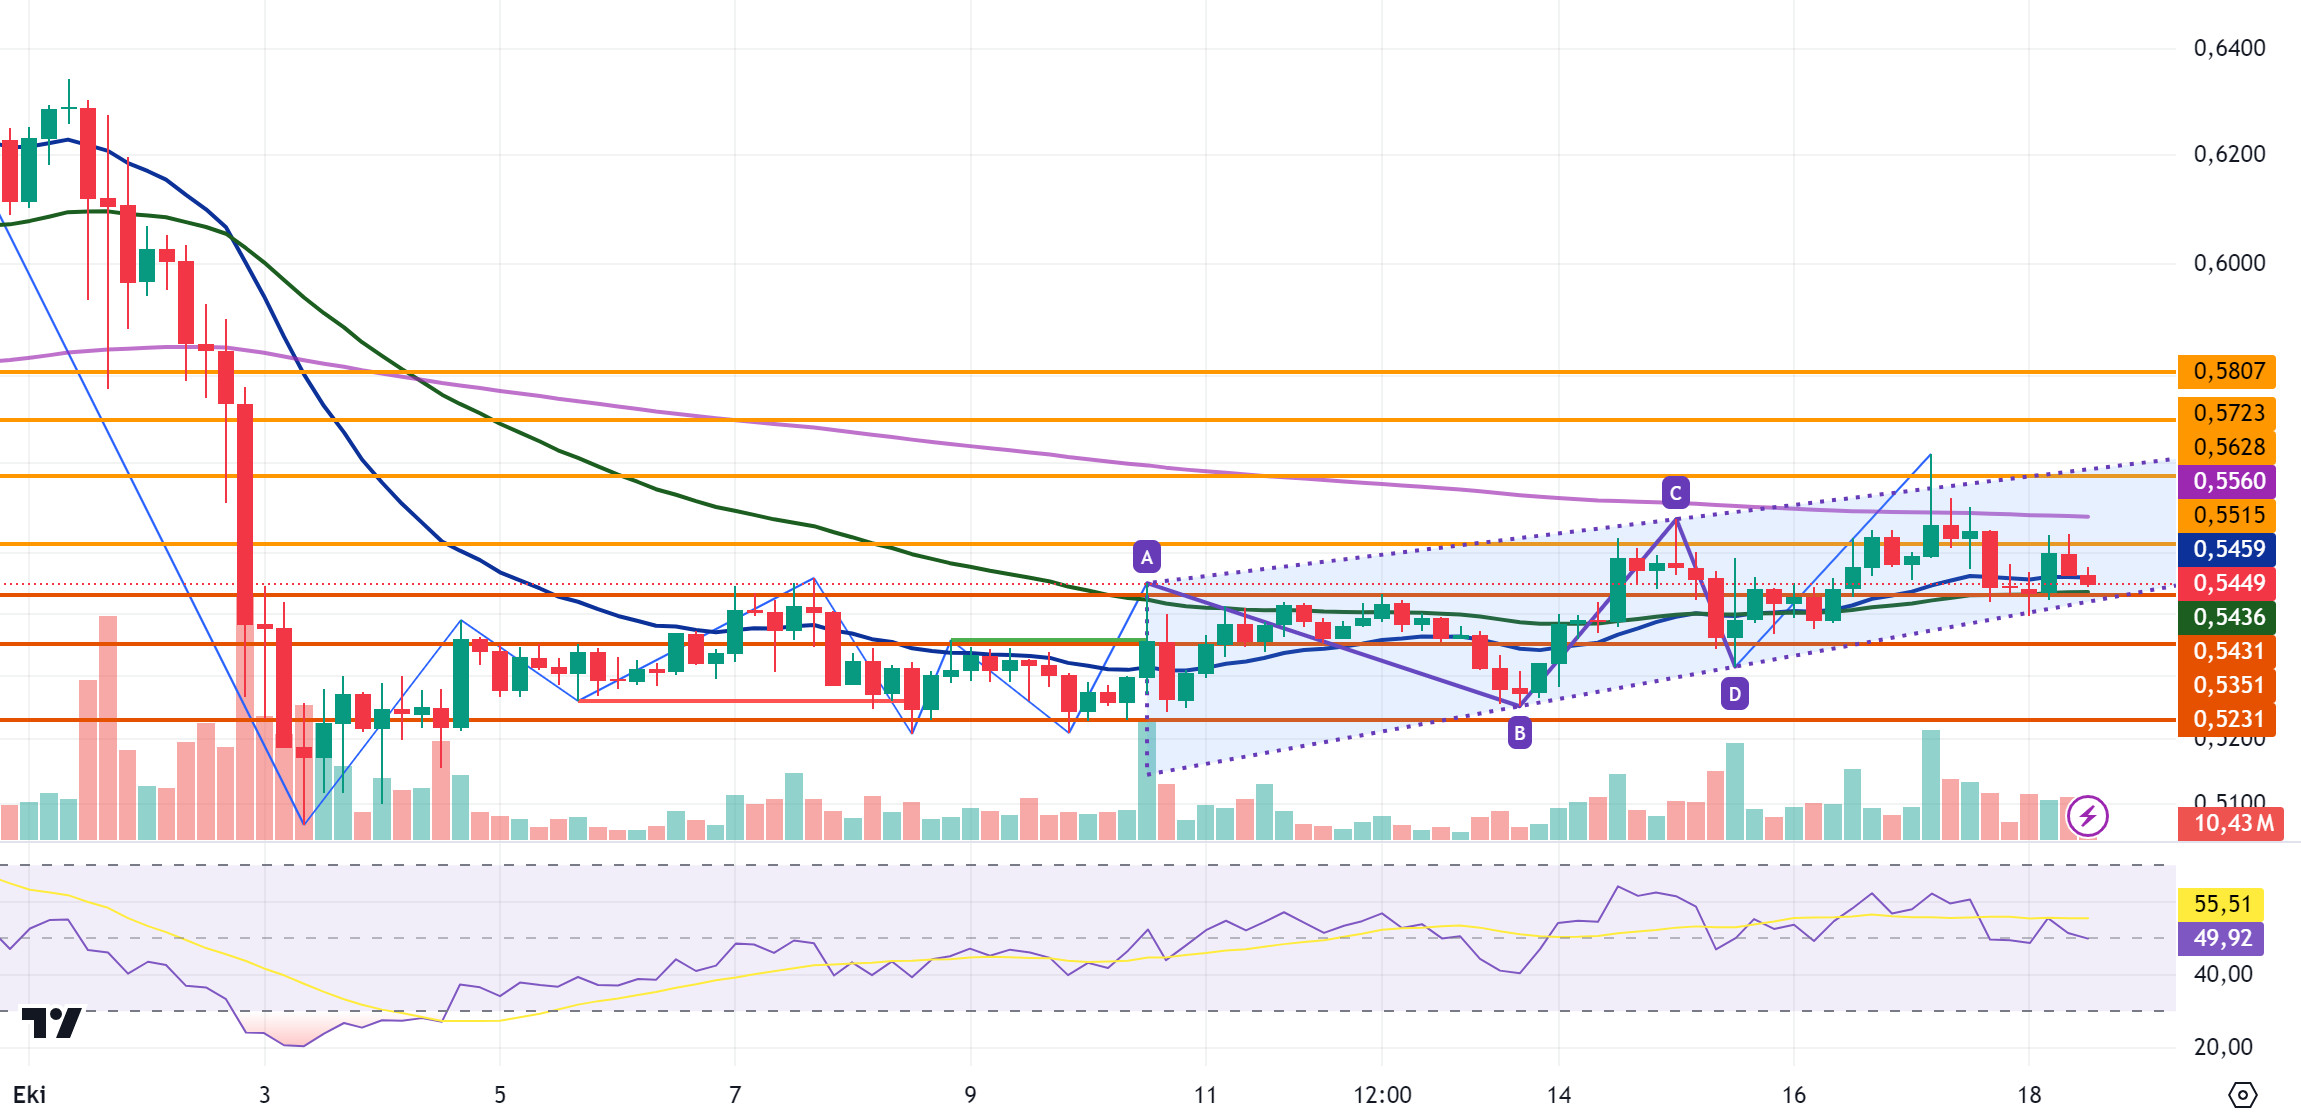
XRP fell with the sales at the 0.5515 resistance level in its rise today. XRP is currently trading at 0.5449. RSI data for XRP, which continues its horizontal movement between EMA20 and EMA50 levels, is neutral and may continue its horizontal movement. In case of positive developments for XRP, it may test the resistance levels of 0.5515-0.5628-0.5723 with its rise. On the contrary, in case of negative developments, it may test 0.5431-0.5351-0.5231 support levels with its decline.
XRP may decline with possible sales at the EMA200 level in its rise and may offer a short trading opportunity. In its decline, it may rise into a triangle formation with purchases at 0.5431 and may offer a long trading opportunity.
EMA20 (Blue Line) – EMA50 (Green Line) – EMA200 (Purple Line)
Supports 0.5431 – 0.5351 – 0.5231
Resistances 0.5515 – 0.5628 – 0.5723
DOGE/USDT
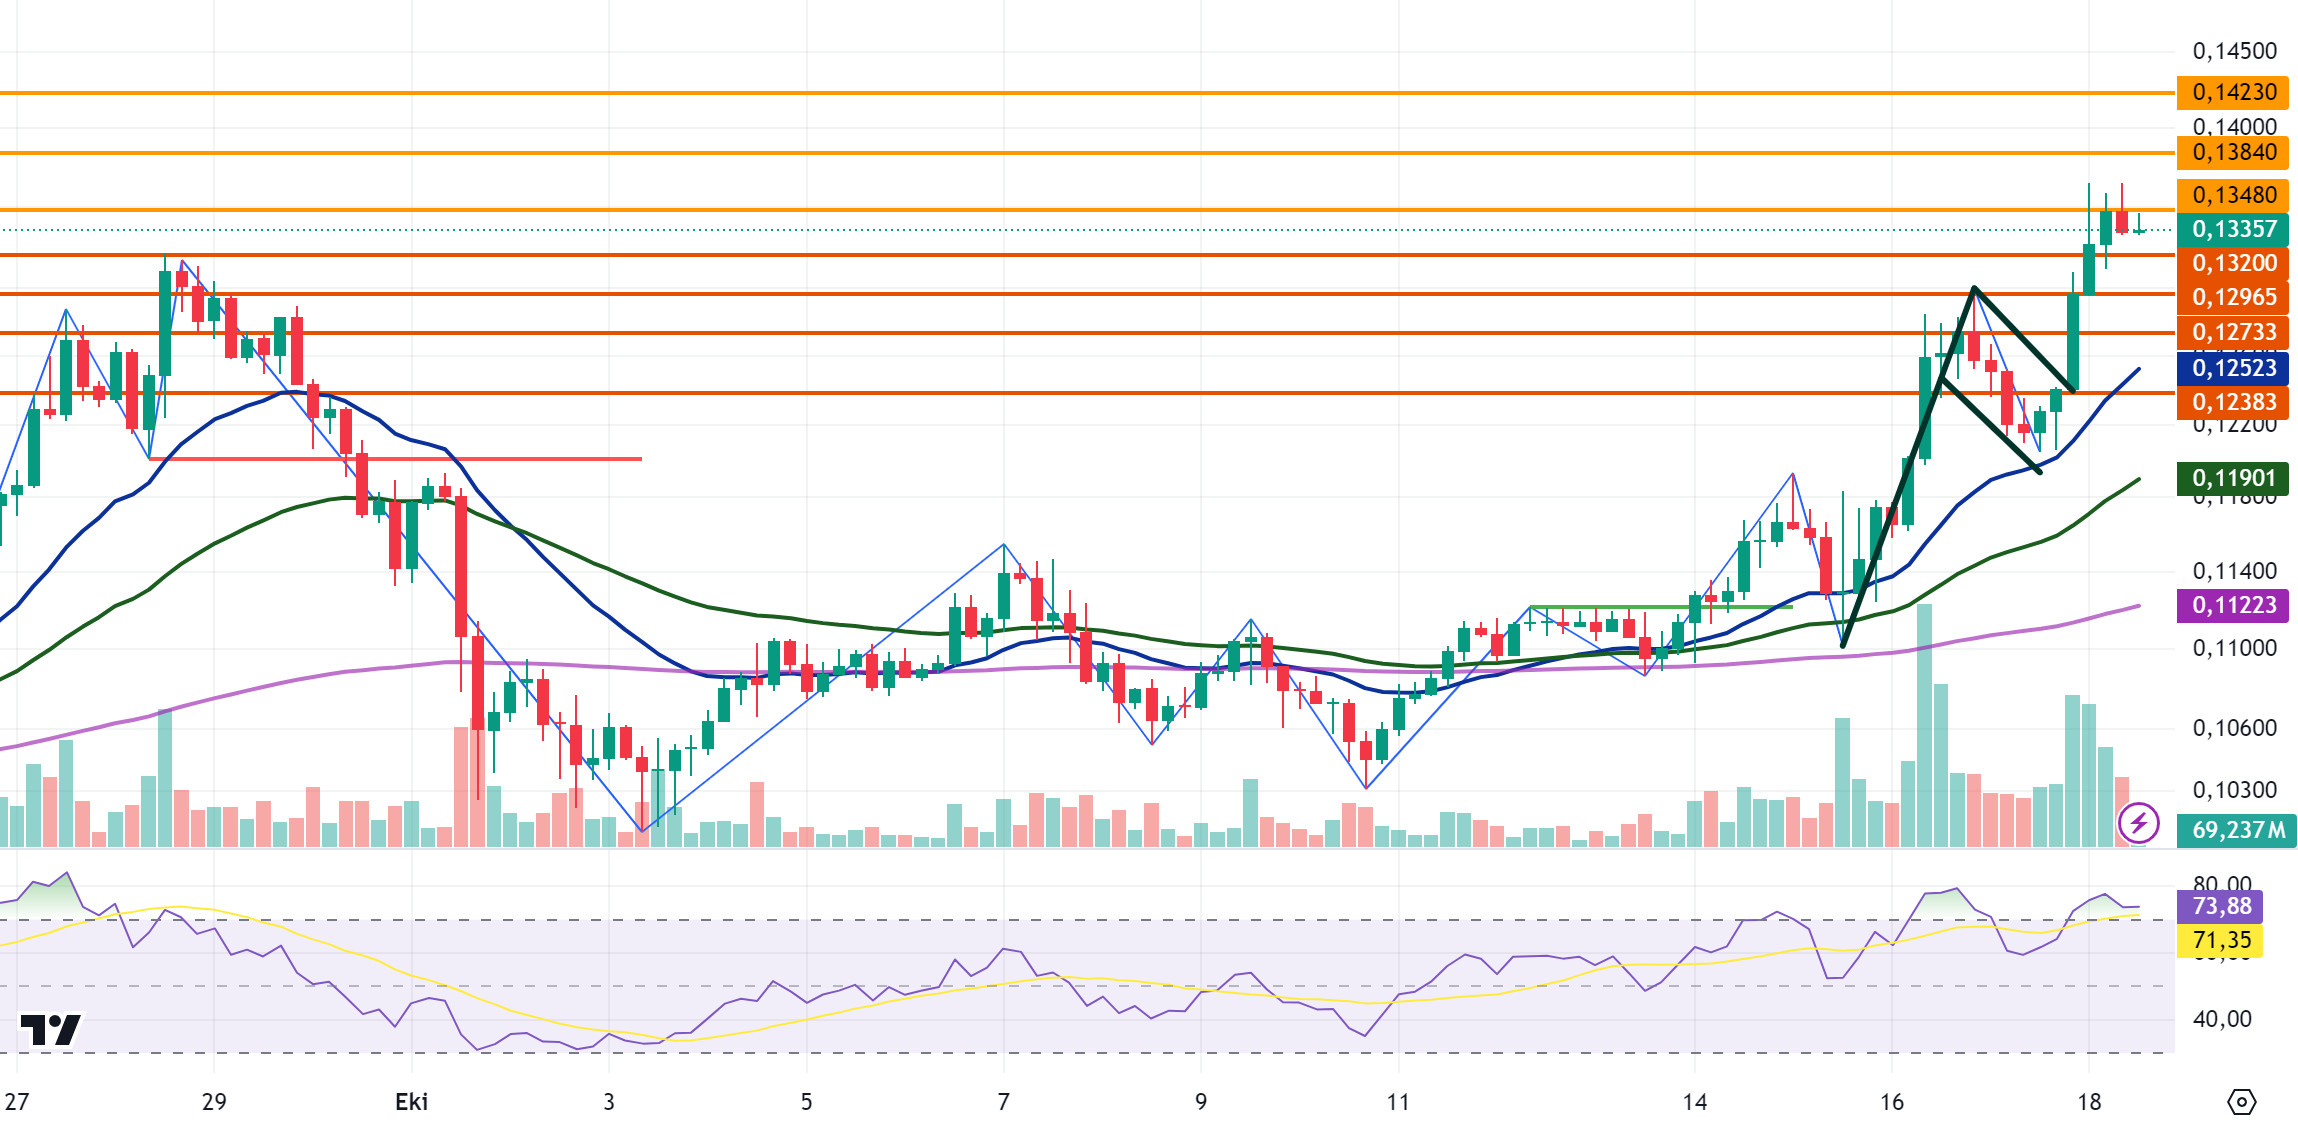
DOGE is currently trading at 0.1335 with a 3.2% increase in value today. After testing the resistance level of 0.1348 in the DOGE rise, it could not break it and fell with the incoming sales. For DOGE, which is in an uptrend, the general outlook is currently positive and may continue to rise. In the 4-hour analysis, a flag formation has formed, and DOGE may test the 0.1348-0.1384-0.1423 resistance levels if it starts to rise again. RSI data is in the overbought zone and DOGE may decline with possible sales and may test the support levels of 0.1320-0.1296-0.1273 if the decline deepens.
The Relative Strength Index (RSI) value is in the overbought zone and the decline may offer a short trading opportunity with sales that may come from DOGE. In its decline, it may rise again with the purchases that may come in the support zones and may offer a long trading opportunity.
EMA20 (Blue Line) – EMA50 (Green Line) – EMA200 (Purple Line)
Supports 0.1320 – 0.1296 – 0.1273
Resistances 0.1348 – 0.1384 – 0.1423
DOT/USDT
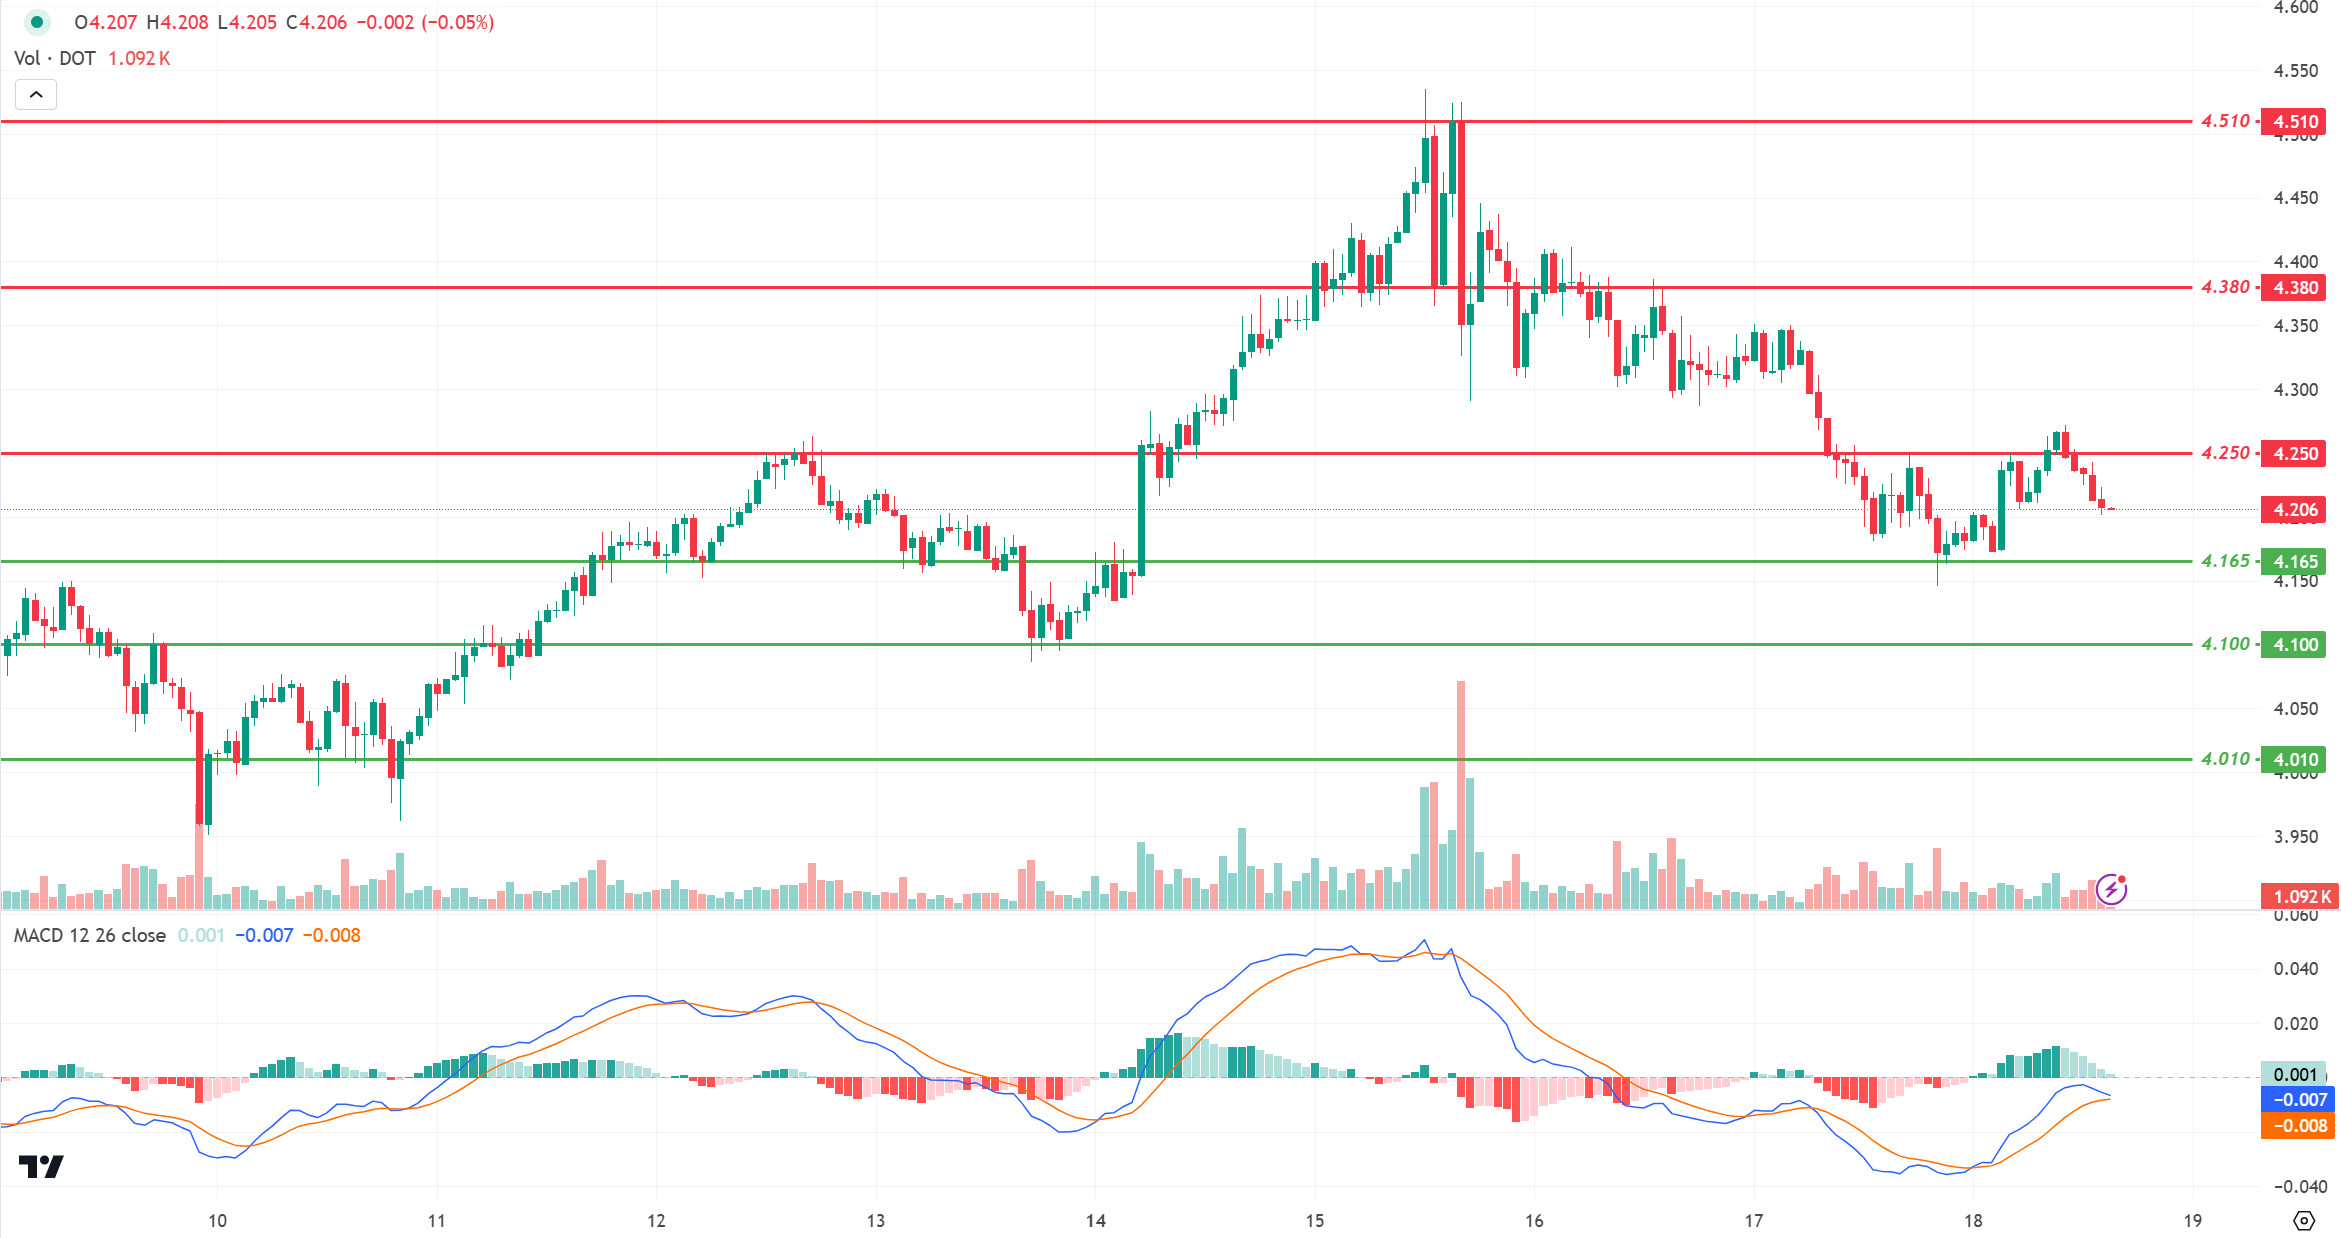
When we examine the Polkadot (DOT) chart, the price seems unable to break the selling pressure at the 4,250 resistance level. When we examine the MACD oscillator, we see that the buying pressure decreased compared to the previous hour. If the price does not get a reaction from the 4.165 support level, it may retreat towards the next support level of 4.100. On the other hand, if the price reacts from the 4,165 level and moves up, it may want to break the selling pressure at the 4,250 level.
Supports 4.165 – 4.100 – 4.010
Resistances 4.250 – 4.380 – 4.510
SHIB/USDT
Lucie, the official marketing leader of Shiba Inu, stated that FUD (fear, uncertainty, doubt) towards the SHIB ecosystem has reached a record high. Lucie emphasized that while the SHIB team continues to work on planned projects, the negative rhetoric usually comes from people who are not invested in SHIB. He also announced that the SHIB DAO Foundation will be launched in late 2024 or 2025. This structure is seen as a step towards a decentralized future for the SHIB ecosystem.
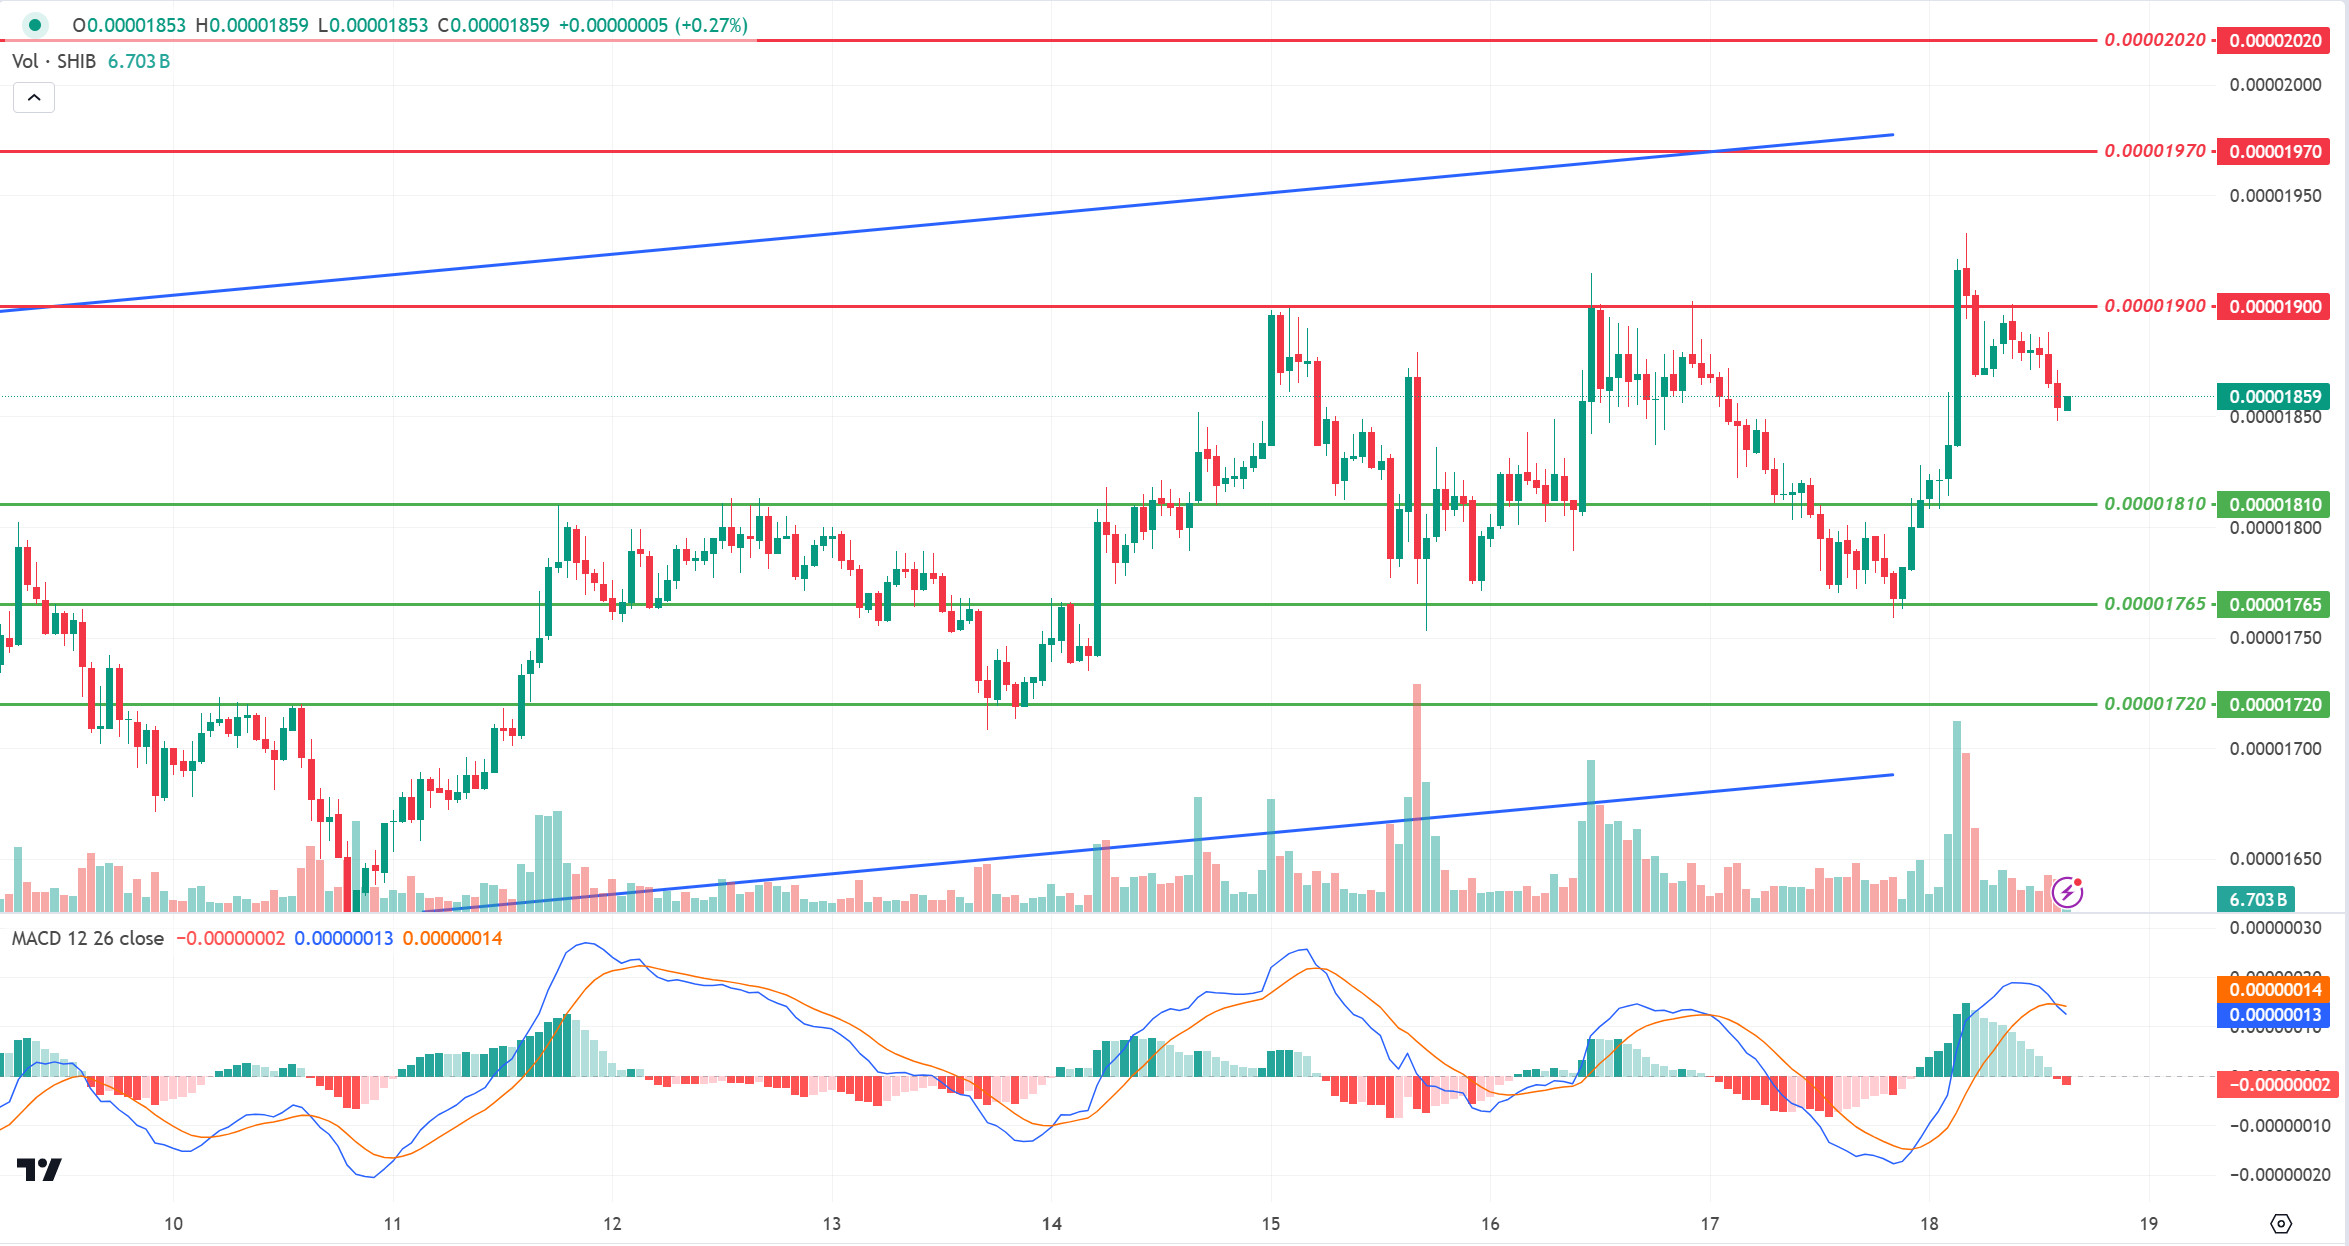
When we examine the chart of Shiba Inu (SHIB), selling pressure continues after the negative divergence between On Balance Volume (OBV) and price. The price seems to have lost the 0.00001865 support. When we examine the MACD oscillator, we can say that the selling pressure is increasing. In this context, the price may retreat towards 0.00001810 support levels. On the other hand, in case of increased buying pressure, if the price can maintain above the 0.00001865 level, its next target may be the 0.00001900 level.
Supports 0.00001810 – 0.00001765 – 0.00001720
Resistances 0.00001865 – 0.00001900 – 0.00001970
LEGAL NOTICE
The investment information, comments and recommendations contained herein do not constitute investment advice. Investment advisory services are provided individually by authorized institutions taking into account the risk and return preferences of individuals. The comments and recommendations contained herein are of a general nature. These recommendations may not be suitable for your financial situation and risk and return preferences. Therefore, making an investment decision based solely on the information contained herein may not produce results in line with your expectations.
