
MARKET SUMMARY
Latest Situation in Crypto Assets
| Assets | Last Price | 24h Change | Dominance | Market Cap |
|---|---|---|---|---|
| BTC | 74,148.49 | +7.81% | 59.39% | 1.46 T |
| ETH | 2,625.42 | +7.53% | 12.80% | 315.56 B |
| SOLANA | 187.16 | +14.61% | 3.58% | 88.13 B |
| XRP | 0.5325 | +5.08% | 1.23% | 30.28 B |
| DOGE | 0.2000 | +17.00% | 1.19% | 29.21 B |
| TRX | 0.1638 | +1.61% | 0.57% | 14.16 B |
| CARDANO | 0.3579 | +7.75% | 0.51% | 12.53 B |
| SHIB | 0.00001895 | +5.73% | 0.45% | 11.16 B |
| AVAX | 26.47 | +13.04% | 0.44% | 10.80 B |
| LINK | 11.79 | +10.80% | 0.30% | 7.39 B |
| DOT | 4.078 | +5.85% | 0.25% | 6.19 B |
*Prepared on 11.6.2024 at 06:00 (UTC)
WHAT’S LEFT BEHIND
Donald Trump is Back
Donald Trump’s re-election as US President has created great expectations for the cryptocurrency industry. The promise of cryptocurrency-friendly policies created excitement among investors. However, it is not yet known how realistic these promises are.
What awaits the crypto world with Trump: What were the promises?
What has Donald Trump promised the crypto and Bitcoin world over the past year? Item by item.
- Working to ensure that all uncirculated BTC is mined in the US from now on (Support for mining companies)
- Creating a Bitcoin reserve
- Ensuring that more than 200,000 BTC held by the Department of Justice are not sold
- To remove SEC chairman Gary Gensler and thwart Elizabeth Warren’s “crypto attacks”
- Creating clearer and more precise regulatory rules
- Preventing CBDC extraction
- Securing the release of Silk Road founder Ross Ulbricht, who is serving two life sentences
HIGHLIGHTS OF THE DAY
*There is no important calendar data for the rest of the day.
INFORMATION
*The calendar is based on UTC (Coordinated Universal Time) time zone. The economic calendar content on the relevant page is obtained from reliable news and data providers. The news in the economic calendar content, the date and time of the announcement of the news, possible changes in the previous, expectations and announced figures are made by the data provider institutions. Darkex cannot be held responsible for possible changes that may arise from similar situations.
MARKET COMPASS
Global markets are talking about Trump’s victory. Elected as the 47th President of the world’s largest economy, former President Donald Trump was once again authorized to govern the US for four years. As a result, there were sharp rises in digital assets, the dollar and US bond yields. Futures contracts are also pointing to an opening with a rise in stock market indices.
Cryptocurrencies greeted Trump’s victory with euphoria, led by Bitcoin’s record high in the morning hours. During European trading, we saw some respite.
From the short term to the big picture
The victory of former President Trump, which was one of the main pillars of our bullish expectation for the long term perspective in digital assets, produced a result in line with our forecasts. For the short term, given the nature of the market and pricing behavior, we stated in our morning analysis that we think it would not be surprising to see some respite or retracement in digital assets after this expectation, and we believe we have seen some of this. At this point, it would be useful to underline again that the fundamental dynamics are bullish. While the expansion of the largest digital currency Bitcoin’s record high may encourage buyers to take new, upside positions, we will continue to monitor this group’s struggle with the crowd that may want to take profit realizations. In the wake of the recent rally, the dose of institutional investor interest in ETFs and post-election statements could be short-term metrics that could continue to drive prices.
TECHNICAL ANALYSIS
BTC/USDT
With the conclusion of the US elections, the presidency of D. Trump, who was referred to as the ‘Bitcoin President’ before the election, was officially announced. The Bitcoin world is focused on Trump’s promises such as ‘Creating a Bitcoin Reserve’, ‘Regulations’ and ‘Making the US the Capital of Bitcoin’. How these issues will develop in the coming period will be followed with curiosity.
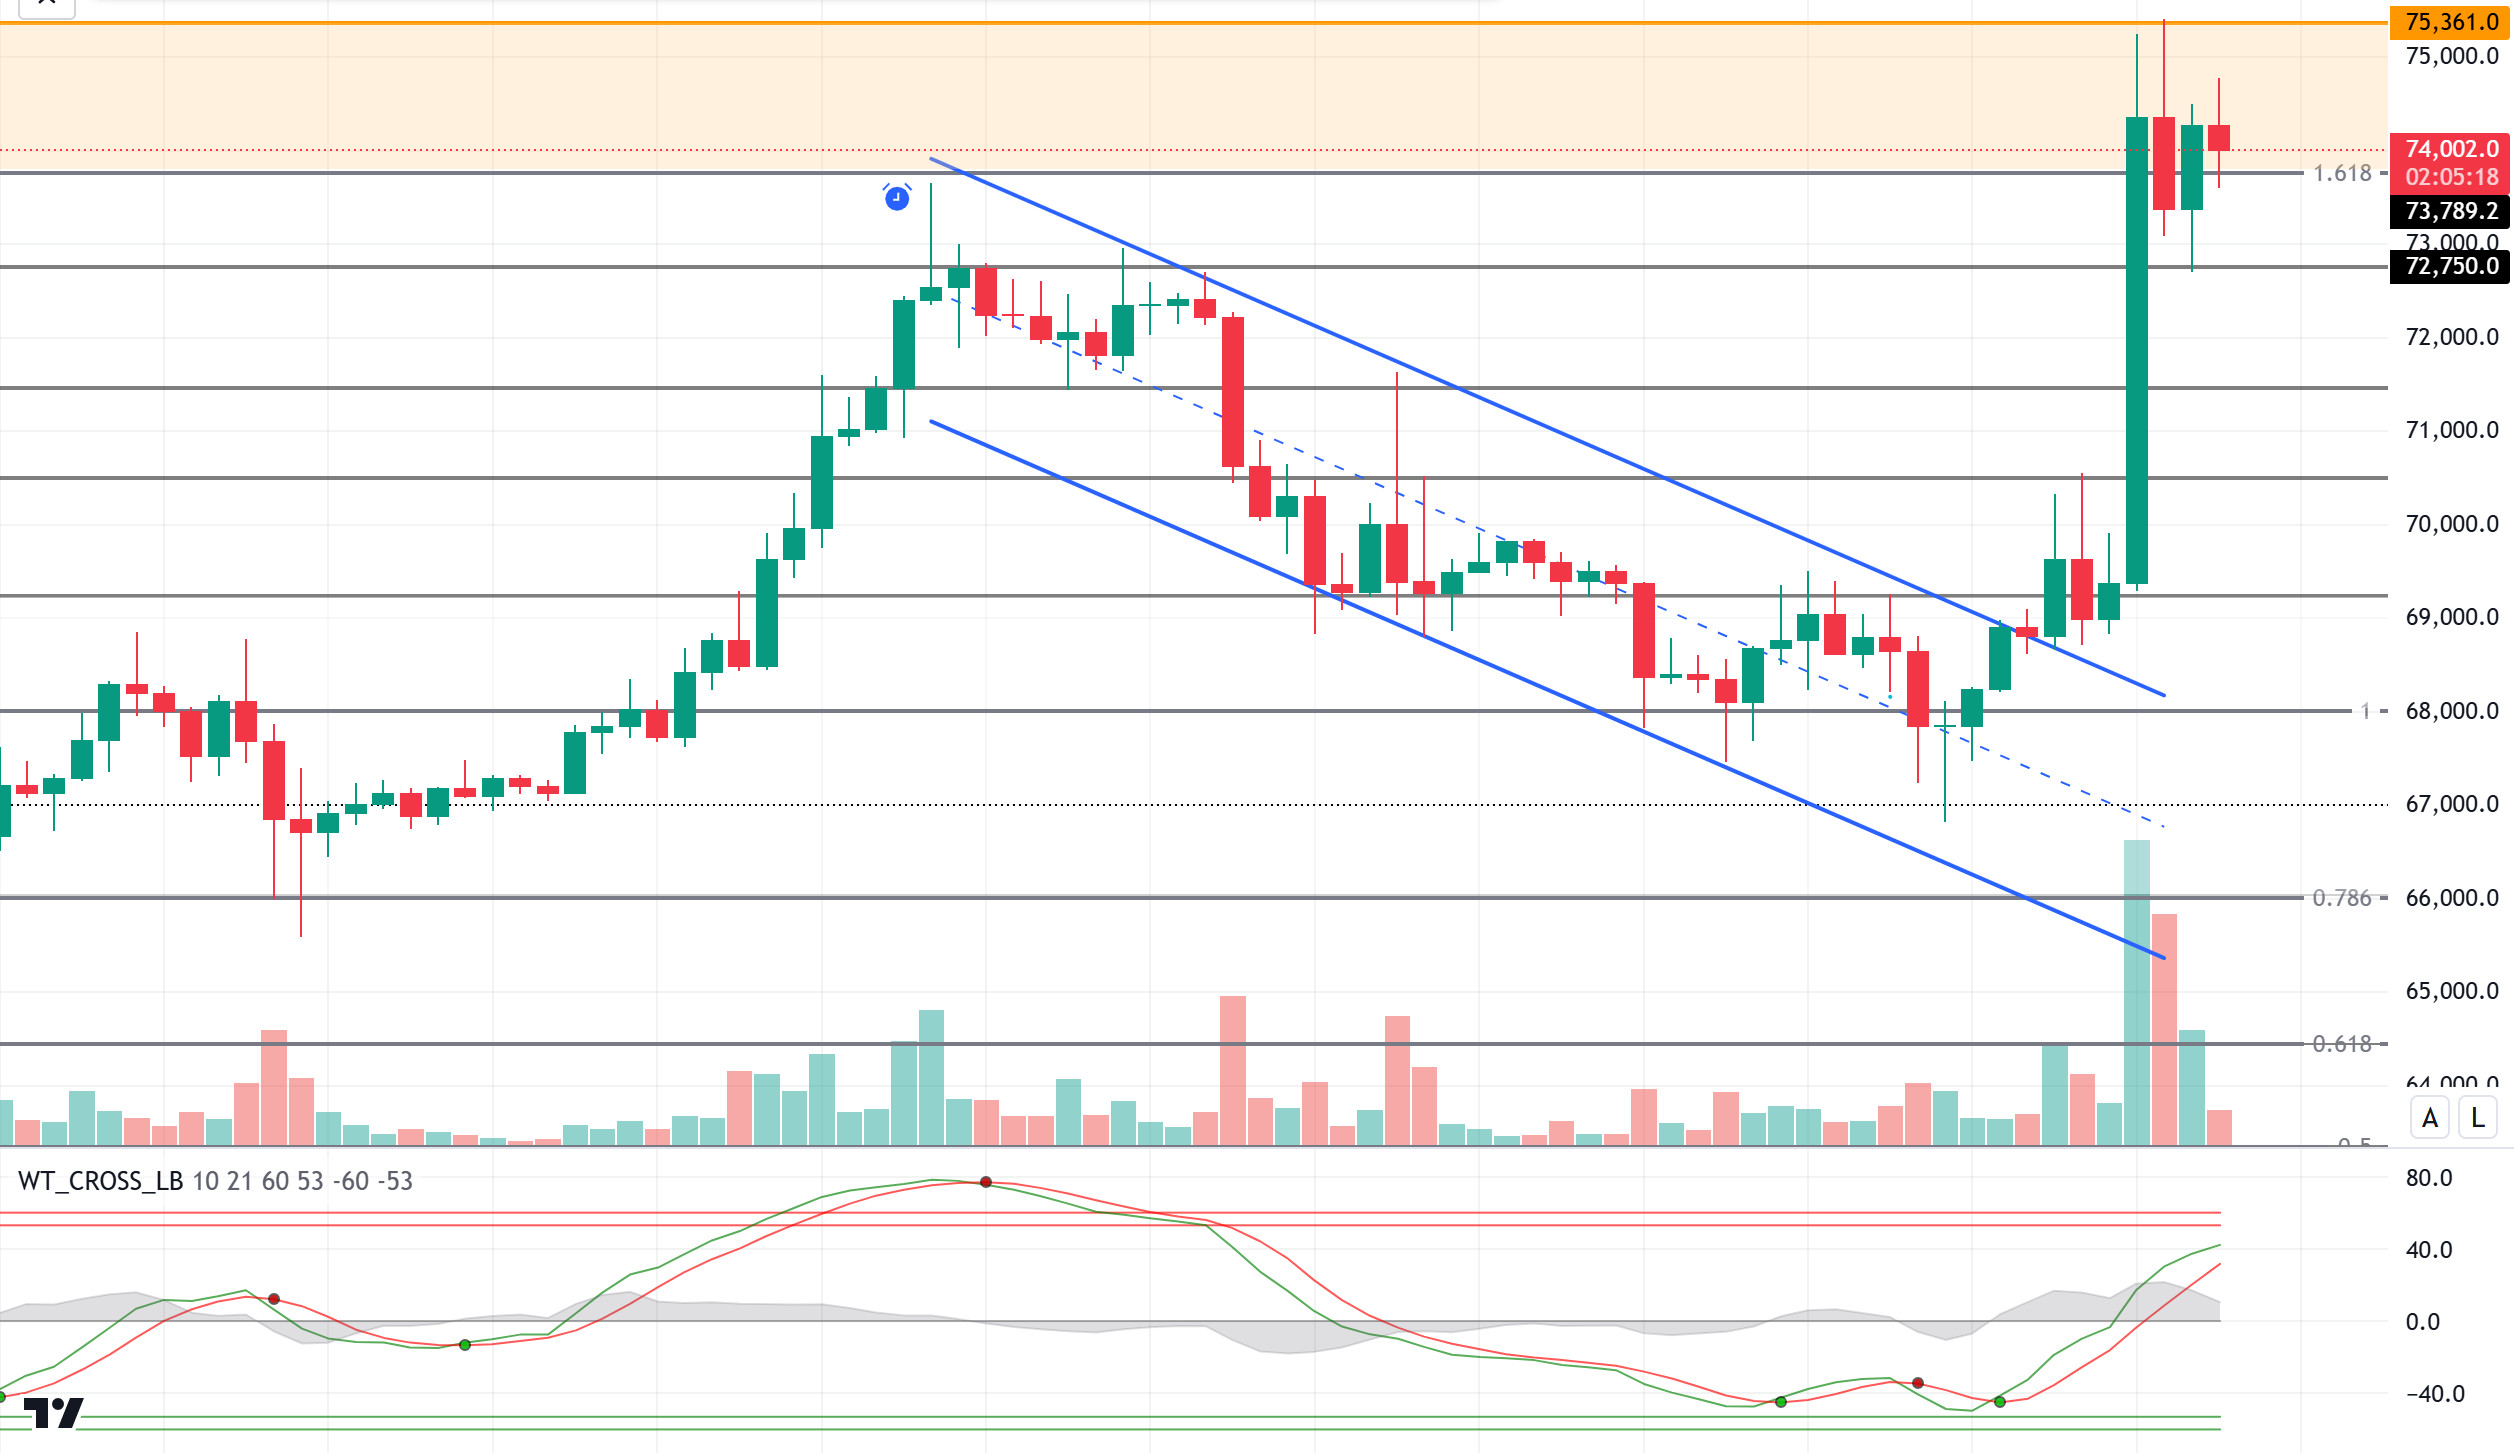
When we look at the BTC technical outlook, it continues to be priced around the ATH level, maintaining the high amount of its gains after the sharp upward movements in its price. In global indices, we see that Europe and the US have a positive outlook, while a negative situation prevails on the Asian side. The statements to be made by President D. Trump, who did not mention BTC in his speech after his election victory, will create volatility on the market. The price holding at Fibonacci 1.618 (73,789), which serves as a support level, may bring a new upside ATH attempt as there is no sell signal yet on the technical oscillator. In addition, the possibility of BTC spot ETFs turning positive after a three-day negative break may support this idea. In a possible profit realization, the support level of 72,750 will be followed.
Supports 73,789 – 72,750 – 71,460
Resistances 75,361- 83,060 – 85,000
ETH/USDT
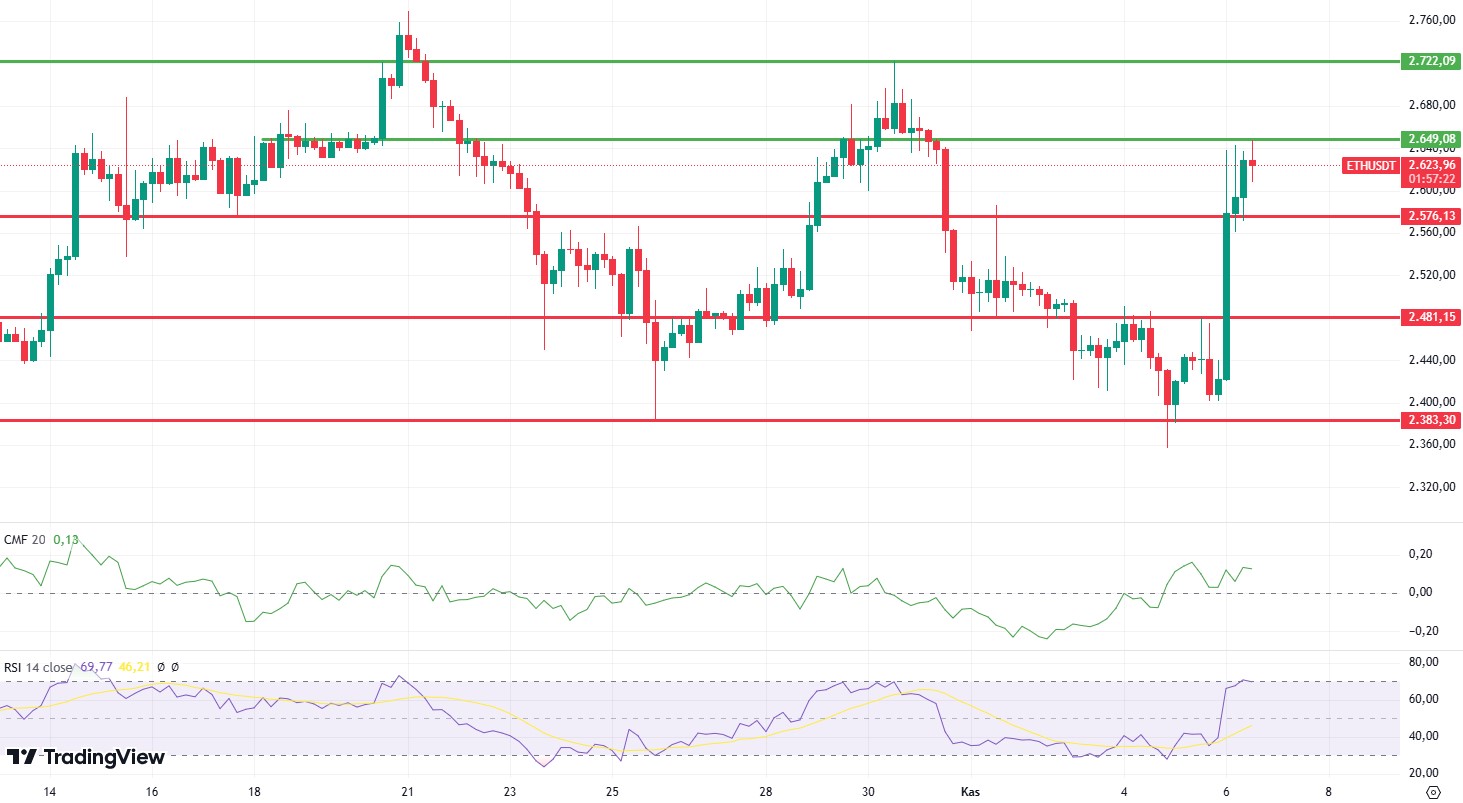
For ETH, which has been on the rise with the election, momentum continues to remain positive. As mentioned in the morning hours, ETH, which managed to stay above the 2,576 level, managed to rise to 2,649, the first resistance point. It experienced some retracement with the reaction it received from here. Relative Strength Index (RSI) has fallen back below 70 after entering the overbought zone. Chaikin Money Flow (CMF) continues to exhibit horizontal movements in the positive area. Looking at the Cumulative Volume Delta (CVD), we see that ETH is spot-weighted bullish. This can be counted as another factor that looks quite positive. In the light of this data, we can see that the rise gains momentum with the break of the 2,649 resistance during the day. The most important support level to be aware of is the 2,576 region, and the break of this level may cause the decline to deepen.
Supports 2,576 – 2,481 – 2,383
Resistances 2,649 – 2,722 – 2,822
LINK/USDT
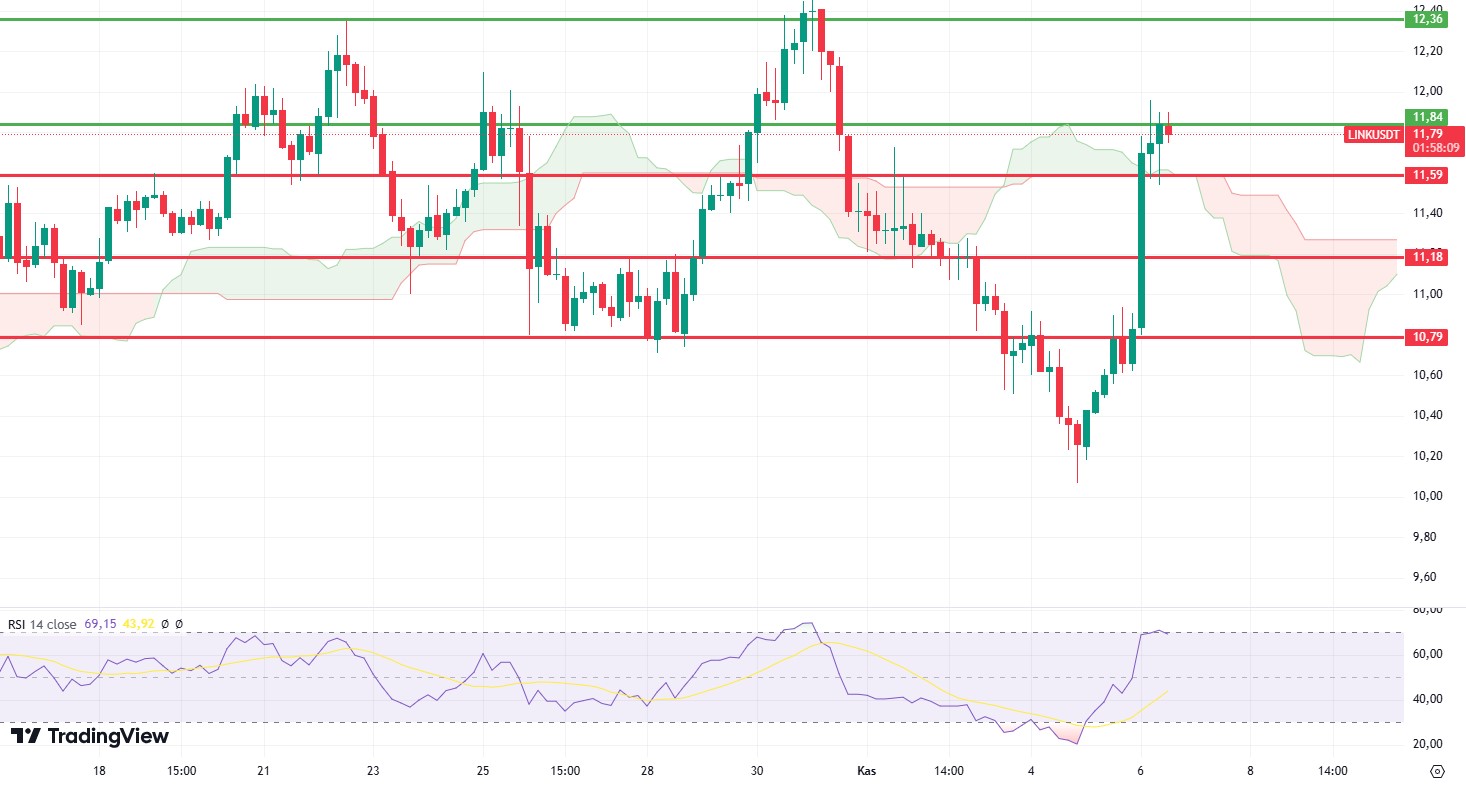
Although LINK tried to break the 11.84 level in the morning hours, it remained below this level and turned the image on the Relative Strength Index (RSI) negative. It can be said that the main uptrend for LINK, which has been moving horizontally in a wide range for a long time, can start when it exceeds the 12.36 level, which it has tried to break many times. Exceeding the 11.84 level during the day may continue the rises towards the 12.36 area. At the same time, the fact that the level of 11.59, which is the kumo cloud level, is the most important support level, may cause the break of this region to bring the correction movement.
Supports 11.59 – 11.18 – 10.79
Resistances 11.84 – 12.36 – 12.98
SOL/USDT
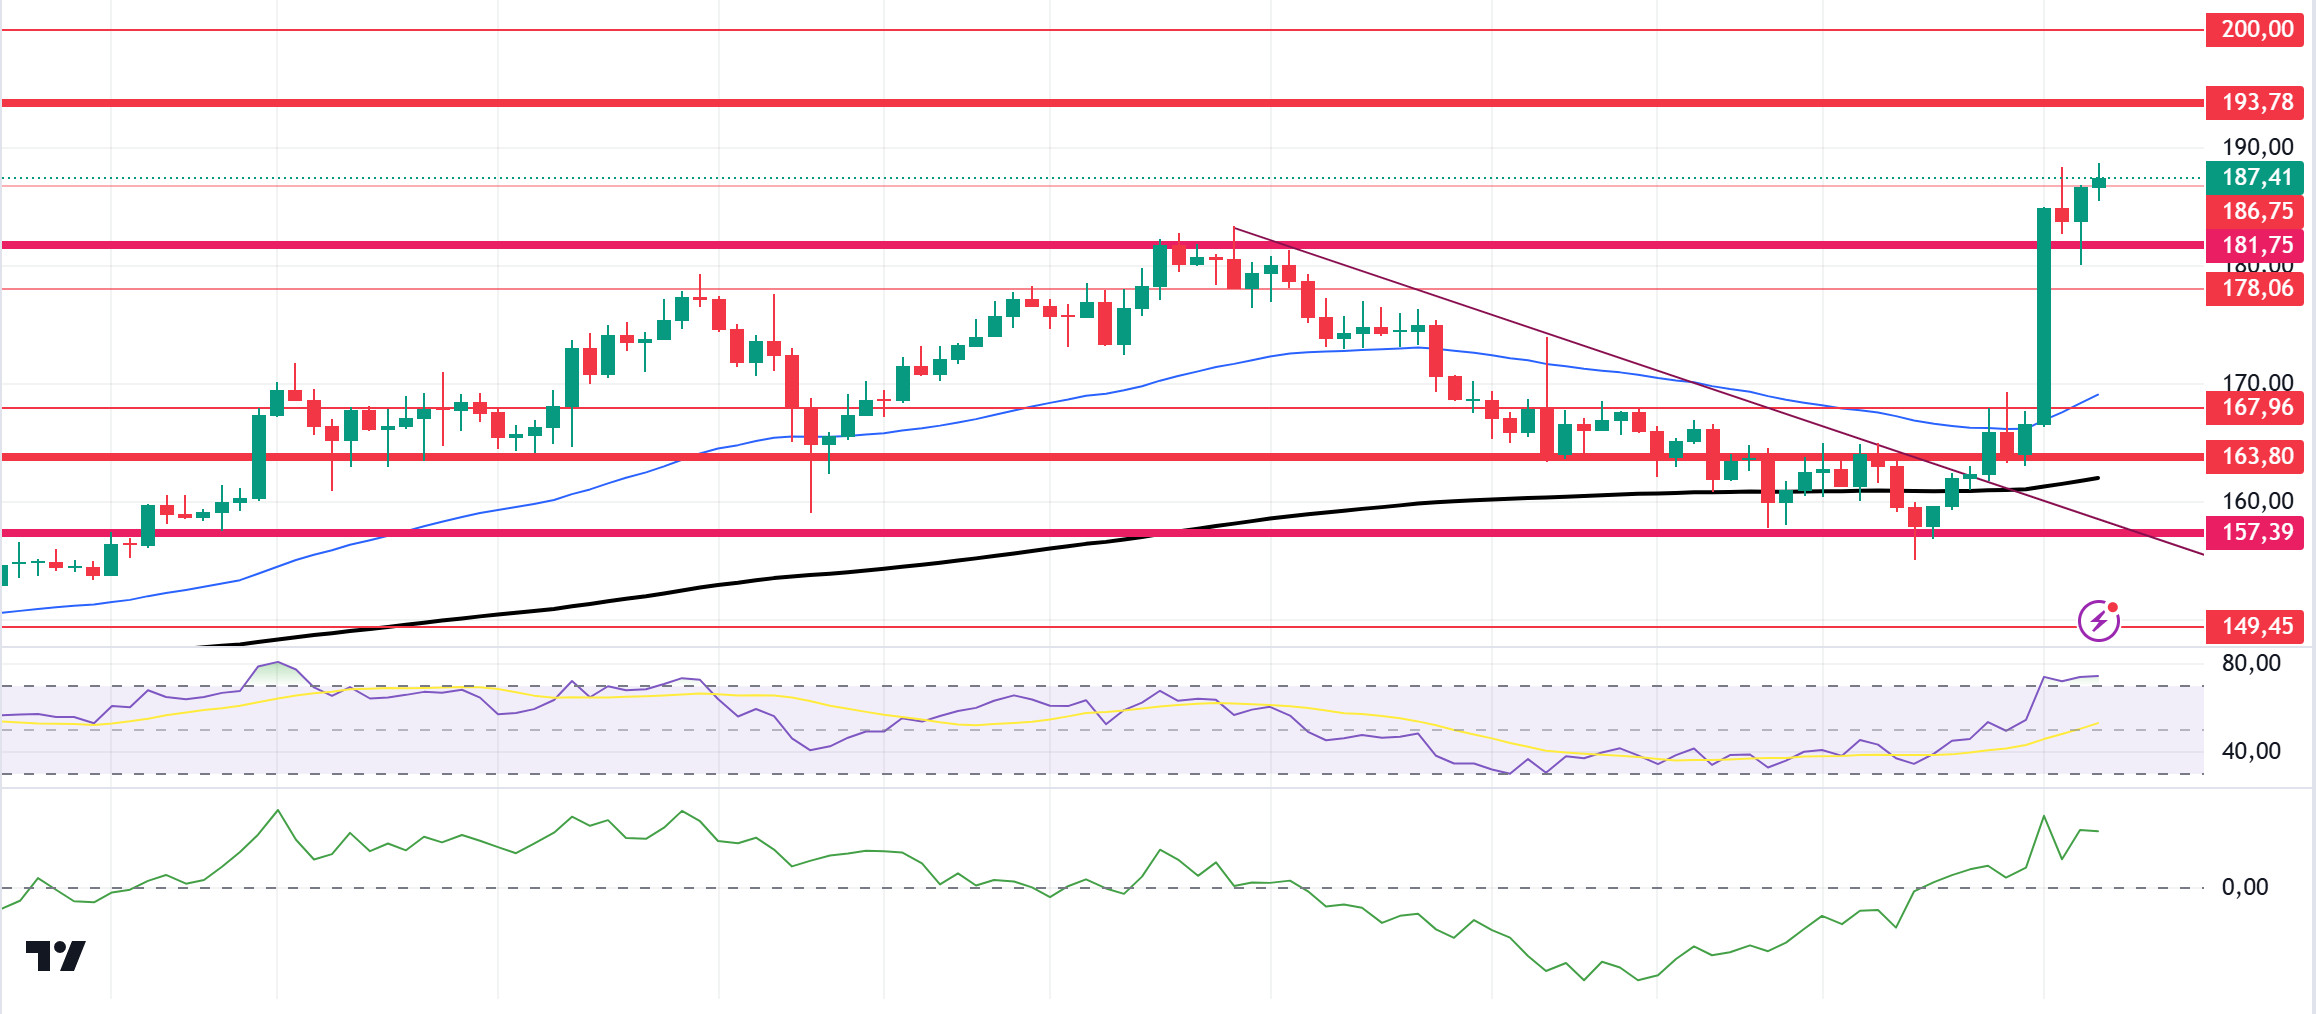
In the US elections, Trump surpassed 270 delegates and became president according to unofficial results. After these results, the cryptocurrency market continued its morning rally. Pro-crypto promises were at the center of Donald Trump’s 2024 campaign, but it remains to be seen what changes the crypto community will face now that Trump is back in office. It’s worth noting that in 2021, Trump expressed a disparaging view of Bitcoin, telling Fox Business that the world’s first cryptocurrency “looks like a scam”. In the Solana ecosystem, NFT outpaced Ethereum in the royalties market, capturing a 51% share. Beyond market dominance, Solana’s success in the NFT sector will increase demand for SOL and support investor confidence. On the other hand, the chain’s TVL increased by over $600 million. When we look technically, SOL strongly broke 181.75, which we call critical resistance, and ran this as a support level. With this move, it moved upwards from the region where it has been consolidating for about 4 months. In the 4-hour timeframe, the 50 EMA (Blue Line) continues to be above the 200 EMA (Black Line). This may mean that the rise will continue. Relative Strength Index (RSI)14 is in the overbought zone, which may bring profit sales. At the same time, when we analyze the Chaikin Money Flow (CMF)20 indicator, we can say that money inflows are very intense. The 193.78 level stands out as a very strong resistance point in the rises driven by both macroeconomic conditions and innovations in the Solana ecosystem. If it rises above this level, the rise may continue strongly. In case of retracements due to possible political reasons or profit sales, the 181.75 support level may be triggered again. If the price hits this support level, momentum may increase and a potential bullish opportunity may arise.
Supports 181.75 – 178.06 – 167.96
Resistances 186.75 – 193.78 – 200.00
ADA/USDT
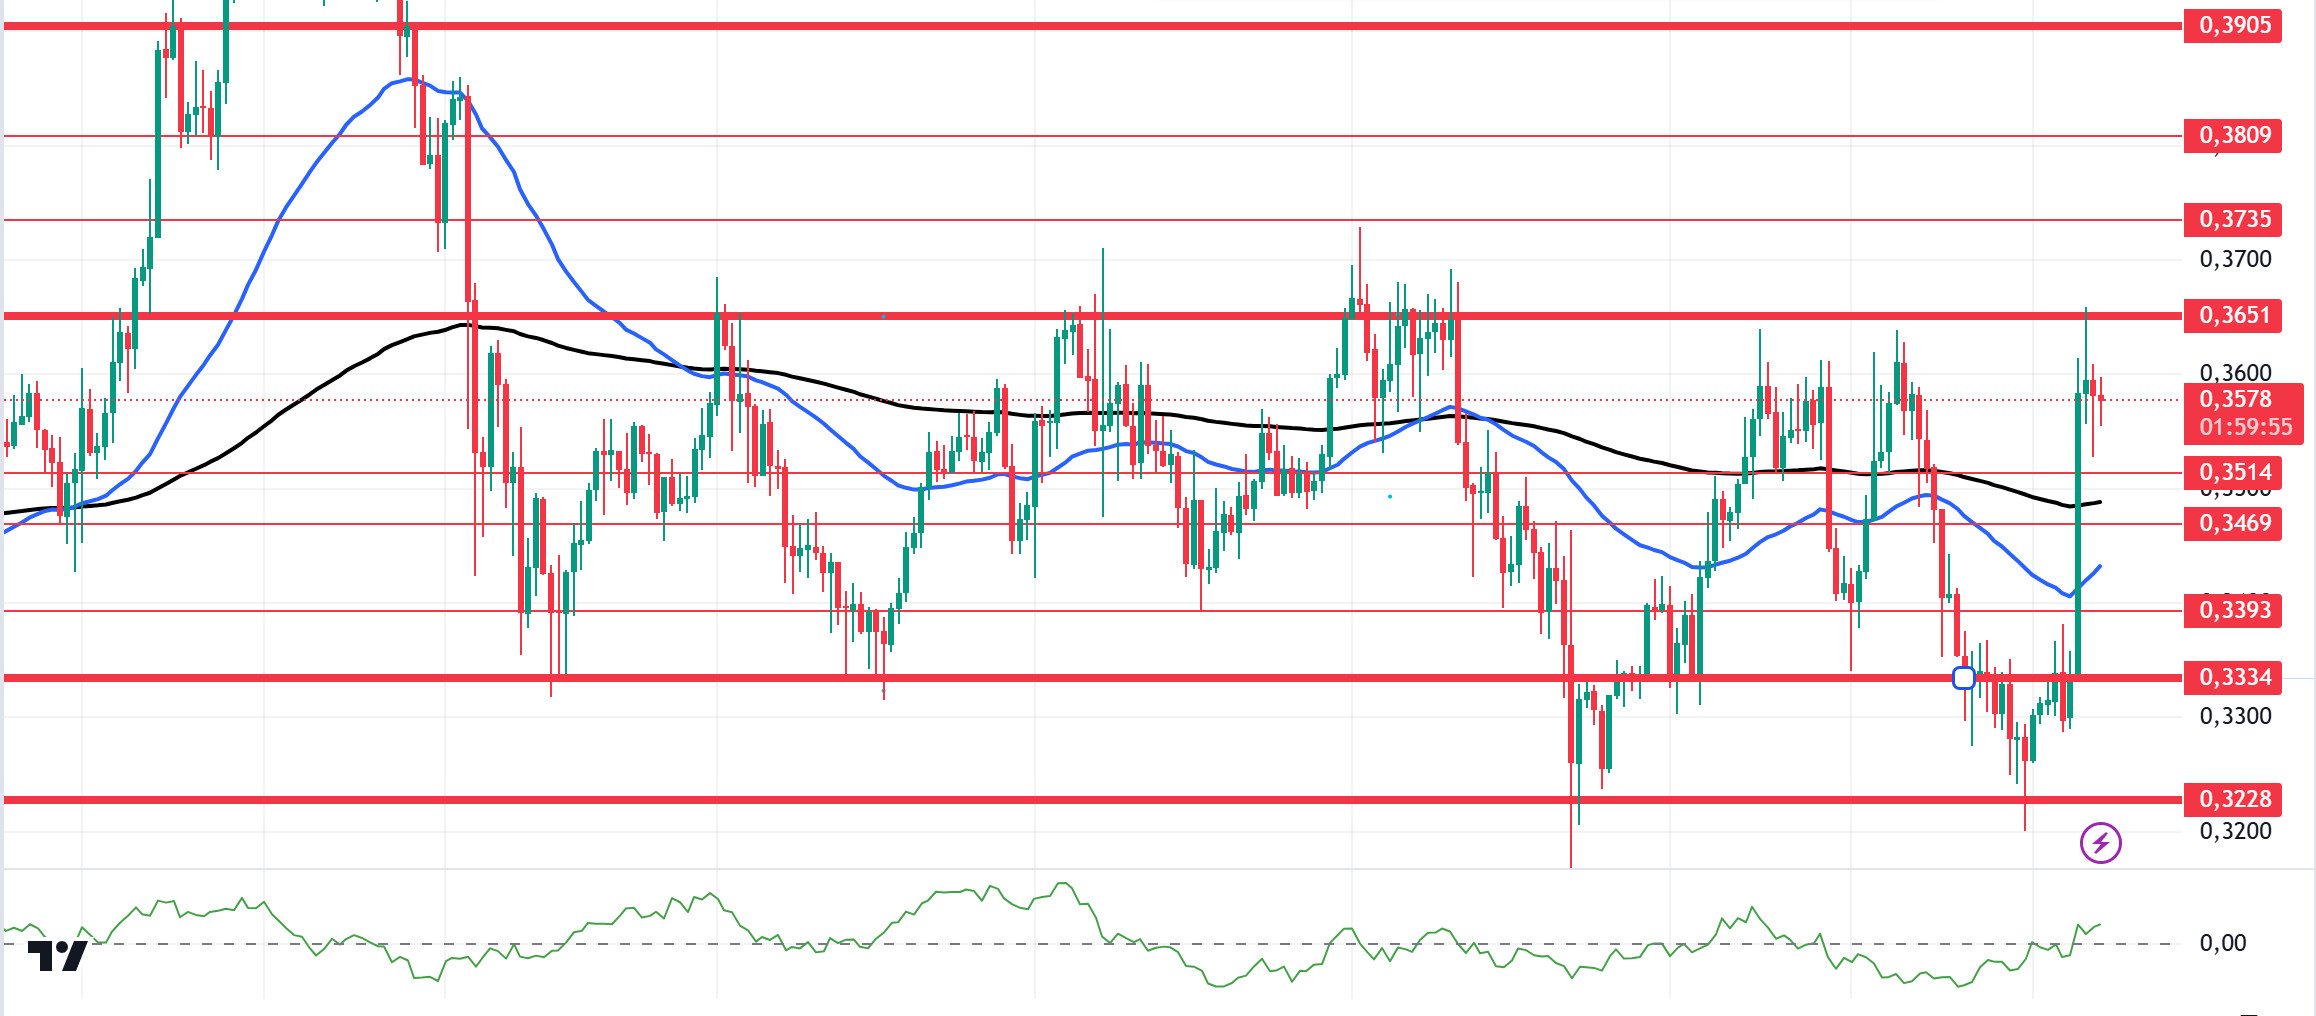
In the US elections, Trump surpassed 270 delegates and became president according to unofficial results. After these results, the cryptocurrency market continued its morning rally. Pro-crypto promises were at the center of Donald Trump’s 2024 campaign, but it remains to be seen what changes the crypto community will face now that Trump is back in office. It’s worth noting that in 2021, Trump expressed a disparaging view of Bitcoin, telling Fox Business that the world’s first cryptocurrency “looks like a scam”. Technically, ADA, which has been accumulating since October 1, is pricing above the 50 EMA (Blue Line) and 200 EMA (Black Line) on the 4-hour chart. However, the 50 EMA continues to hover below the 200 EMA. Although this shows us that the trend is bearish, the convergence of the moving averages shows us that the bearish trend is decreasing. At the same time, when we examine the Chaikin Money Flow (CMF)20 indicator, we can say that money flows are increasing by moving into the positive zone. Considering all this, ADA tested the 0.3651 level once again. The support level of 0.3334 should be followed in the decline that will be experienced due to the macroeconomic data and negativities in the ecosystem or in the retracements brought by profit sales. It may be appropriate to buy when it comes to this price level. In the rises due to macroeconomic data or developments in the ecosystem, the 0.3651 level should be followed. If it breaks this level, the rise may strengthen.
Supports 0.3514 – 0.3469 – 0.3393
Resistances 0.3651 – 0.3735 – 0.3809
AVAX/USDT
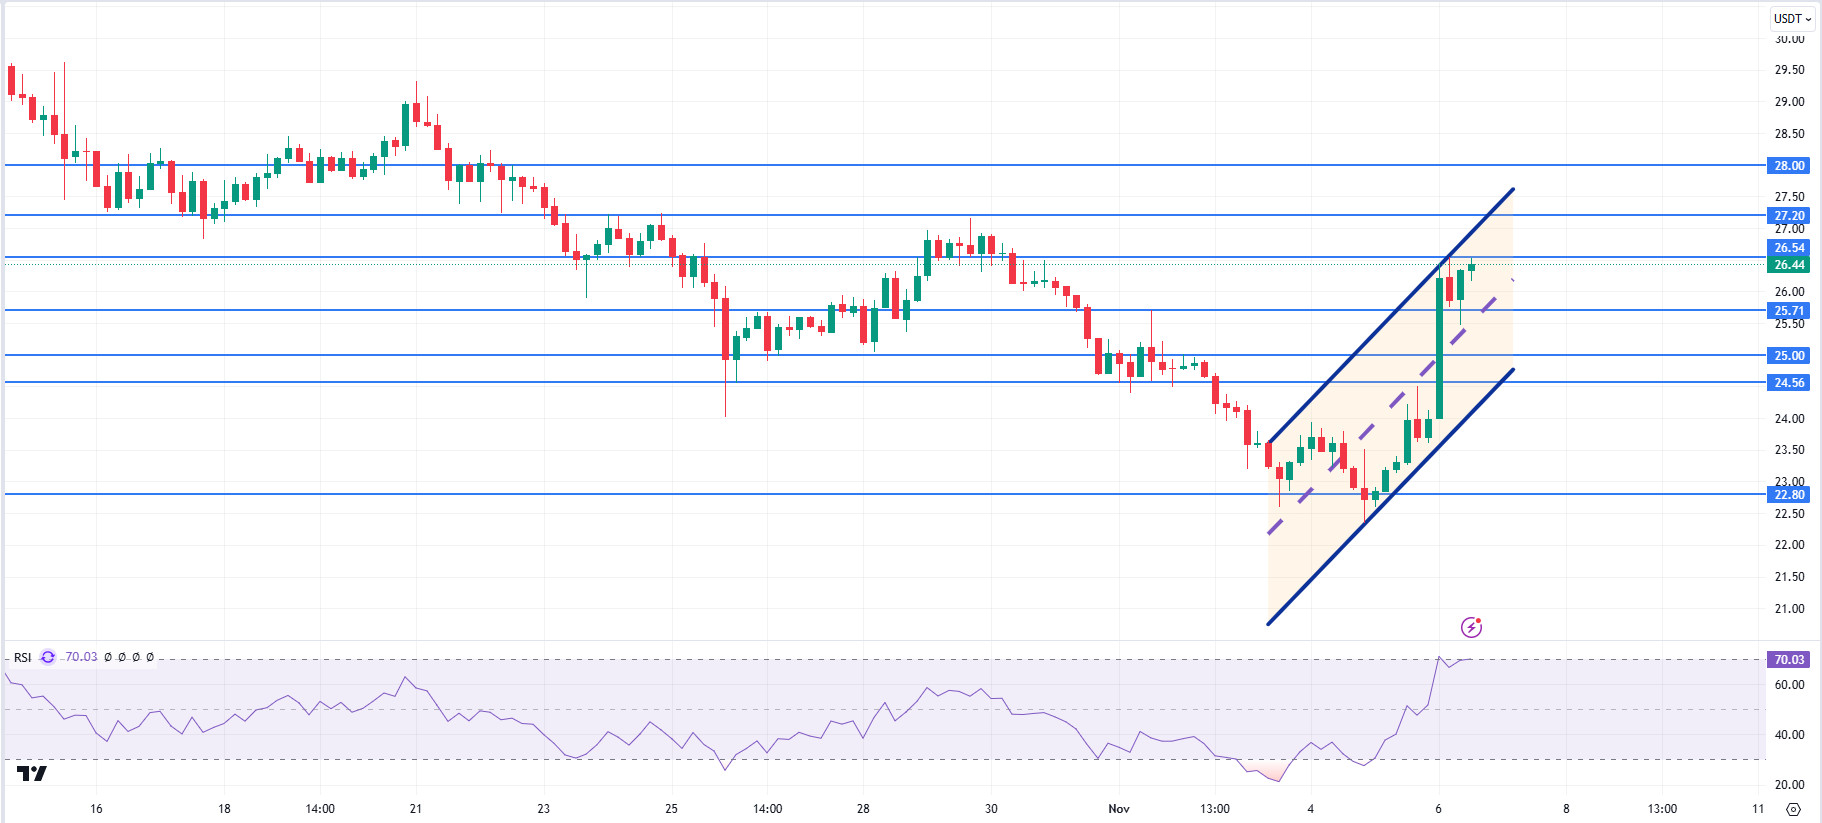
AVAX, which opened today at 24.00, is trading at 26.44, rising about 10% during the day with the finalization of Trump’s victory in the US elections. Volatility can be expected to be high today. News flows from the Middle East will be important for the market.
On the 4-hour chart, the bullish channel is in the upper band and the Relative Strength Index value has reached the overbought level of 70. Some decline can be expected from these levels. In such a case, it may test the supports of 25.71 and 25.00. On the other hand, with Trump mentioning cryptocurrencies in his speeches, the buying reaction by the market may continue. In such a case, it may test the 27.20 and 28.00 resistances. As long as it stays above 22.80 support during the day, the desire to rise may continue. With the break of 22.80 support, sales may increase.
Supports 25.71 – 25.00 – 24.56
Resistances 26.54 – 27.20 – 28.00
TRX/USDT
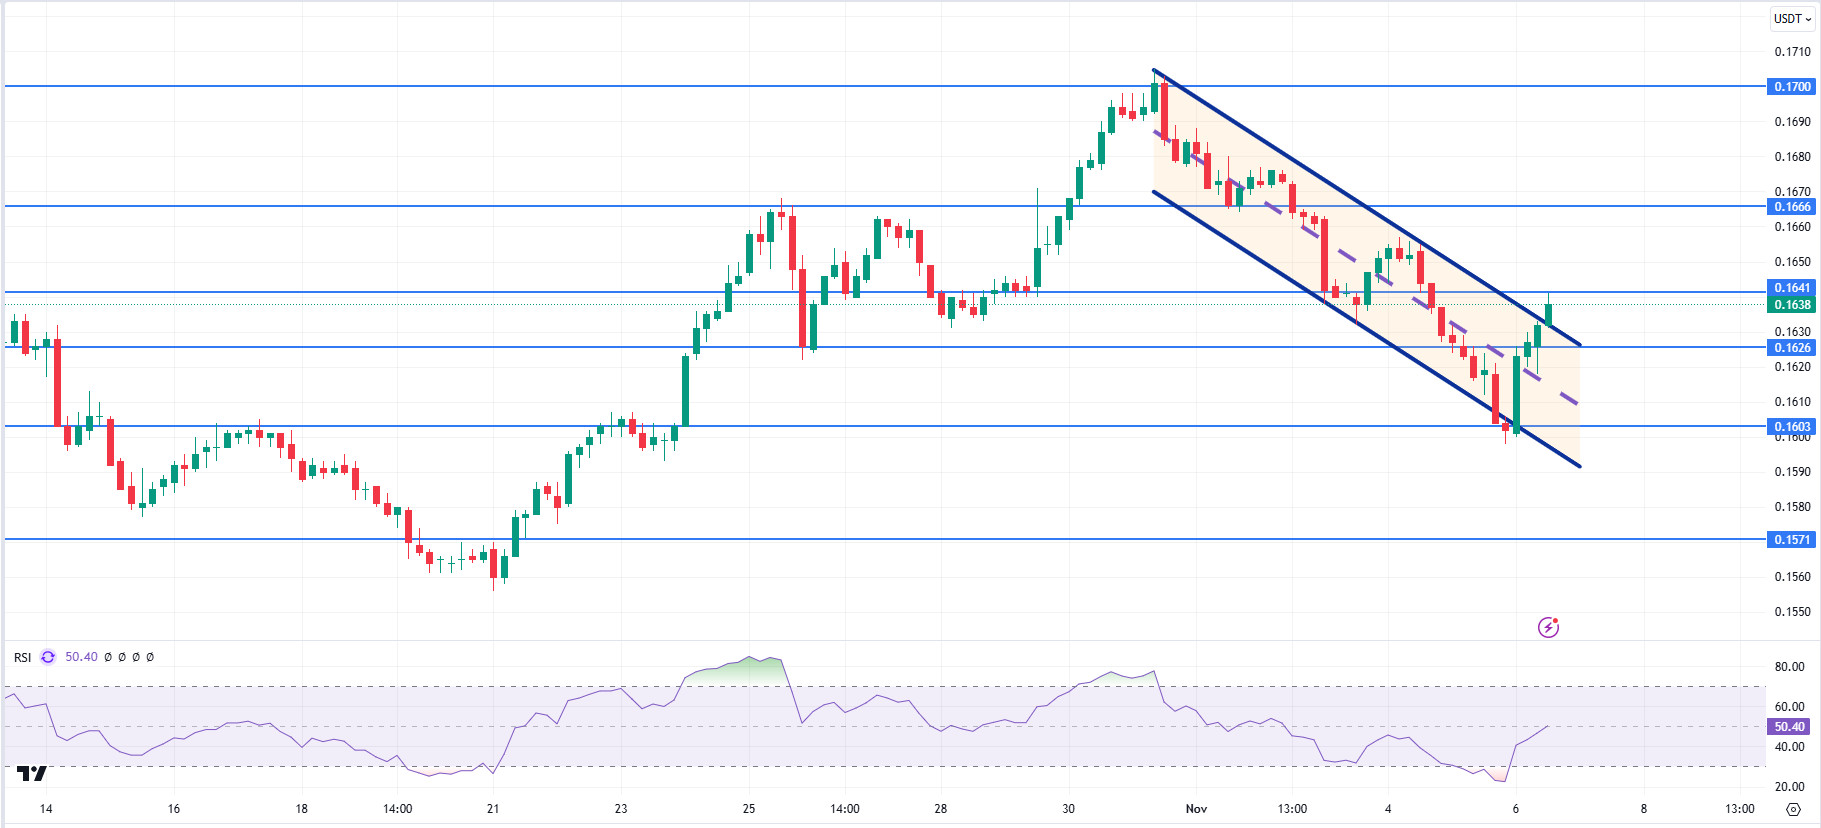
TRX, which started the day at 0.1601, is trading at 0.1638, up about 2.5% during the day. Today, the market will be closely following Trump’s statements and news flows regarding the tension in the Middle East.
TRX is trying to break the upper band of the bearish channel on the 4-hour chart as Trump is certain to win the US presidential election. Relative Strength Index value is 50 and some decline can be expected from the current level. In such a case, it may move to the middle and lower band of the channel and test the support of 0.1626 and 0.1603. However, with the continuation of the buying reaction created by Trump’s win on the market, it may break the upper band of the channel and test the resistance of 0.1666. As long as TRX stays above 0.1482 support, the desire to rise may continue. If this support breaks down, sales can be expected to increase.
Supports 0.1626 – 0.1603 – 0.1571
Resistances 0.1641 – 0.1666 – 0.1700
DOT/USDT
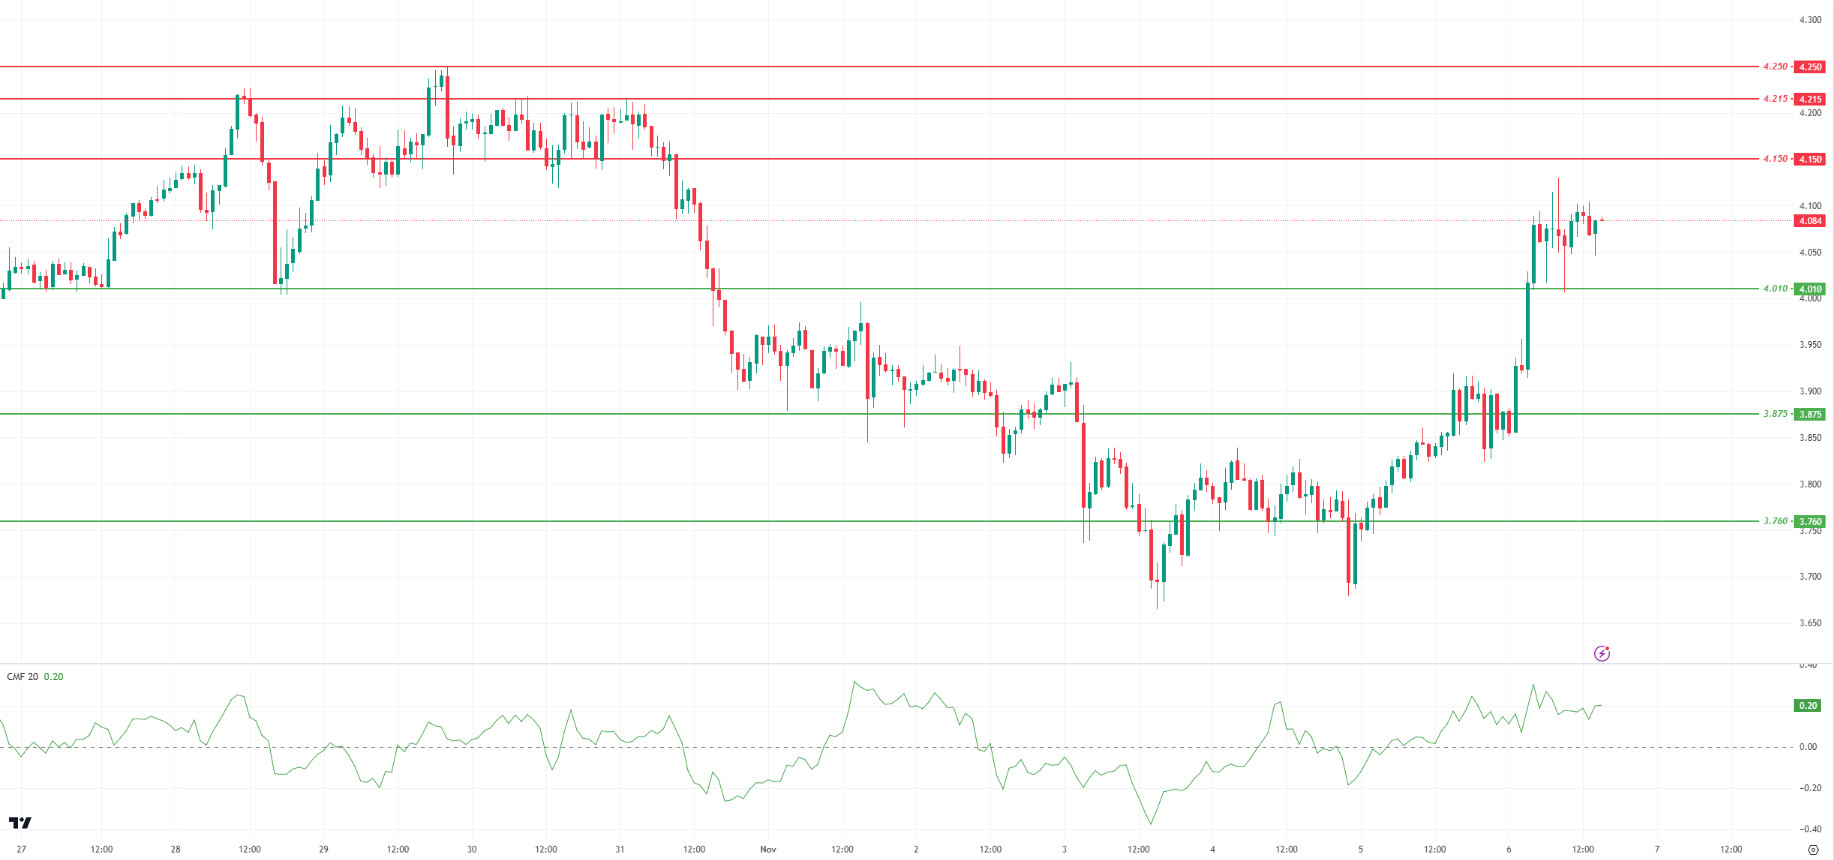
When we examine the Polkadot (DOT) chart, we can say that it was flat after the negative divergence on the price with RSI. With the decrease in volatility after the Presidential elections in the US, DOT managed to stay above $ 4. When we examine the Chaikin Money Flow (CMF) oscillator, we see that the buyer pressure is stronger. As the price stays above the 4,010 support level, it will want to break the selling pressure at the 4,150 resistance level. In the negative scenario, if the selling pressure increases, the price may lose the 4.010 support level and make a correction towards the 3.875 band.
Supports 4.010 – 3.875 – 3.760
Resistances 4.150 – 4.215 – 4.250
SHIB/USDT
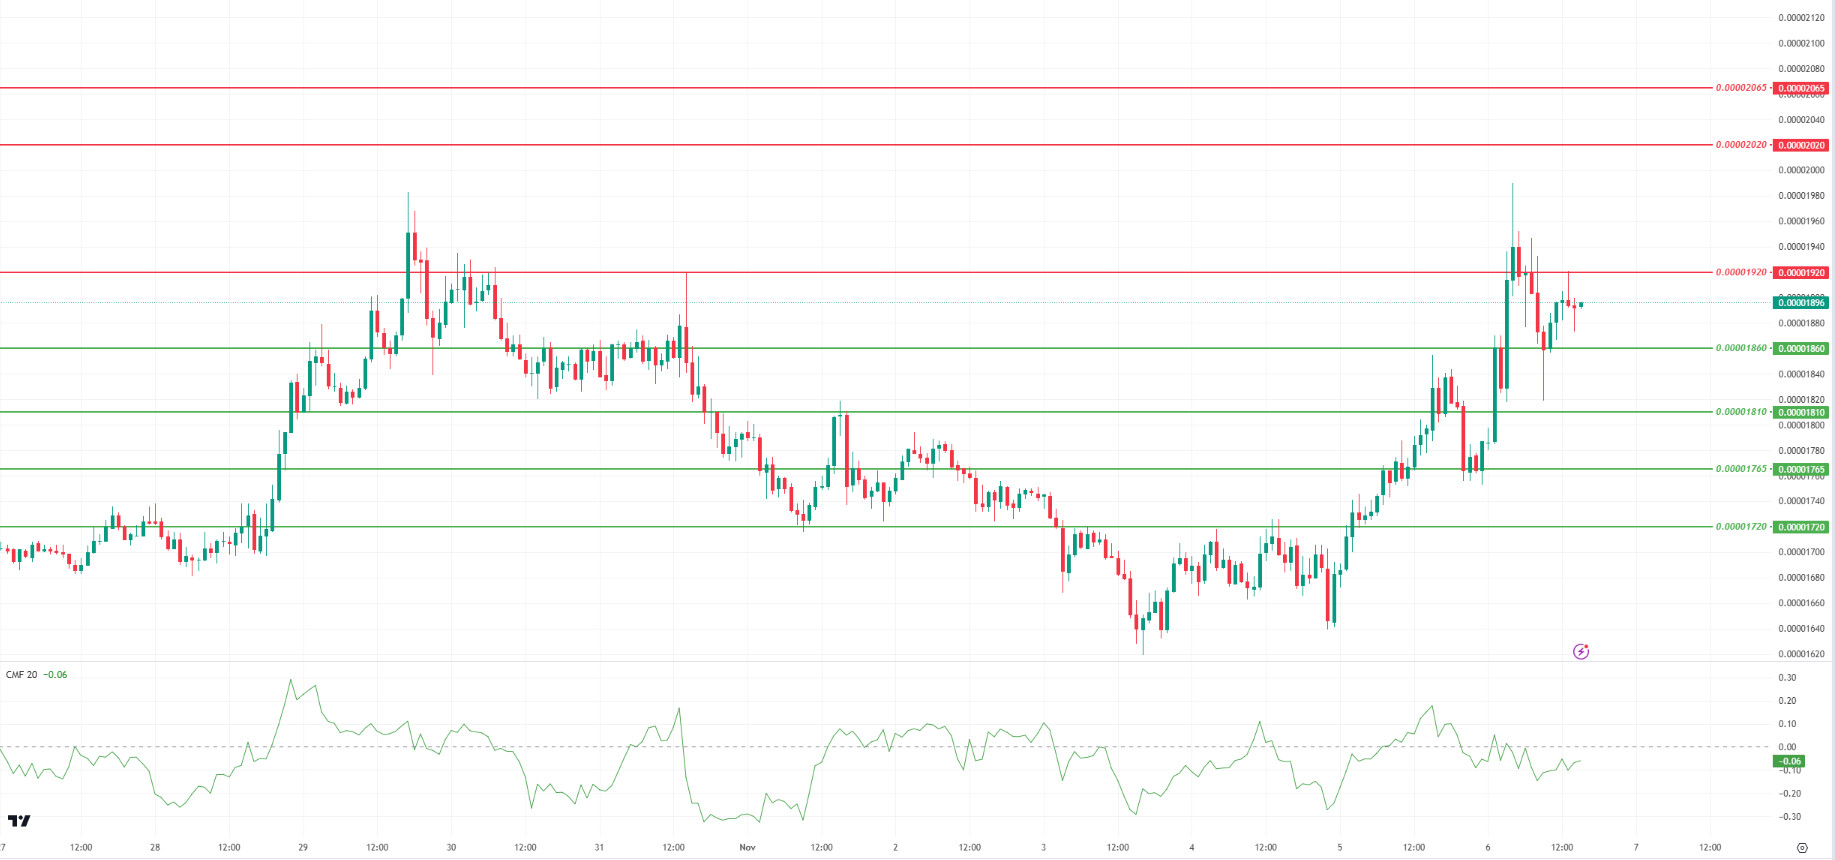
When we examine the chart of Shiba Inu (SHIB), we see that the price was rejected from the 0.00001920 resistance level. Unable to break the selling pressure at the 0.00001920 resistance level, SHIB received a reaction again at 0.00001810 levels. According to the Chaikin Money Flow (CMF) oscillator, we can say that the selling pressure continues. In this context, if the price does not get a reaction from the 0.00001860 support level, it may want to test the 0.00001810 levels again. In the positive scenario, if the price maintains above the 0.00001860 support level, it may want to break the selling pressure at the 0.00001920 resistance level.
Supports 0.00001860 – 0.00001810 – 0.00001765
Resistances 0.00001920 – 0.00002020 – 0.00002065
LEGAL NOTICE
The investment information, comments and recommendations contained herein do not constitute investment advice. Investment advisory services are provided individually by authorized institutions taking into account the risk and return preferences of individuals. The comments and recommendations contained herein are of a general nature. These recommendations may not be suitable for your financial situation and risk and return preferences. Therefore, making an investment decision based solely on the information contained herein may not produce results in line with your expectations.
