MARKET SUMMARY
Latest Situation in Crypto Assets
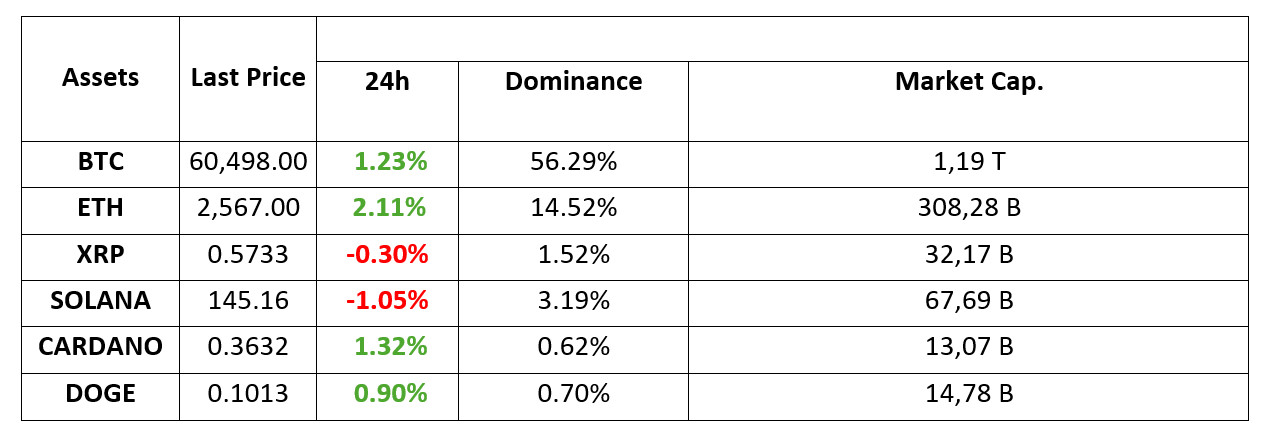
*Prepared on 29.08.2024 at 14:00 (UTC)
WHAT’S LEFT BEHIND
An Important Economic Data Release in the US!
The United States of America (USA), the world’s largest economy, is on the agenda of traditional financial markets and the cryptocurrency industry. Statements and data from the US can affect the price movements of crypto assets.
In the past minutes, some critical data such as GDP in the US, which the FED is also following, were announced. Here are the latest important economic data released in the US:
US Gross Domestic Product (GDP): Previous: 1.4% Expected: 2.8% Announced: 3.0%
US Applications for Unemployment Benefits: Previous: 233 thousand Expectation: 232 thousand Expected: 231 thousand
US Spot Ethereum Exchange Traded Funds (ETFs) End 9-Day Exit Streak!
Spot Ethereum exchange-traded funds (ETFs) in the US ended a nine-day downtrend with net inflows of $5.84 million on Wednesday. Data from Soso Value reveals that the Grayscale Ethereum Trust (ETHE) experienced daily net outflows of $3.81 million, but this was more than offset by inflows into other funds.
Stacks Introduces Nakamoto Update to Improve Bitcoin Transactions with Layer-2 Blockchain
Stacks, a layer-2 blockchain that improves the Bitcoin network, launched the Nakamoto upgrade aimed at increasing transaction speeds.
Cardano Blockchain Prepares for Chang Hard Fork
Cardano, launched in 2017 by Ethereum co-founder Charles Hoskinson, is preparing for an upgrade that will make major changes to the structure of its main network and provide mechanisms for users to participate in on-chain governance. The “Chang hard fork”, which will be the biggest upgrade in two years, has an important place on Cardano’s roadmap. Originally set to take place this week, the hard fork was postponed until September 1st to allow some exchanges, including Binance, to prepare their systems.
HIGHLIGHTS OF THE DAY

INFORMATION
*The calendar is based on UTC (Coordinated Universal Time) time zone. The economic calendar content on the relevant page is obtained from reliable news and data providers. The news in the economic calendar content, the date and time of the announcement of the news, possible changes in the previous, expectations and announced figures are made by the data provider institutions. Darkex cannot be held responsible for possible changes that may arise from similar situations.
MARKET COMPASS
The bad mood following Nvidia’s future projections, which failed to impress investors, had the opportunity to dissipate a bit during the European session today. Expectations that the ECB (European Central Bank) was a little closer to cutting interest rates as inflation rates in European countries with large economies remained below forecasts played a role in the rise of the indices. On the other hand, the upward revision of the data on the growth of the US economy in the second quarter made the possibility of a recession more remote. US indices are expected to start the new day on a bullish note. Unemplpyment Claims, on the other hand, pointed to a data very close to the market forecast.
During yesterday’s European trades, digital assets limited their previous declines and rallied, and today’s European trades showed a similar outlook. Still, we are far from being able to say that this appetite is strong. Tomorrow, the PCE Price Index for the US will be released, and it will be important whether the US Federal Reserve will give a clue that will strengthen the interest rate cut course. On the other hand, despite the reopening of the TON blockchain after its second outage, the crypto asset is still far from recovering its losses following the arrest of Telegram founder Durov. The good news is that ETH ETFs have seen positive flows after nine days of outflows.
In addition to news specific to the digital asset world, macro variables and expectations regarding monetary policy continue to influence the direction of prices. Therefore, especially the data coming from the US and the news flows and speeches regarding the FED’s policy change will continue to be closely monitored.
TECHNICAL ANALYSIS
BTC/USDT
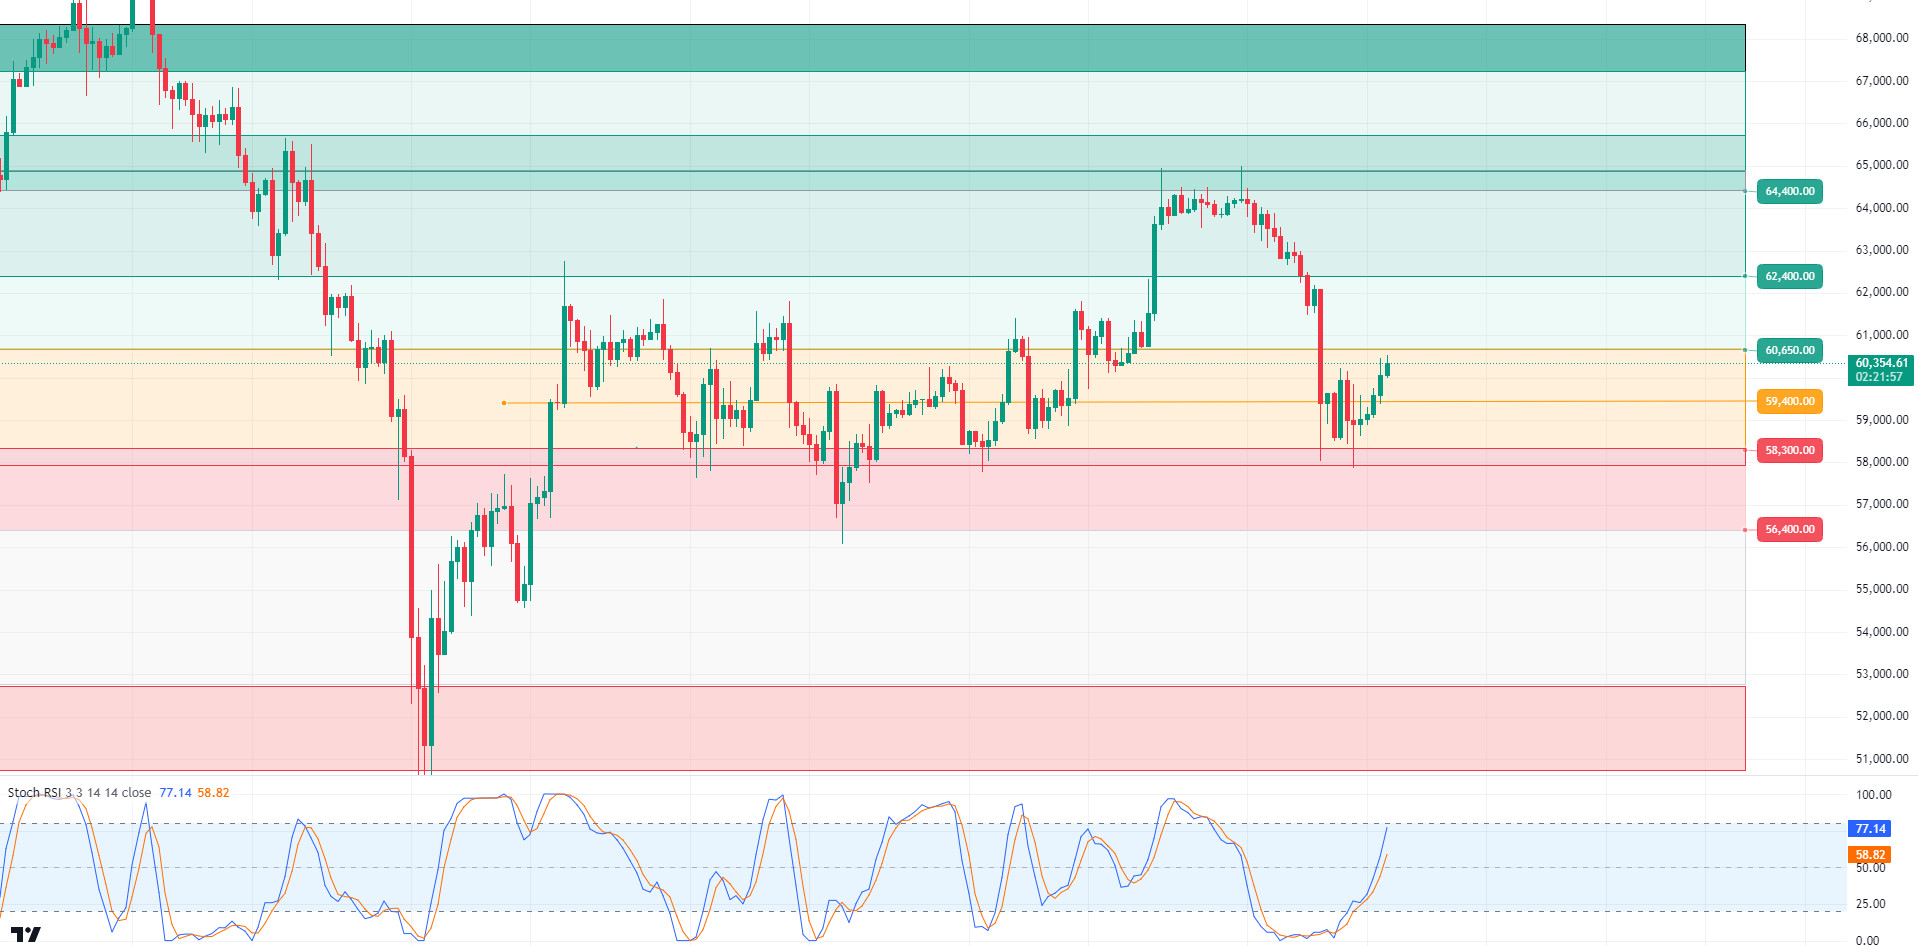
There is movement in Bitcoin! An upward momentum was observed in Bitcoin ahead of the Gross Domestic Product (GDP) data announced in the US. The subsequent GDP data, which came in above expectations, may have boosted investor confidence and could be interpreted as having a positive impact on financial markets. This growth in the US economy could alleviate recession concerns, which could affect the future course of interest rates. On the other hand, the ongoing developments regarding Telegram CEO Pavel Durov reveal how external factors can affect market dynamics. Looking at the BTC 4-hour technical analysis chart, we observed a movement towards the psychological resistance zone of 60,000. After this stage, waiting for the price to consolidate in this region for a while may increase the upward momentum. Otherwise, it may be possible for BTC to test the 59,400-support level again with selling pressure. The fact that the RSI, our technical indicator, has not yet reached the overbought zone may indicate that there is some more upside potential in the short term.
Supports 59,400 – 58,300 – 56,400
Resistances 60,650 – 61,700 – 62,400
ETH/USDT
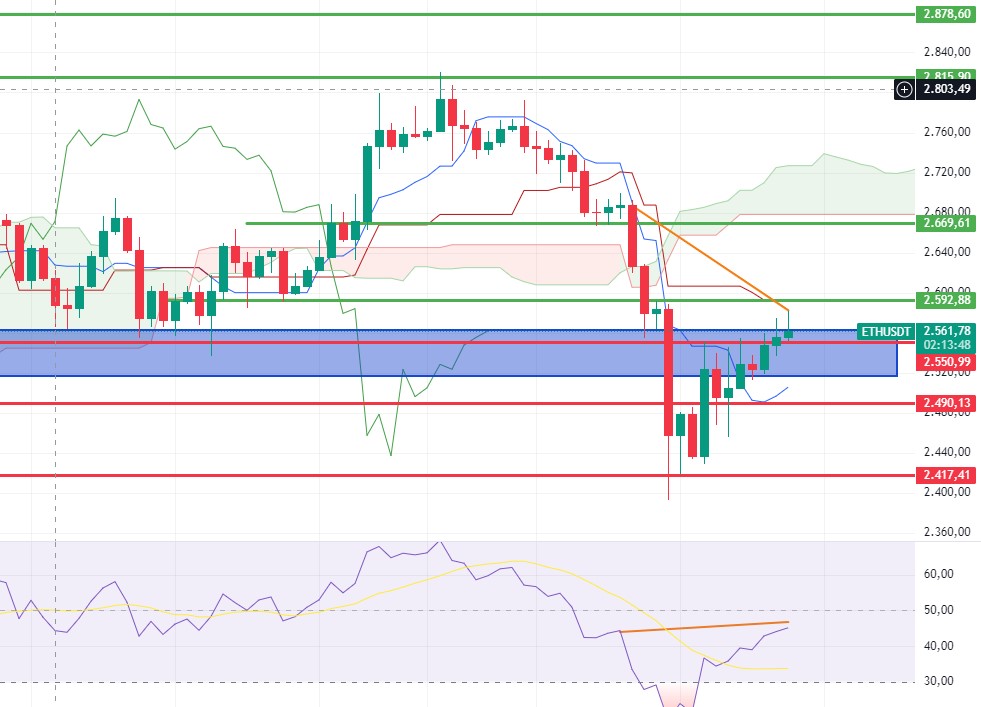
Breaking the 2,550 resistance in volume, Ethereum continues its bullish structure. If the 2,592 tenkan resistance can be broken in the short term, rises up to 2,669 levels seem possible. However, a negative mismatch is noticeable on the RSI. Unless a voluminous breakout comes, a retest to 2,550 levels may come. Accumulating between 2,592 – 2,550 levels and breaking the mismatch may paint a better picture for the rises. Closures below 2,550 may disrupt the structure and cause pullbacks to 2,490 levels. Spot purchases on Coinbase and Binance are also noteworthy and show us that the price is not inflated from the term. In the US economic data released today, gross domestic product and unemployment benefit applications coming above expectations can be seen as reasons that can strengthen the positive structure.
Supports 2,592 – 2,669 – 2,815
Resistances 2,550 – 2,490 – 2,417
LINK/USDT
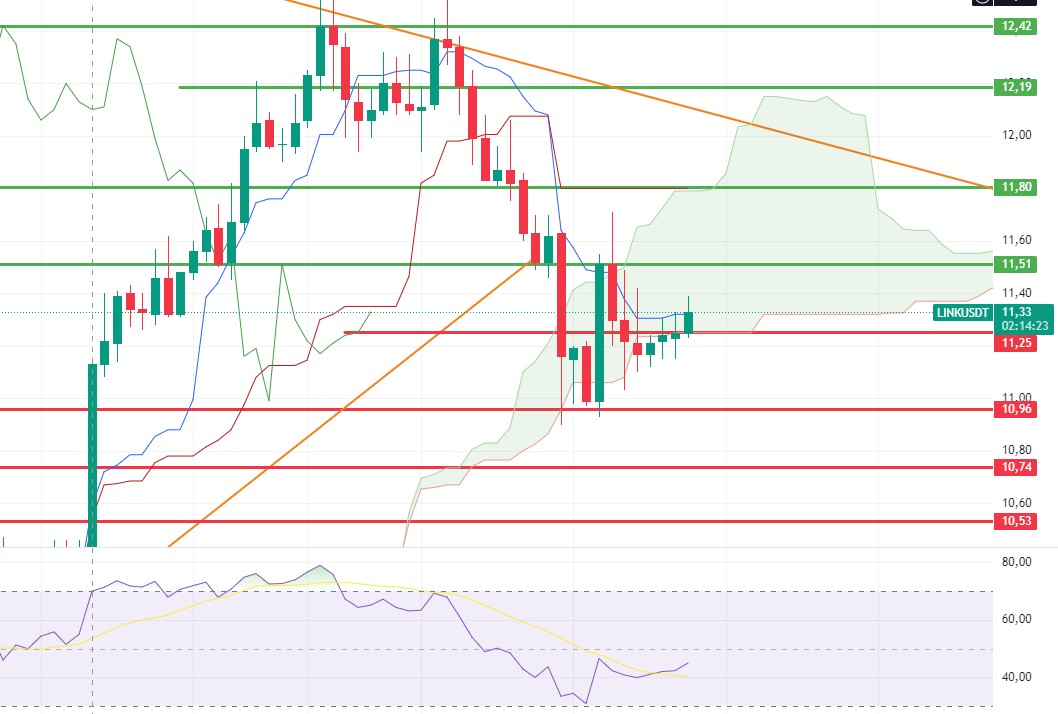
The 11.25 cloud resistance set for LINK seems to have broken. The re-entry into the Kumo cloud and the bullish outlook in Ethereum may enable it to test 11.80 levels after 11.51. Closures below 11.25 may cause a retreat to 10.96 levels.
Supports 11.25- 10.96 – 10.74
Resistances 11.51 – 11.80 – 11.19
SOL/USDT
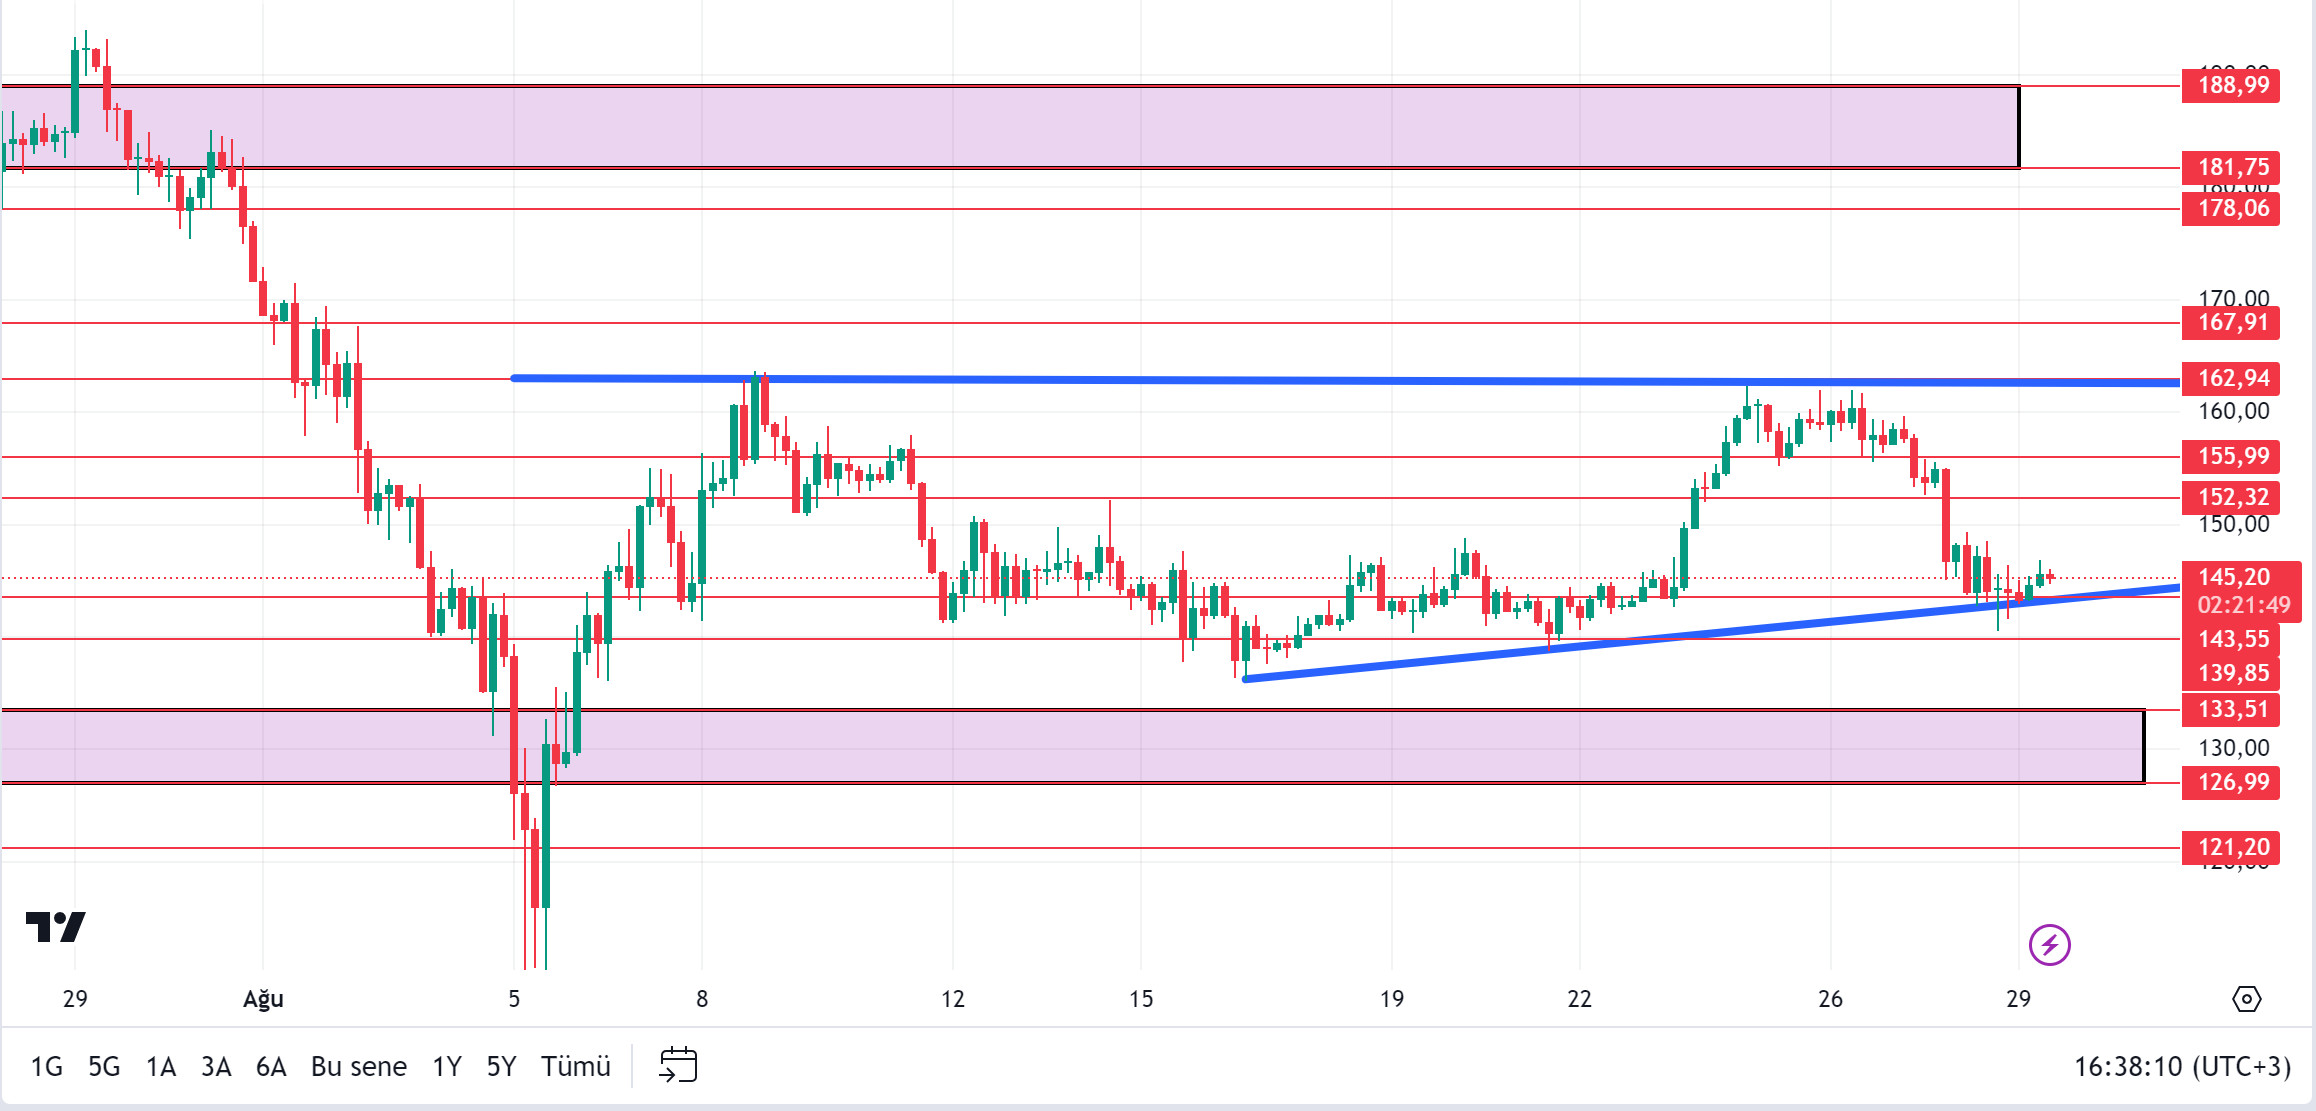
GDP data from the US came in above expectations. This can be interpreted as a supportive factor in the rise of cryptocurrencies. In Solana, the memecoin fury continues. According to Lookonchain data, a famous soccer player’s x account was hacked, and the token contract was shared. An investor who instantly invested in this made a 1 million dollar transaction with 7,156 SOL. The investor who fell victim to a bad actor now has only $9,000 left. This kind of activity continues to damage the Solana ecosystem. Most recently, the McDonalds account was hacked, and such an incident occurred. According to the data from the defilement platform, the outflow of money in the Solana ecosystem has reached 5.5 million dollars in the last 24 hours. According to Dune Analytics data, the Solana-based prediction market BET has set a new record of $20 million in daily volume. Looking at the chart, SOL is at the bottom of the ascending triangle pattern. If it continues to hold from here, the rise may continue and test the resistance levels of 152.32 – 155.99. If the fear in the market continues, the support of the ascending triangle pattern may break and cause an increase in selling pressure. In this scenario, 143.55 – 139.85 supports should be followed.
Supports 143.55 – 139.85 – 133.51
Resistances 152.32 – 155.99 – 162.94
ADA/USDT
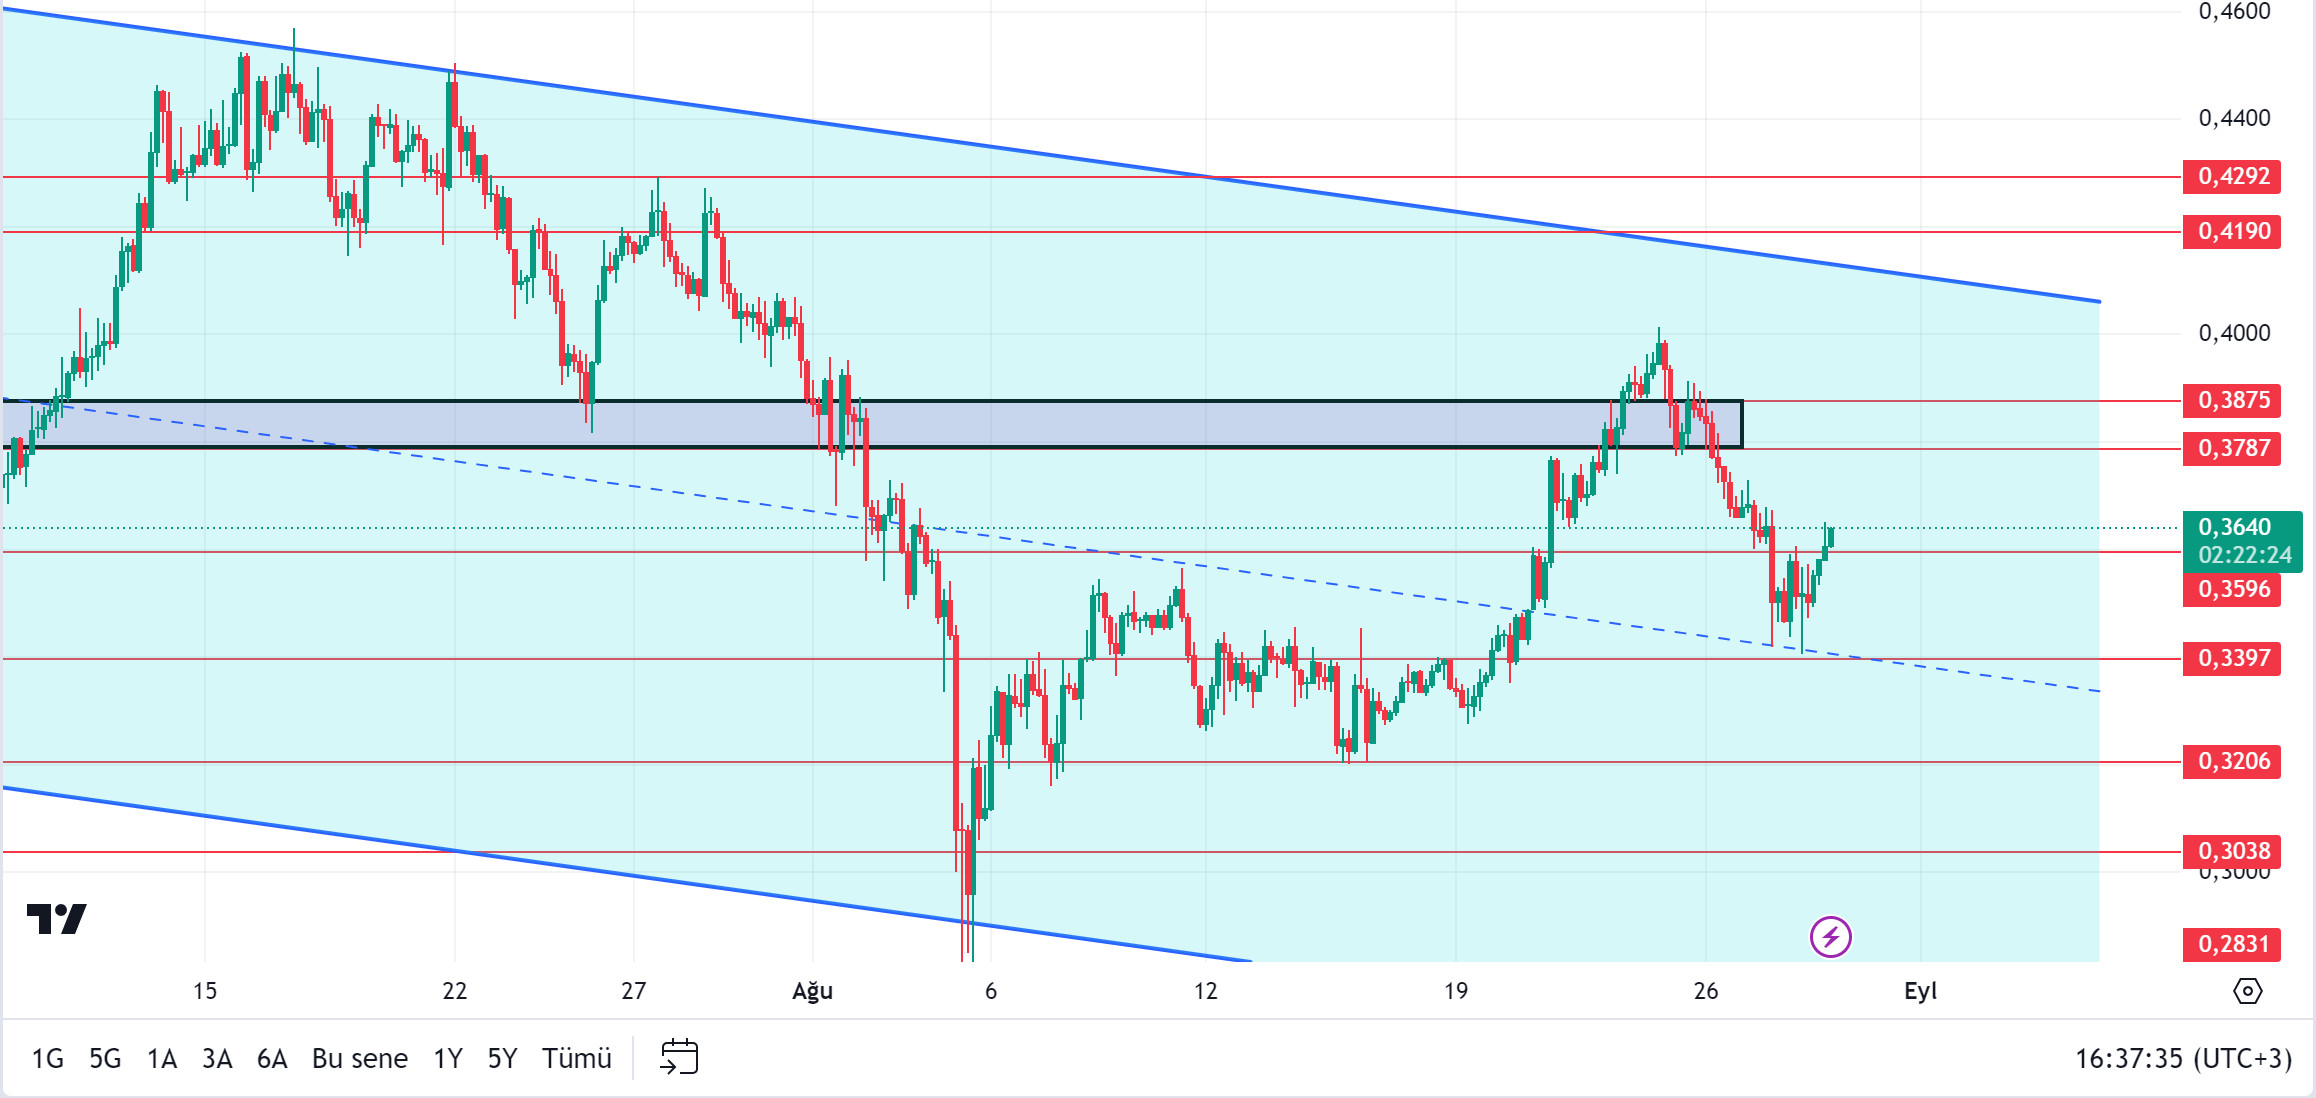
In the afternoon, data from Lookonchain showed that a whale bought $1,000BTC ($59.65 million) from the bottom. It now holds $7,559BTC ($450 million) in its wallet. In the Cardano ecosystem, the community will be authorized in treasury funds with the upcoming first phase of the Chang hard fork. It was stated that treasury funds are limited and it is important to create a strategic spending plan. On the other hand, another suggestion is to direct 20% of the treasury funds to BTC purchase. While those who support this proposal argue that Bitcoin can add stability to the altcoin Cardano, investors with a tighter risk threshold point to stablecoins. One of the biggest upgrades on the Cardano network is coming in the next three days. The big day is September 1st. It will bring new features and complete the blockchain’s transition to a community-managed network. When we look at the chart of ADA which is supported by the middle level of the descending channel, is priced at 0.3640. With the continued rise, 0.3787 – 0.3875 levels can be followed as resistance levels. In the scenario where investors anticipate BTC’s selling pressure to continue, albeit short-term, if it continues to be priced in the descending channel, 0.3596 – 0.3397 levels can be followed as support.
Supports 0.3596 – 0.3397 – 0.3206
Resistances 0.3787 – 0.3875 – 0.4190
AVAX/USDT
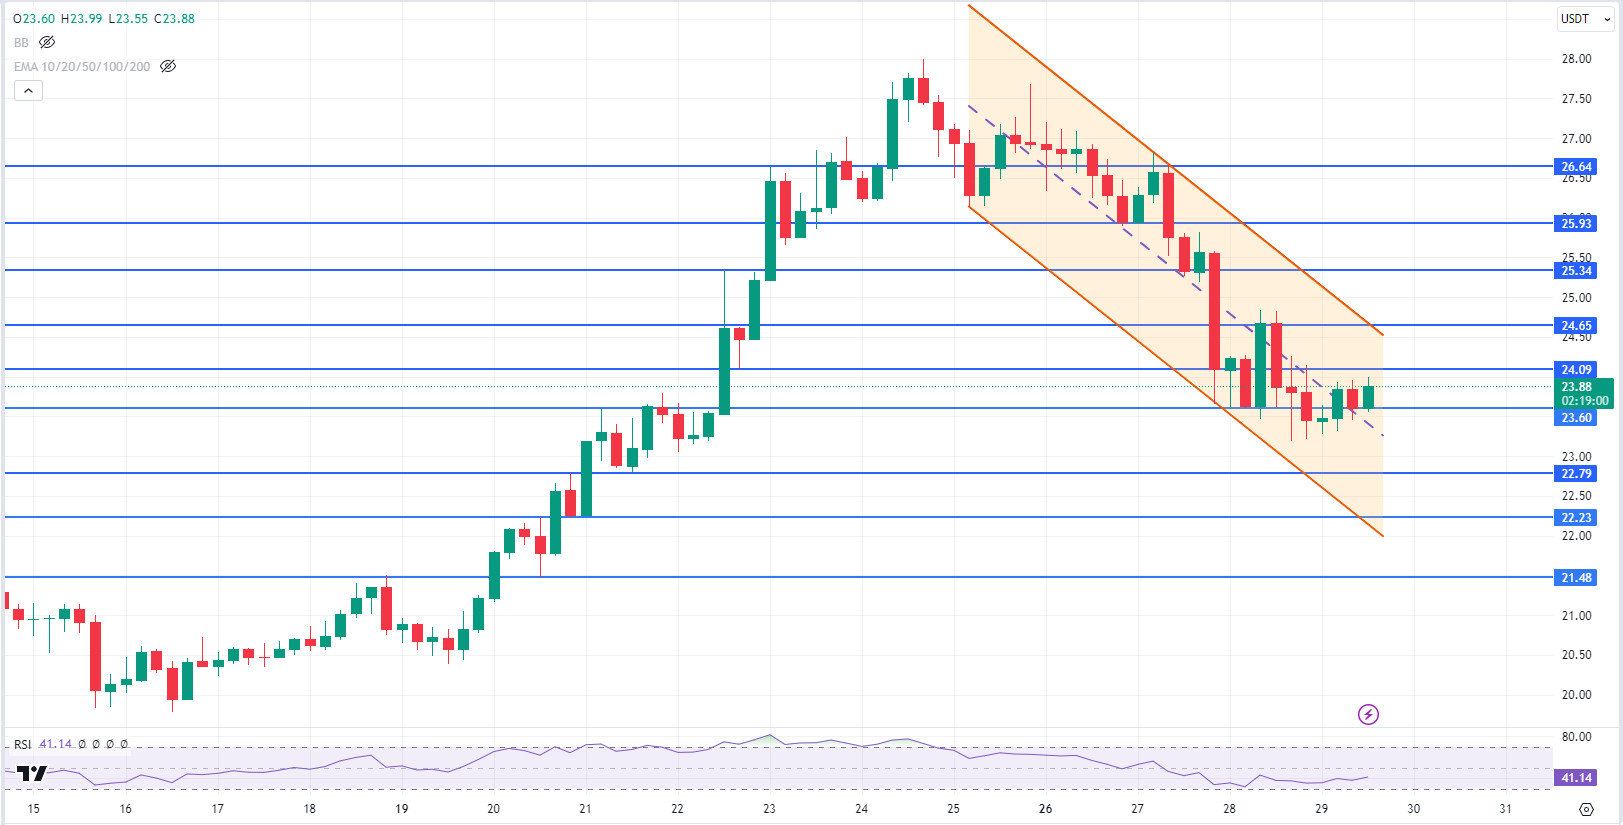
AVAX, which opened today at 23.44, is trading at 23.88 with the US stock markets opening positive after the US Gross Domestic Product and unemployment benefits data.
AVAX, which is currently moving in a falling channel, is trying to break out from the middle band to the upper band of the channel on the 4-hour chart. It has already broken the 23.60 resistance and may test the 24.09 and 24.65 resistances. If it fails to break the 24.09 resistance and faces selling pressure here, it may test the 23.60 and 22.79 supports. It may want to rise as long as it stays above 21.48 support during the day. With the break of 21.48 support, sales may deepen.
Supports 23.60 – 22.79 – 22.23
Resistances 24.09 – 24.65 – 25.34
TRX/USDT
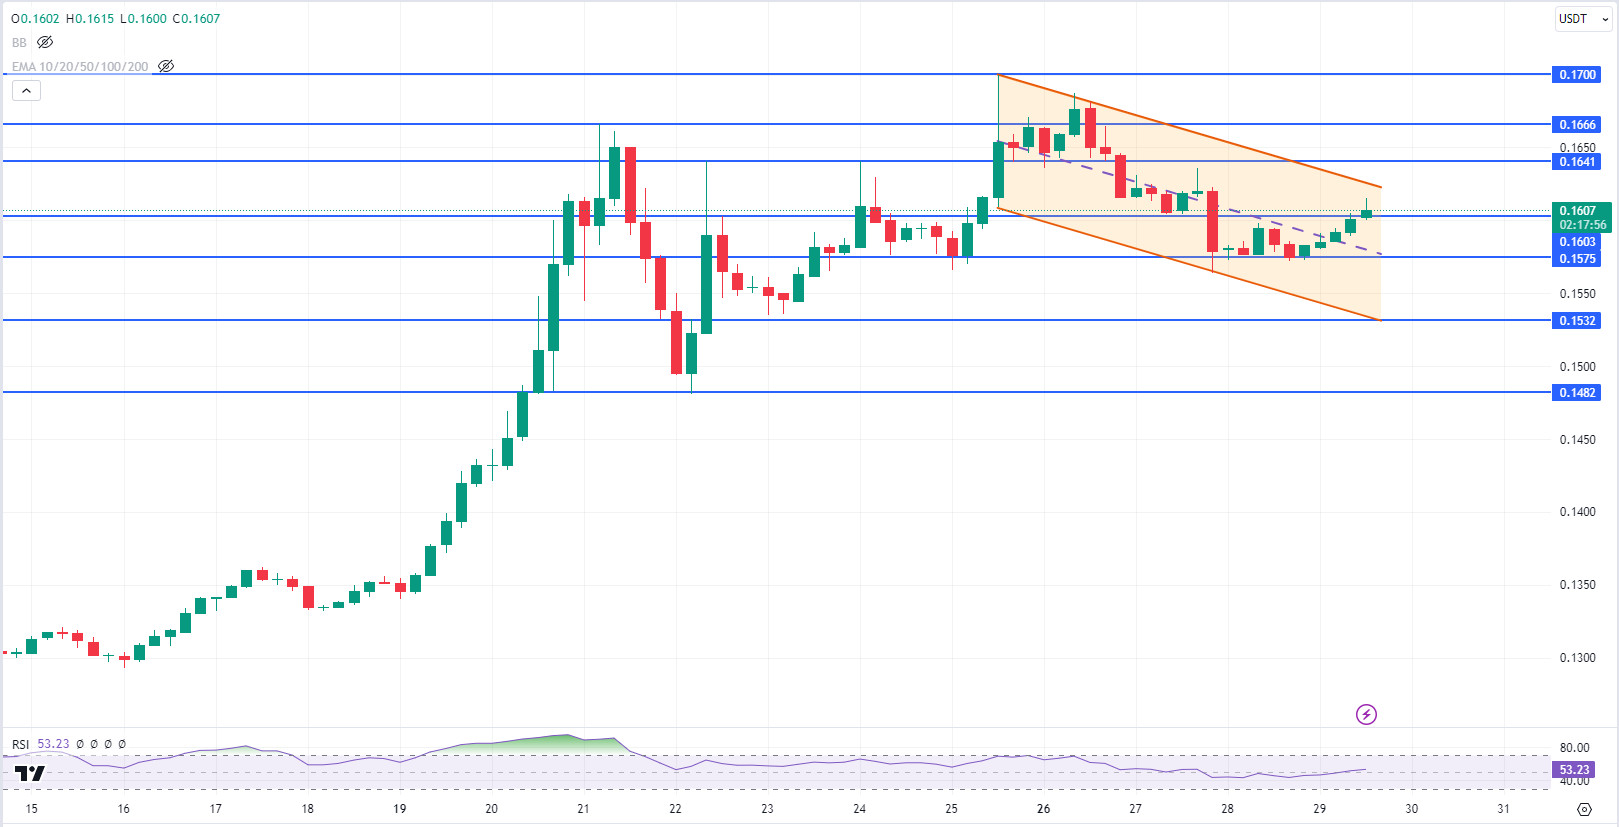
TRX, which started today at 0.1582, is trading at 0.1607 on a day when US data (gross domestic product and unemployment claims) are released. TRX, which is currently moving in a falling channel, is at the upper band of the channel on the 4-hour chart. If it breaks the upper band of the channel, its rise may accelerate. In such a case, it can test the 0.1641 and 0.1666 resistances. If it fails to break the upper band, it may retreat to the middle band. In this case, it may test the 0.1575 support. If it fails to hold here, it may fall to the lower band of the channel and test the 0.1532 support. As long as TRX stays above 0.1482 support, it can be expected to continue its upward demand. If it breaks this support downwards, sales may deepen.
Supports 0.1575 – 0.1532 – 0.1482
Resistances 0.1603 – 0.1641 – 0.1666
XRP/USDT
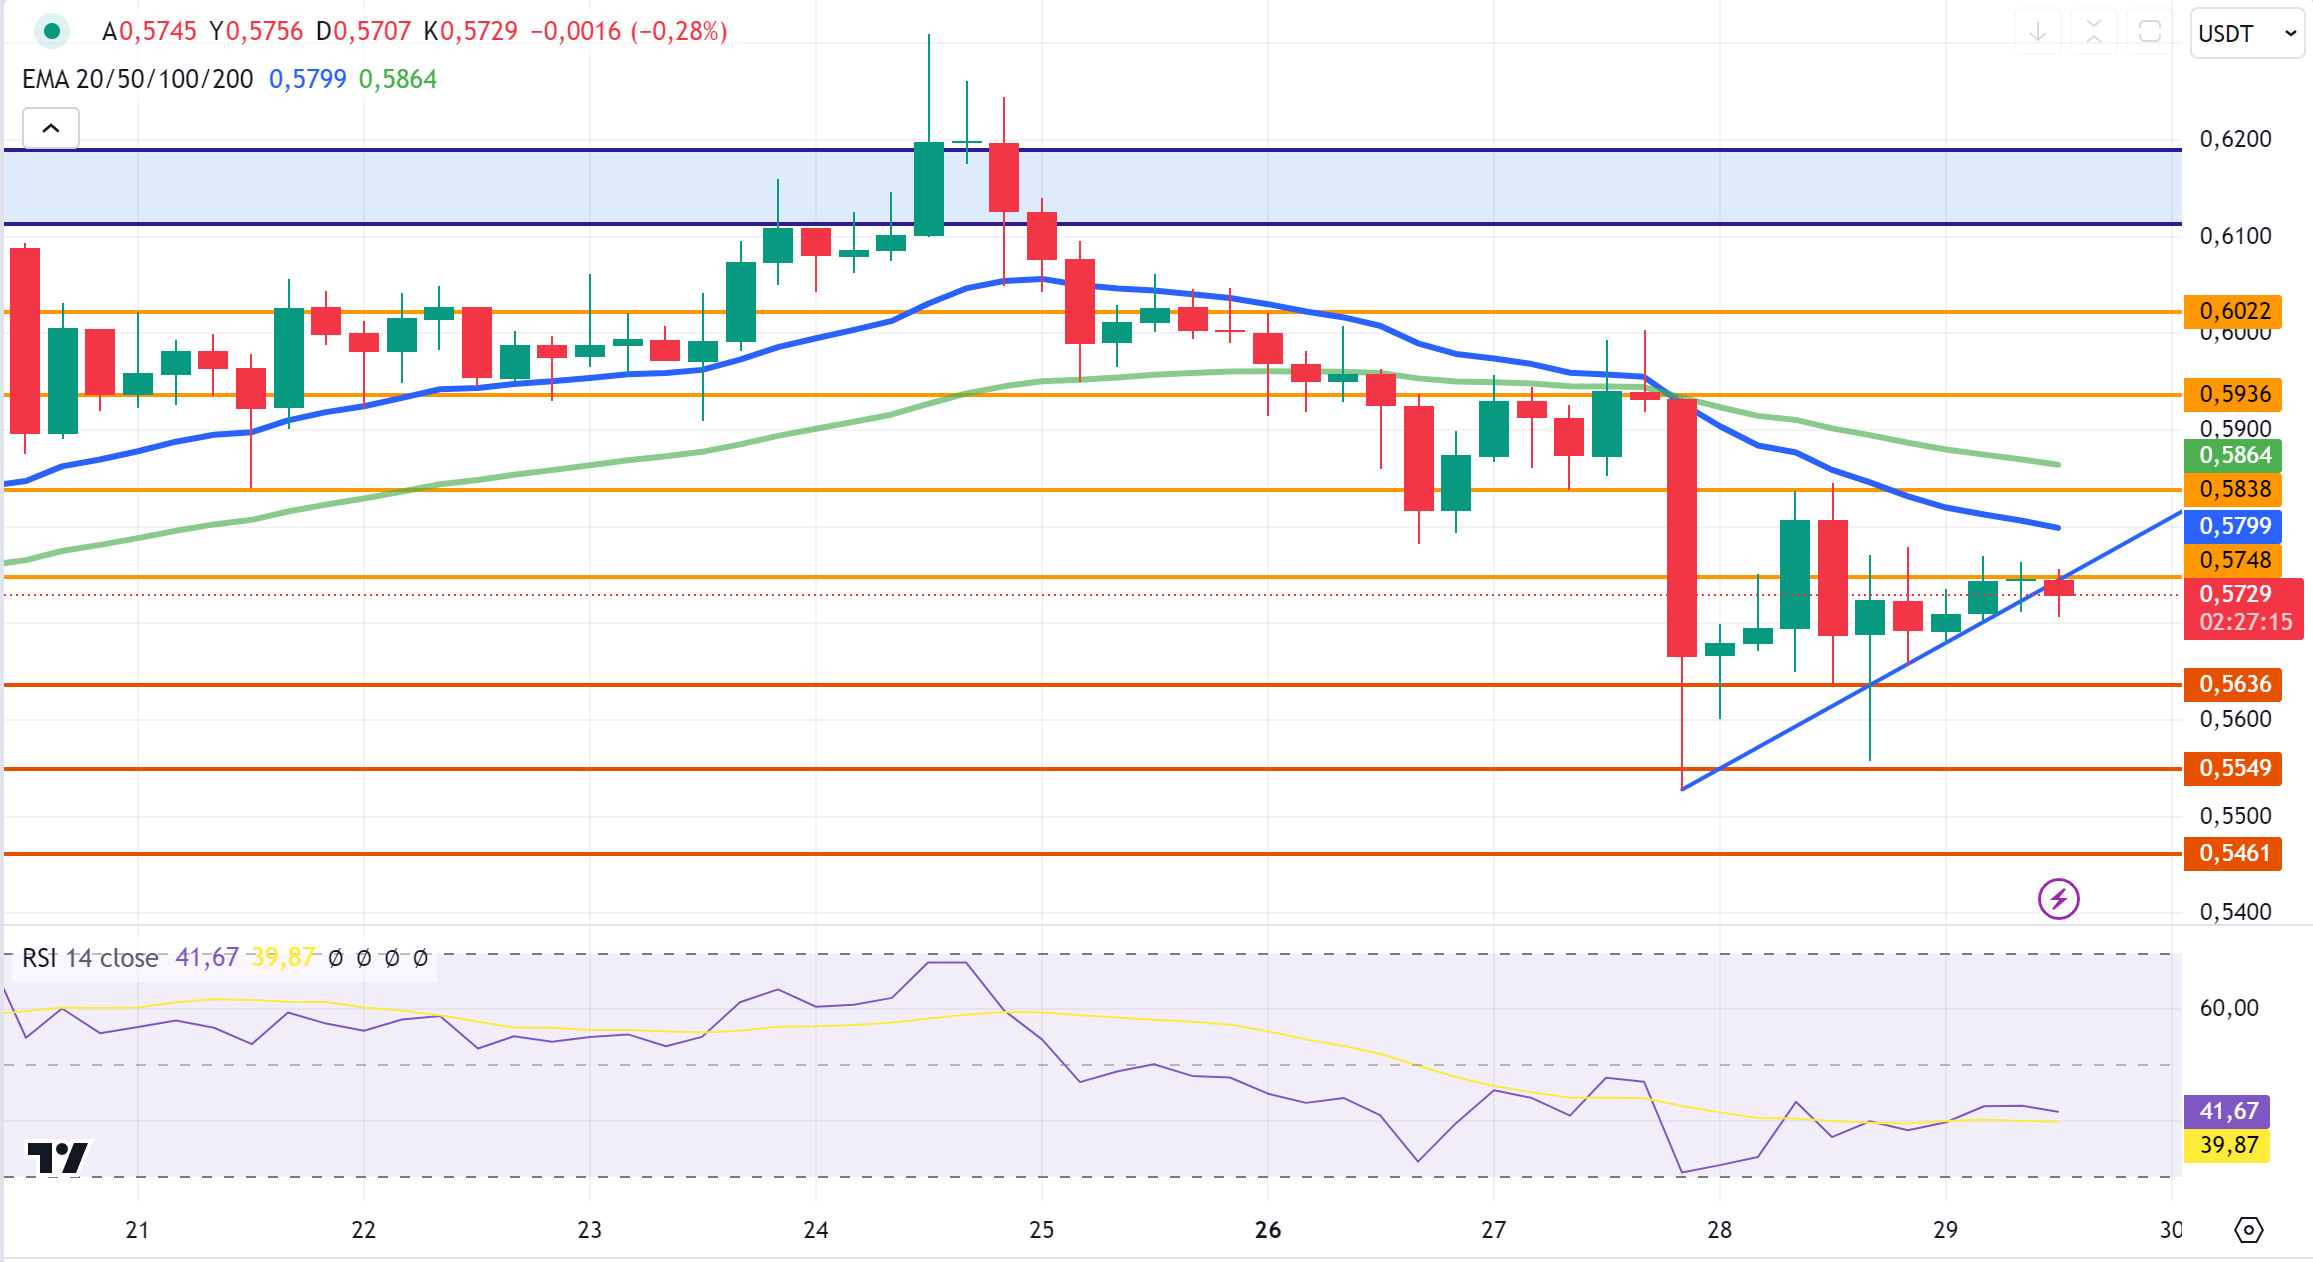
XRP, which started today at 0.5690, continues to trade at 0.5729 with a 0.6% increase in value.
In the 4-hour analysis, XRP, which continued to rise in the first 3 candles today, fell after testing the 0.5748 resistance level on the last candle. XRP, which has not yet closed the last candle and is in an uptrend, may test the 0.5838 – 0.5936 resistance levels if it breaks the 0.5748 resistance level and continues its uptrend. If the uptrend ends, it may test the support levels of 0.5636 – 0.5549 – 0.5461.
If XRP continues to move up and down within the 0.55-0.58 horizontal band, it may offer long trading opportunities at 0.55 and short trading opportunities at 0.58 in short-term trading.
Supports 0.5636 – 0.5549 – 0.5461
Resistances 0.5748 – 0.5838 – 0.5936
DOGE/USDT
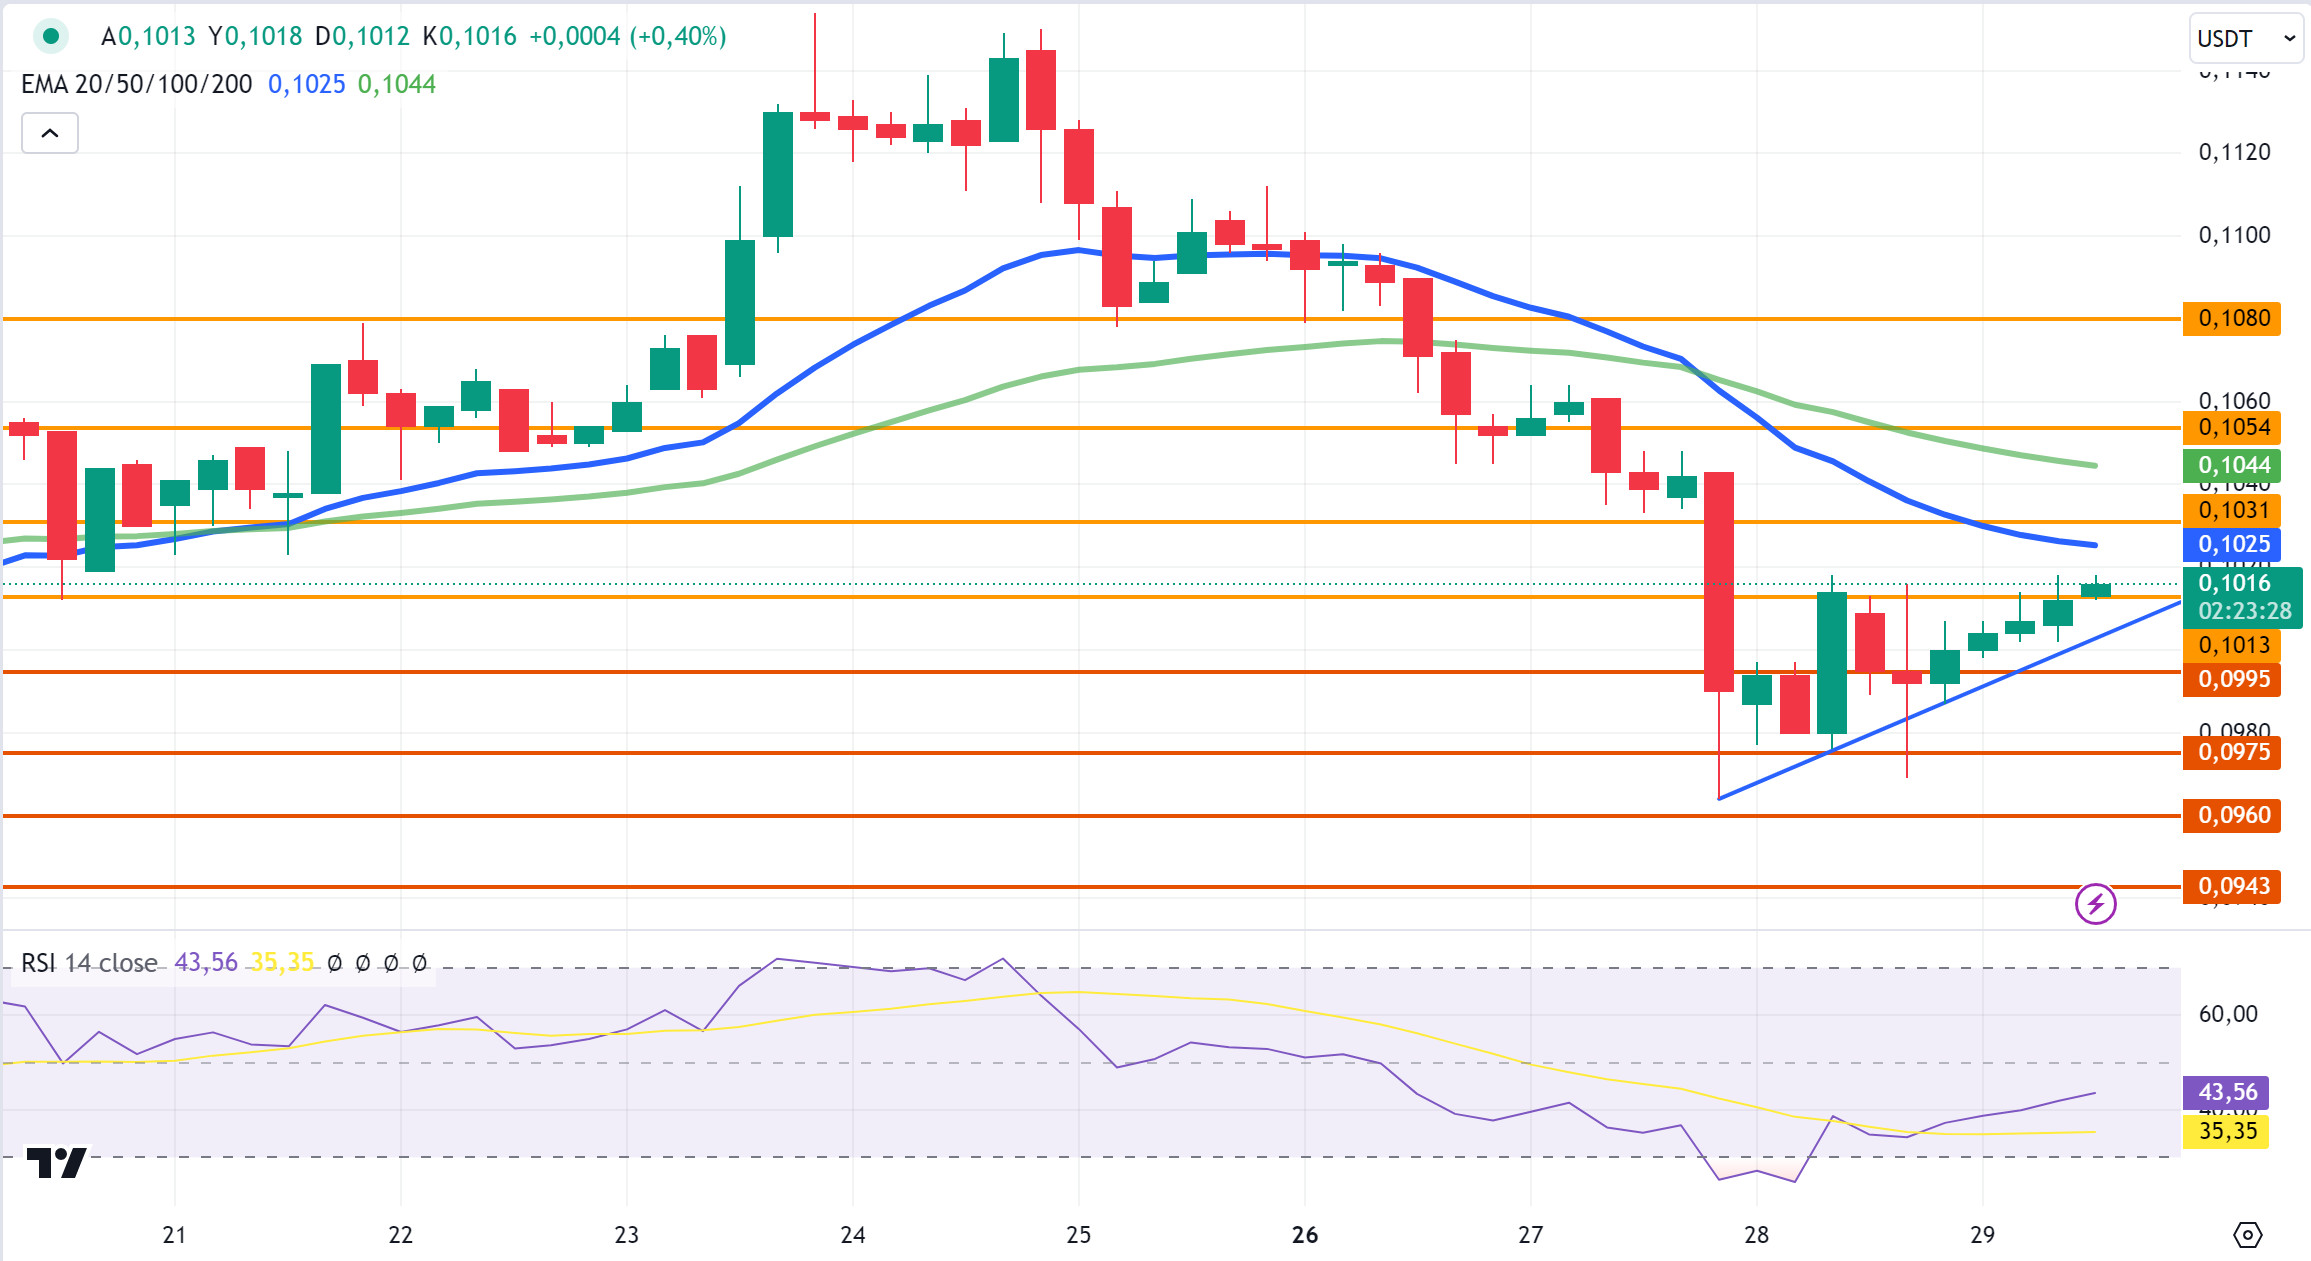
DOGE, which started a recovery and uptrend after the sharp decline it experienced, continued to rise today and after starting today at 0.0995, it rose to 0.1018 with an increase of about 2%.
In the 4-hour analysis, DOGE, which continues to rise today, is testing the 0.1013 resistance level in the last candle. If the resistance level in question is broken and continues to rise, it may test the resistance levels of 0.1031 – 0.1054 – 0.1080. On the contrary, if the 0.1013 resistance level cannot be broken and declines, it may test the support levels of 0.0995 – 0.0975 – 0.0960.
Supports 0.0995 – 0.0975 – 0.0960
Resistances 0.1031 – 0.1054 – 0.1080
‘DOT/USDT
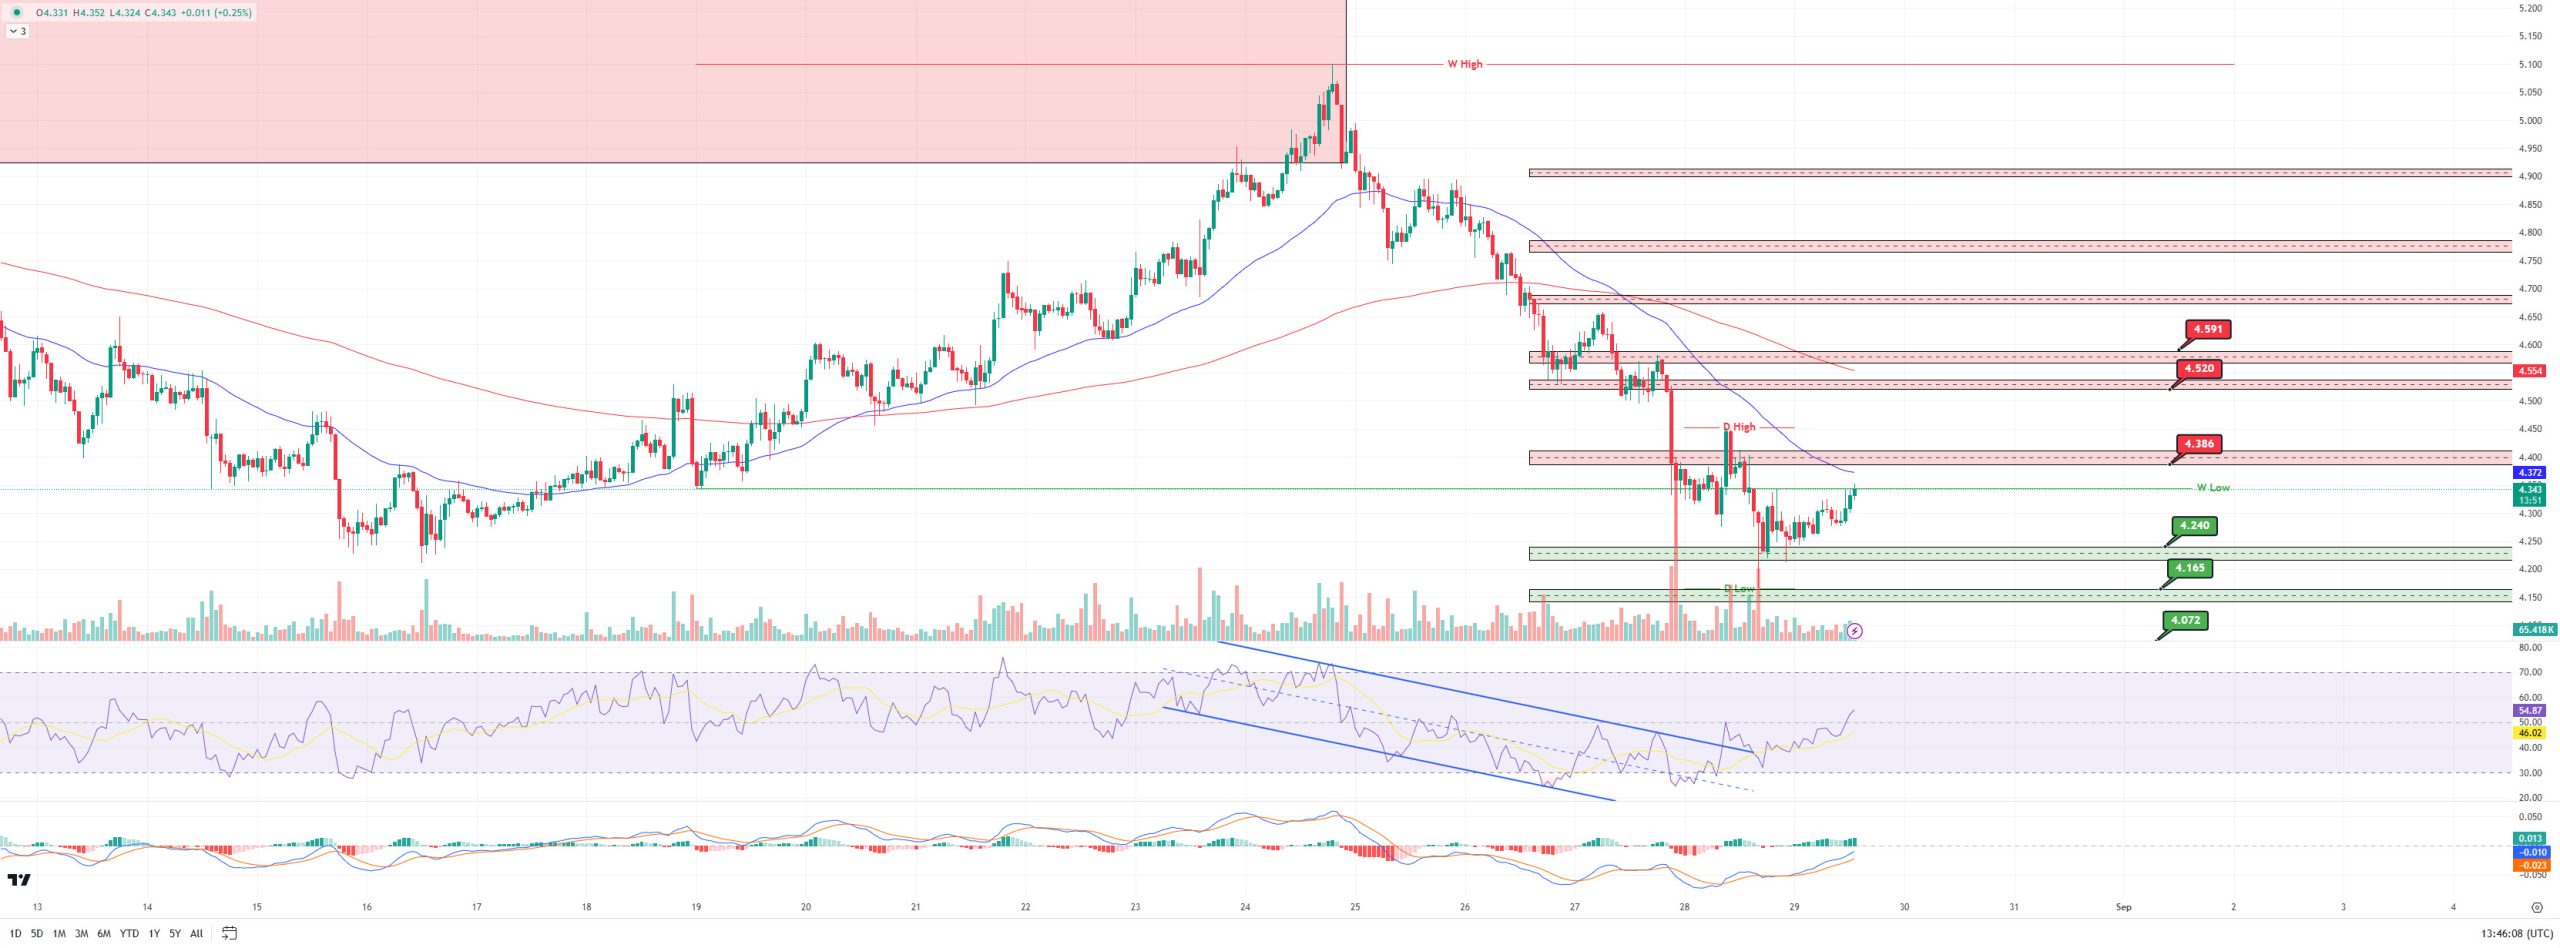
Polkadot (DOT) seems to have reacted from the first support level of 4,240 and rose to the low level of the previous week and received a reaction from there. We can expect the price to pull back from these levels, although buyer pressure on the MACD increased compared to the previous hour. If the price breaks this level upwards, the first resistance level will be 4.386. In the negative scenario, the price may correct and test 4.240 levels again. If the price does not persist here, it may move towards the next support level of 4,165.
(Blue line: EMA50, Red line: EMA200)
Supports 4,240 – 4,165 – 4,072
Resistances 4.386 – 4.520 – 4.386
SHIB/USDT
The official Shiba Inu account made a post titled “Shiba is good”, inspired by a similar post by Ethereum co-founder Vitalik Buterin, which caught the attention of the community. Buterin’s optimistic messages about ETH had created short-term increases in the ETH price. When the Shiba Inu team took a similar approach to this post, it created excitement in the SHIB community and a 4% increase in the SHIB price was observed.
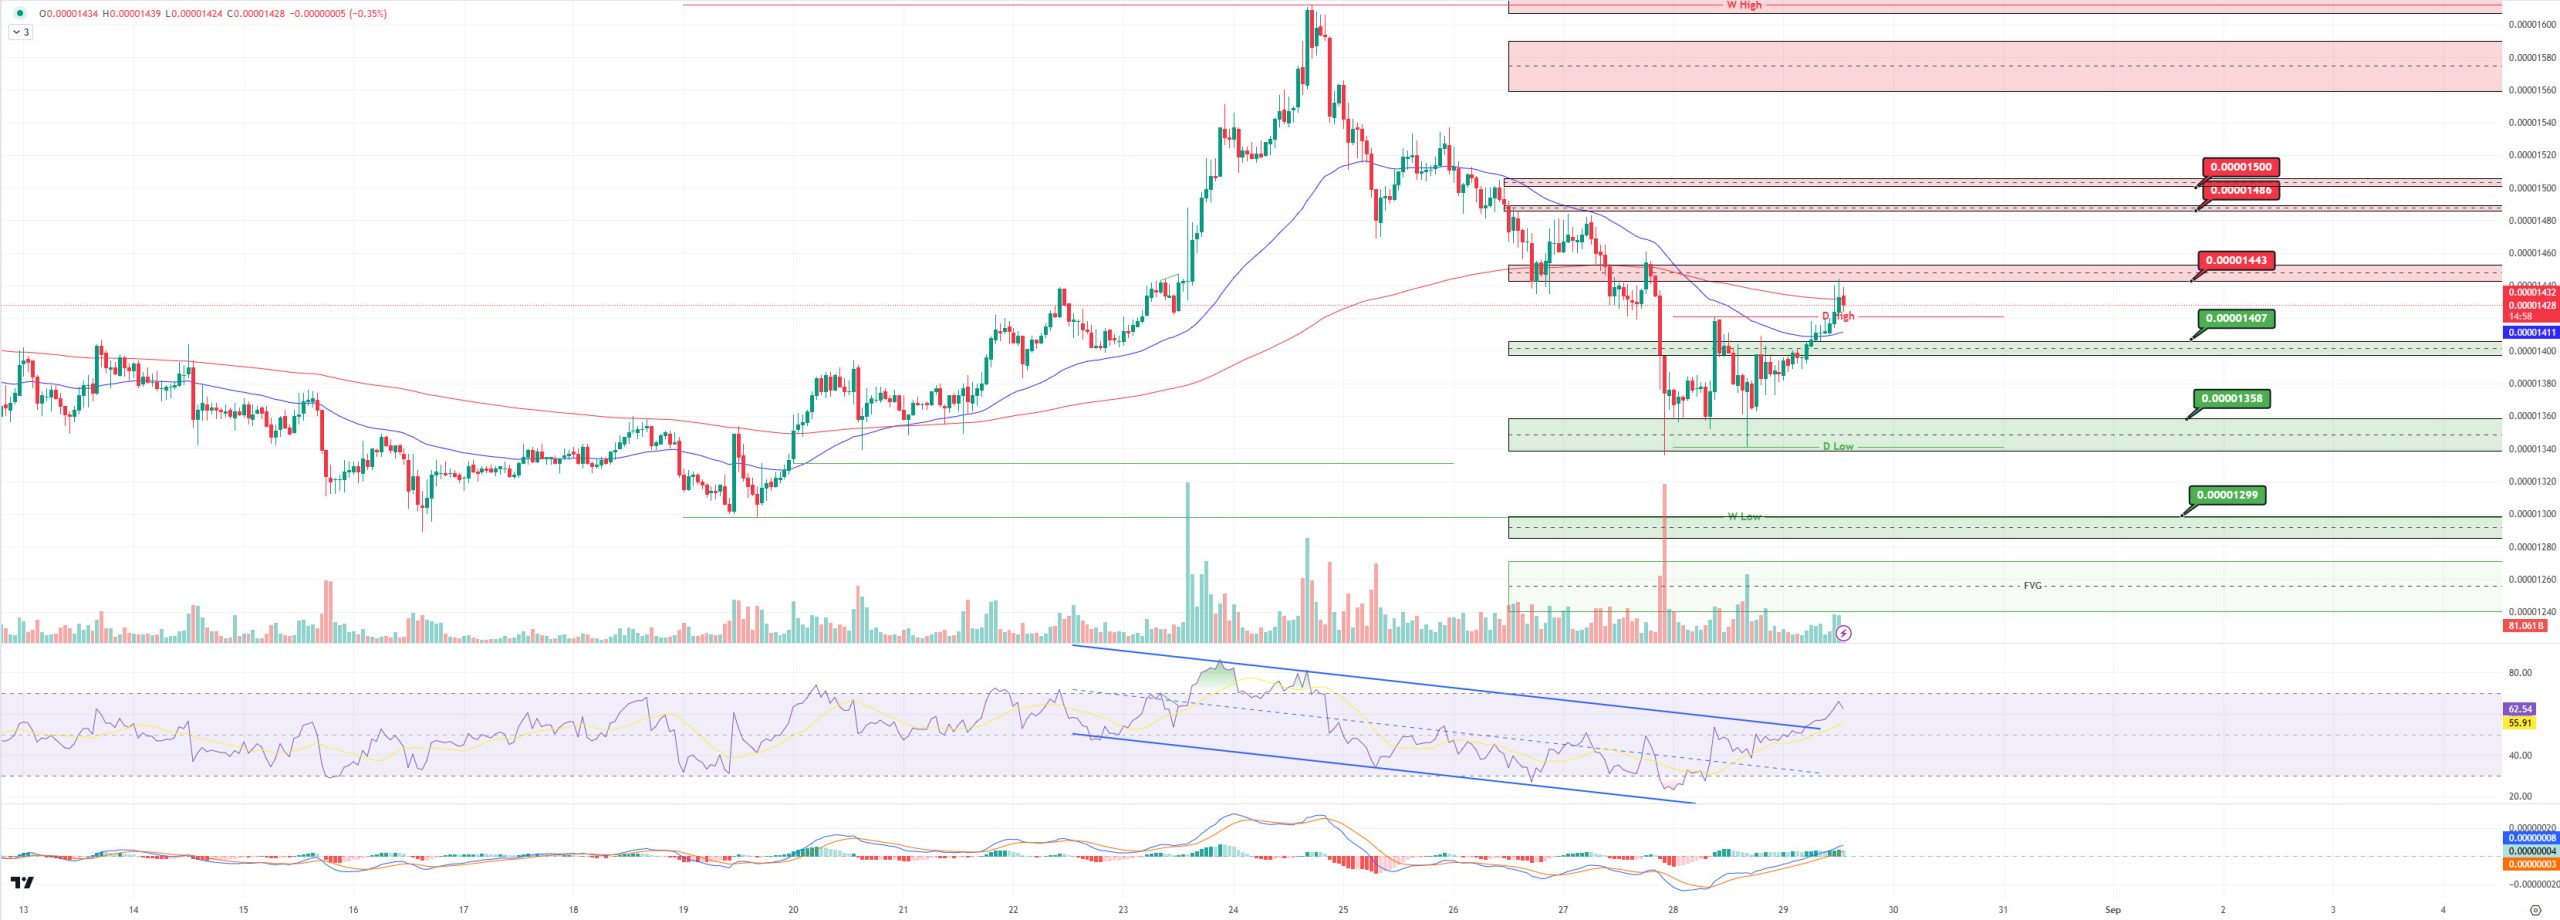
We can say that the buyer pressure has decreased on the SHIB chart. Buyer pressure seems to have decreased on the MACD compared to the previous hour.The price, which broke the 0.00001432 resistance, seems to have been rejected from the next resistance level of 0.00001443. We can say that if the price stays above the 0.00001443 level, its next target could be 0.00001486. On the other hand, if the price wants to make this bullish correction, the first support zone may be 0.00001407 levels. If the price fails to hold at these levels, it may want to test the 0.00001358 level.
(Blue line: EMA50, Red line: EMA200)
Supports 0.00001407 – 0.00001358 – 0.00001299
Resistances 0.00001443 – 0.00001486 – 0.00001500
LEGAL NOTICE
The investment information, comments and recommendations contained herein do not constitute investment advice. Investment advisory services are provided individually by authorized institutions taking into account the risk and return preferences of individuals. The comments and recommendations contained herein are of a general nature. These recommendations may not be suitable for your financial situation and risk and return preferences. Therefore, making an investment decision based solely on the information contained herein may not produce results in line with your expectations.


