
Market Compass
War in the Middle East and Digital Assets Led by Bitcoin
The war in the Middle East, which began last weekend, continues to profoundly affect the entire world. Financial markets have not been able to escape the negative consequences of this war, but we have also witnessed some interesting price movements. In recent months, Bitcoin, which behaves like a high-beta, risky asset, managed to rise despite the uncertainty brought on by geopolitical tensions and saw demand as if it were an asset class used by investors as a store of value, isolated from traditional markets. Before falling back below $70,000 towards the end of the week, the largest cryptocurrency tested the $74,000 barrier.
According to statistical and econometric modeling, Bitcoin has taken on the role of a “safe haven” in the short term, as markets seek to avoid risk. We do not currently expect this pricing behavior to extend into the long term; however, our forecast for this investment horizon still produces an upward-trending outcome in the equation we have constructed based on different dynamics. In the short term, we believe that the recent gains will be preserved and that a period of pressure may await us. We anticipate that pressure on digital assets may ease somewhat in the second half of the year (medium term).
Of course, there are several risk factors related to this baseline scenario. The first is the possibility of a prolonged war between the US, Israel, and Iran. As a result, energy prices would remain high for a relatively longer period, creating an inflationary environment. This equation and causal relationship could jeopardize the interest rate cuts anticipated by the US Federal Reserve (Fed) during the year, leading to tighter financial conditions than previously thought. This situation could create a basis for markets to shy away from taking risks in the long term and turn more towards fixed-income securities.
Beyond our expectations and the risks associated with them, markets will continue to monitor news from the Middle East next week. In addition, macro indicators related to the health of the US economy will be closely monitored, and the FED is expected to provide clues about its monetary policy path. We will detail some of these data below.
March 11 – US Consumer Price Index: CPI
One of the key macro indicators that could provide insight into the Federal Reserve’s (Fed) interest rate cut path will be February’s inflation, specifically the change in the Consumer Price Index (CPI). In an environment where measuring price increases stemming from tariffs remains challenging, the new concerns arising from rising energy costs due to the war in the Middle East appear set to challenge Fed Chair Powell and his team. Of course, we will not see the effects of the jump in oil prices on February’s CPI data, but “sticky” core inflation, combined with expectations of increases in the energy component in the coming months, could be enough to scare the markets.
US Monthly CPI
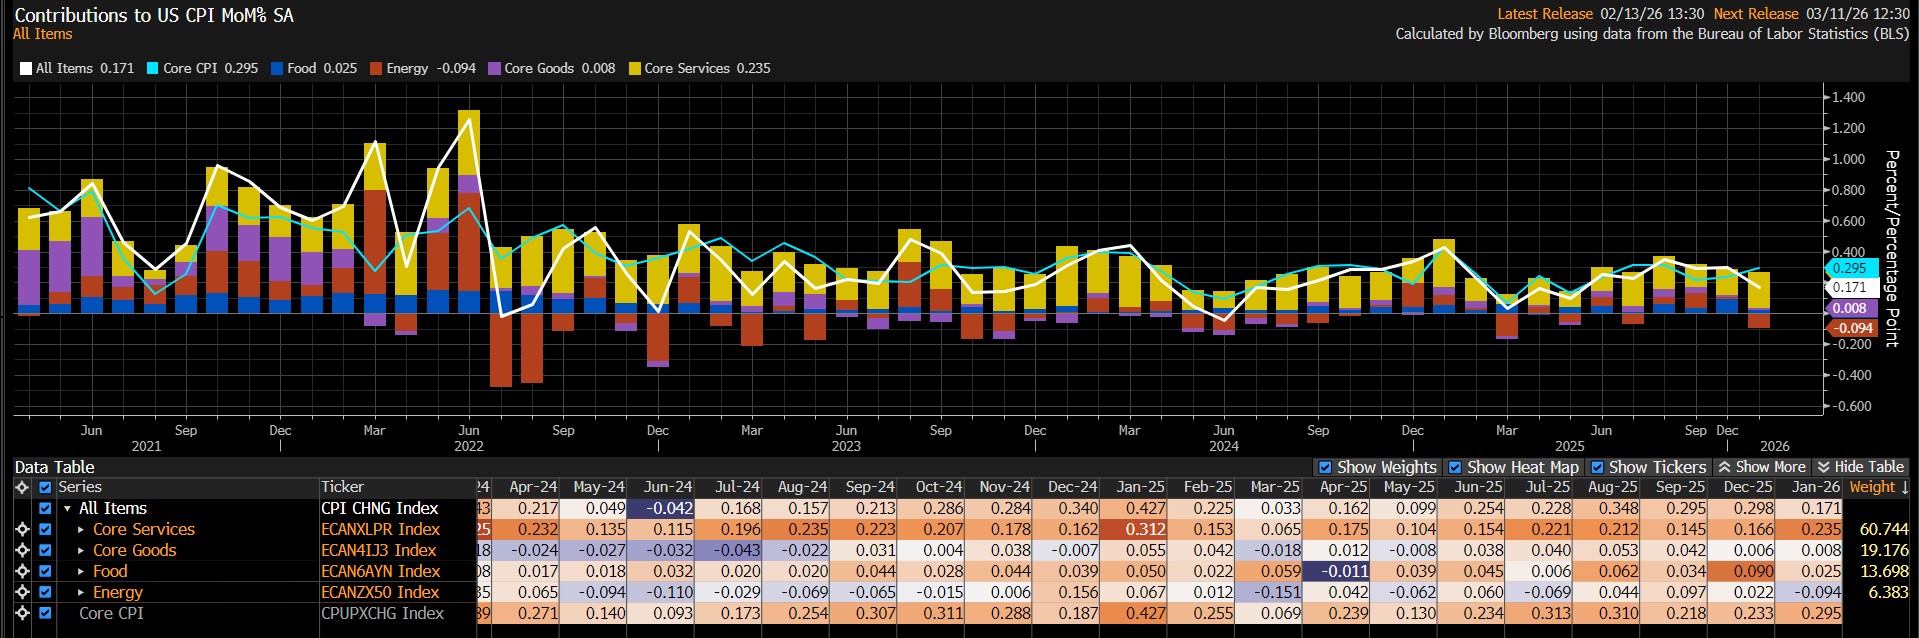
Source: Bloomberg
US consumer prices rose 0.2% in January compared to the previous month, signaling a slower increase than in December and falling short of the 0.3% increase expected. We estimate that the monthly CPI data for February could be 0.37% and annual inflation could be 2.51%.
A CPI figure below market expectations could be interpreted as giving the Fed more leeway to cut interest rates, which could have a positive impact on digital assets. A figure exceeding expectation, on the other hand, could reinforce expectations that the Fed may hesitate to implement another rate cut, potentially putting pressure on the market.
March 13 – The Fed’s Favorite Inflation Indicator: PCE
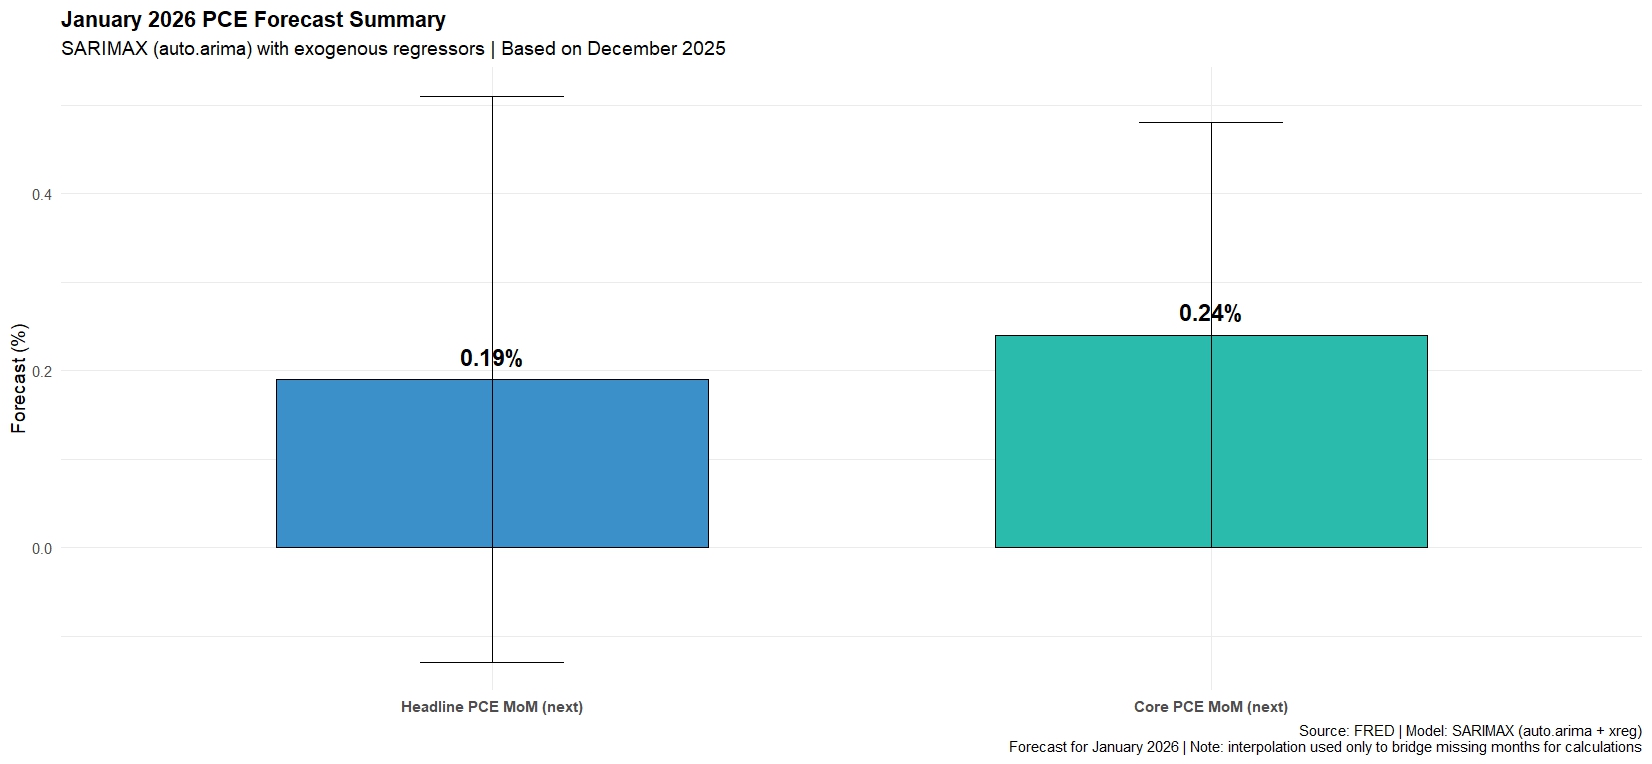
Markets seeking clues about the timing of the Federal Open Market Committee’s (FOMC) next rate cut decision and the path of rate cuts will closely monitor the delayed release of January’s Personal Consumption Expenditures (PCE) data. This indicator is known as the preferred gauge for FOMC officials to track changes in inflation.
U.S. Monthly Core PCE Data
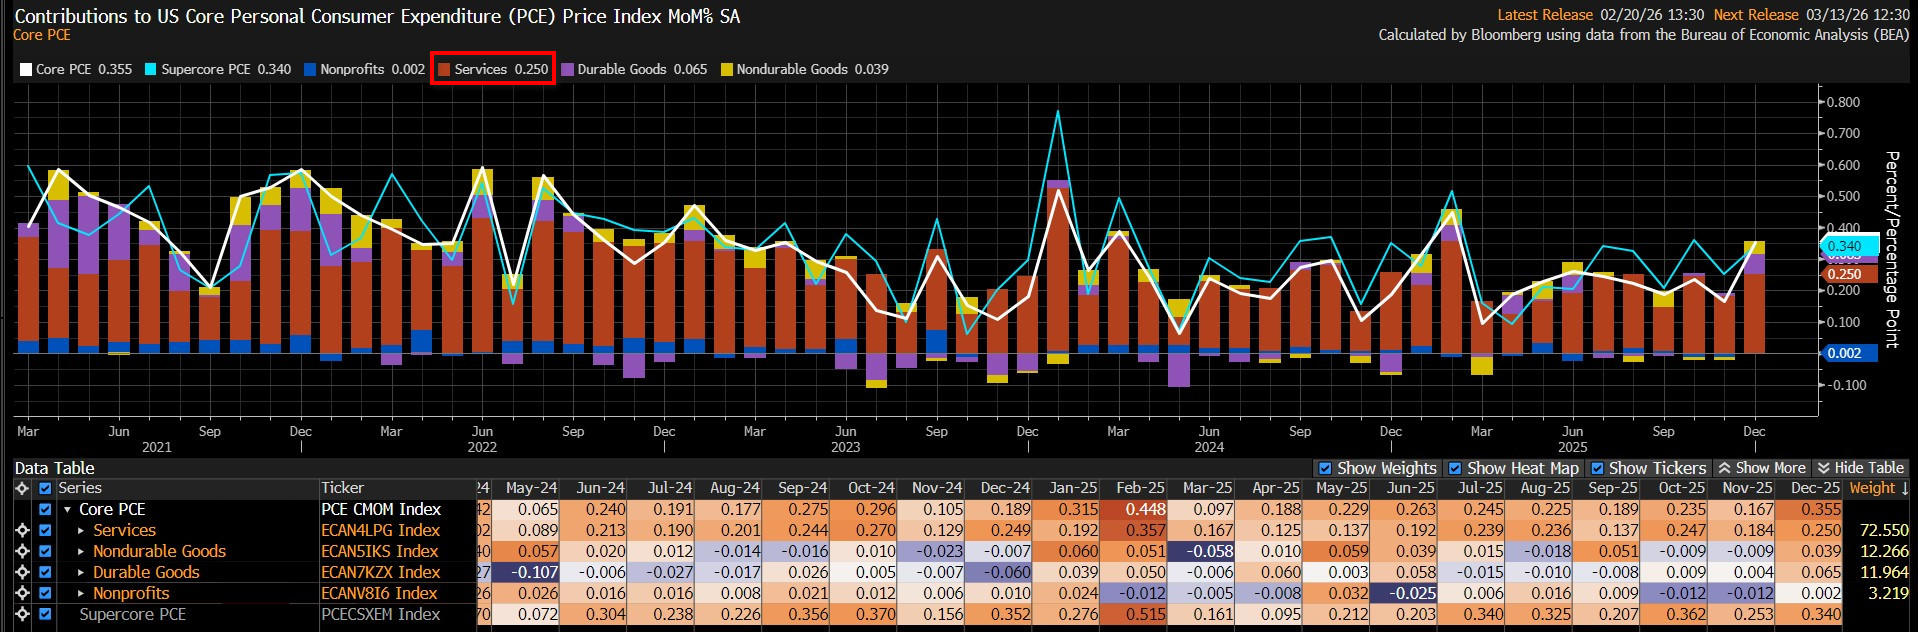
Source: Bloomberg
According to the latest data, core PCE rose 0.4% in December compared to the previous month. The service sector accounted for the largest share of the price increase. On an annual basis, core PCE rose 3%. We expect core PCE data to show an increase of around 0.24% in January.
Source: Darkex Research
Data coming in above market expectations could support expectations that the Fed may be cautious about cutting interest rates, reducing risk appetite and putting pressure on digital assets, including Bitcoin. Data coming in below expectations, on the other hand, could have the opposite effect and pave the way for gains.
Other Key Macroeconomic Indicators and Developments
March 8 – U.S. Daylight Saving Time (DST) Shift; The US will switch to daylight saving time and clocks will move forward by 1 hour. As DST will be implemented in Europe on March 29, the opening and closing times of the US stock markets will be changed for almost the entire month of March compared to Europe.
March 12 – U.S. Initial Jobless Claims; This shows the number of people who filed for unemployment insurance for the first time during the previous week and is published weekly, usually on the first Thursday after the week ends. Although it is a lagging indicator, the number of unemployed is considered an indicator of overall economic health because consumer spending is highly correlated with labor market conditions. Market impact can vary from week to week, and market participants tend to focus more on this data when they are more sensitive to recent developments or when macro indicators related to the labor market are at extreme levels.
March 13 – U.S. Final GDP: There are three versions of GDP published monthly: Advance, Preliminary, and Final. Advance data, being the earliest published, generally has the greatest impact. Release date delayed by 15 days due to the U.S. government shutdown. Advance data released for the final quarter of 2025 indicated that the world’s largest economy grew by 1.4% during the period, signaling an economic expansion below expectations. A figure exceeding expectations could cause Bitcoin’s price to rise, while data below expectations could lead to losses. However, it should be noted that the impact of this data on digital assets may be limited.
March 13 – U.S. Job Openings and Labor Turnover Survey (JOLTS); Shows the number of job openings during the reported month, excluding the agricultural sector. This JOLTS data is closely monitored as job creation is an important leading indicator of consumer spending, which accounts for a large share of overall economic activity. It is released monthly and approximately 35 days after the end of the month. A lower-than-expected release is expected to have a positive impact on cryptocurrencies.
March 13 – U.S. Preliminary UoM Consumer Sentiment; This is a survey conducted by the University of Michigan (UoM) with approximately 420 consumers, asking respondents to assess the relative level of current and future economic conditions. Financial confidence is a leading indicator of consumer spending, which accounts for a large share of overall economic activity. It has two cycles, 14 days apart, called Preliminary and Revised. The “Preliminary” is usually relatively more influential on prices and is published monthly in the middle of the current month. If the actual data comes in below expectations, it can have a positive impact on cryptocurrencies.
March 13 – U.S. Durable Goods Orders shows the change in the total value of new purchase orders placed with manufacturers for durable goods. This data is usually revised with the Factory Orders report released about a week later and “Durable Goods” are defined as products that last longer than 3 years, such as automobiles, computers, appliances, and airplanes. It is a leading indicator of production and provides a preliminary indication of the economy’s vitality. Core Durable Goods Orders shows the change in the total value of new purchase orders placed with manufacturers for durable goods, excluding transportation items. This dataset has been shown to have complex effects on the value of digital assets.
Important Economic Calender Data
Click here to view the weekly Darkex Crypto and Economy Calendar.
Information
*The calendar is based on UTC (Coordinated Universal Time) time zone.
The calendar content on the relevant page is obtained from reliable data providers. The news in the calendar content, the date and time of the announcement of the news, possible changes in the previous, expectations and announced figures are made by the data provider institutions.
Darkex cannot be held responsible for any changes arising from similar situations. You can also check the Darkex Calendar page or the economic calendar section in the daily reports for possible changes in the content and timing of data releases.
Legal Notice
The investment information, comments, and recommendations contained in this document do not constitute investment advisory services. Investment advisory services are provided by authorized institutions on a personal basis, taking into account the risk and return preferences of individuals. The comments and recommendations contained in this document are of a general nature. These recommendations may not be suitable for your financial situation and risk and return preferences. Therefore, making an investment decision based solely on the information contained in this document may not result in outcomes that align with your expectations.