MARKET SUMMARY
Latest Situation in Crypto Assets
| Assets | Last Price | 24h Change | Dominance | Market Cap |
|---|---|---|---|---|
| BTC | $68,751.37 | -0.44% | 60.78% | $1.36 T |
| ETH | $2,428.77 | -1.87% | 12.79% | $292.49 B |
| SOLANA | $160.86 | -1.01% | 3.38% | $75.74 B |
| XRP | $0.5097 | 0.73% | 1.29% | $28.96 B |
| DOGE | $0.1687 | 10.84% | 1.10% | $24.57 B |
| TRX | $0.1623 | -1.66% | 0.63% | $14.04 B |
| CARDANO | $0.3301 | -0.89% | 0.51% | $11.55 B |
| SHIB | $0.00001760 | 4.23% | 0.46% | $10.38 B |
| AVAX | $23.13 | -2.26% | 0.42% | $9.42 B |
| LINK | $10.46 | -2.37% | 0.29% | $6.56 B |
| DOT | $3.806 | 0.19% | 0.26% | $5.77 B |
*Prepared on 11.5.2024 at 06:00 (UTC)
WHAT’S LEFT BEHIND
Mt.Gox Sends $2.2 Billion in Bitcoin to Two Wallets
According to Arkham data, Mt. Gox transferred more than 32,000 BTC, worth $2.2 billion at current prices, to unidentified wallet addresses. Extended until October 31, 2025, the ongoing repayment plan includes significant bitcoin transfers that have impacted market volatility.
Polymarket Trading Volume Increases One Day Ahead of US Elections.
Polymarket’s prediction market for the winner of the 2024 US presidential election reached $3.13 billion on November 4, one day before the election. Republican nominee Donald Trump garnered $1.2 billion in betting volume, while Democratic Vice President Kamala Harris garnered $782.5 million.
Bernstein Announces Bitcoin Forecast Based on Trump and Harris’ Victory!
Bernstein analysts claim that victory for both candidates is not priced in. Analysts expect Bitcoin to reach $80,000 to $90,000 after Trump’s win. However, they predict that if Harris wins, BTC will fall as low as $50,000 before recovering in the same period.
Singapore Takes New Steps in the Cryptocurrency Sector
The Monetary Authority of Singapore (MAS) has launched a new project aimed at expanding tokenization processes for fixed income assets and foreign exchange. MAS aims to expand tokenization and increase liquidity by providing support to financial institutions. MAS plans to establish a common settlement center for tokenized assets, which is undergoing an extensive testing process with international collaborations.
HIGHLIGHTS OF THE DAY
Important Economic Calender Data
| Time | News | Expectation | Previous |
|---|---|---|---|
| Sei (SEI) – Monthly Community Stream | – | – | |
| SafePal (SFP) – Monthly Community Stream | – | – | |
| iExec (RLC) – Meetup in Lyon, France | – | – | |
| Jupiter (JUP) – Update: Deprecation of Legacy Limit Order Endpoints | – | – | |
| Celestia (TIA) – Testnet Launch with Ginger Upgrade | – | – | |
| U.S. Presidential Election | – | – | |
| U.S. Congressional Elections | – | – | |
| 15:00 | US ISM Non-Manufacturing PMI (Oct) | 53.8 | 54.9 |
INFORMATION
*The calendar is based on UTC (Coordinated Universal Time) time zone.
The economic calendar content on the relevant page is obtained from reliable news and data providers. The news in the economic calendar content, the date and time of the announcement of the news, possible changes in the previous, expectations and announced figures are made by the data provider institutions. Darkex cannot be held responsible for possible changes that may arise from similar situations.
MARKET COMPASS
As global markets approach one of the most important bends of the near term, all eyes are on the US presidential election. According to Polymarket, former President Trump is leading the race, but other polls are showing neck and neck results. US stock markets closed on the negative side yesterday and today futures point to a slightly positive opening. European indices are also expected to start the day with a rise. After China’s Services PMI data, which exceeded the forecasts, there are generalized rises in Asian indices. In addition, new incentives are expected from the ongoing Chinese National People’s Congress. Bitcoin dominance in digital assets is in the 60%s and there is some upside after the pullback during US trading.
With uncertainty over the US presidential election and Arkham data showing Mt. Gox moved more than 32,000 Bitcoins, the largest cryptocurrency fell below $67,000 yesterday. This move formed the basis for our expectation of a short-term pullback. Afterwards, we see that almost all of these losses have been recovered. The direction of the price will now be determined by the results of the US presidential election. We have included details on this issue in our strategy report for November. You can review the November Strategy Report prepared by Darkex Research Department by clicking here.
From the short term to the big picture
It becomes even more difficult to determine the direction ahead of developments that markets are so focused on. Surprise events or developments that may produce results contrary to expectations can upset all predictions. Still, some key dynamics and metrics can help with forecasting, and at least it’s better than not knowing anything at all.
Within the framework of the fundamental variables that we often mention in our analysis, we maintain our expectation that the direction of digital assets is up for the long term. On the other hand, we can say that our forecast for a short-term pullback is grounded by yesterday’s news flow and the declines due to the stress ahead of the upcoming presidential election. Short-term forecasts involve more risk ahead of critical developments. Therefore, there is no doubt that they will need to be updated after the outcome of the US presidential election and the FED’s decisions.
TECHNICAL ANALYSIS
BTC/USDT
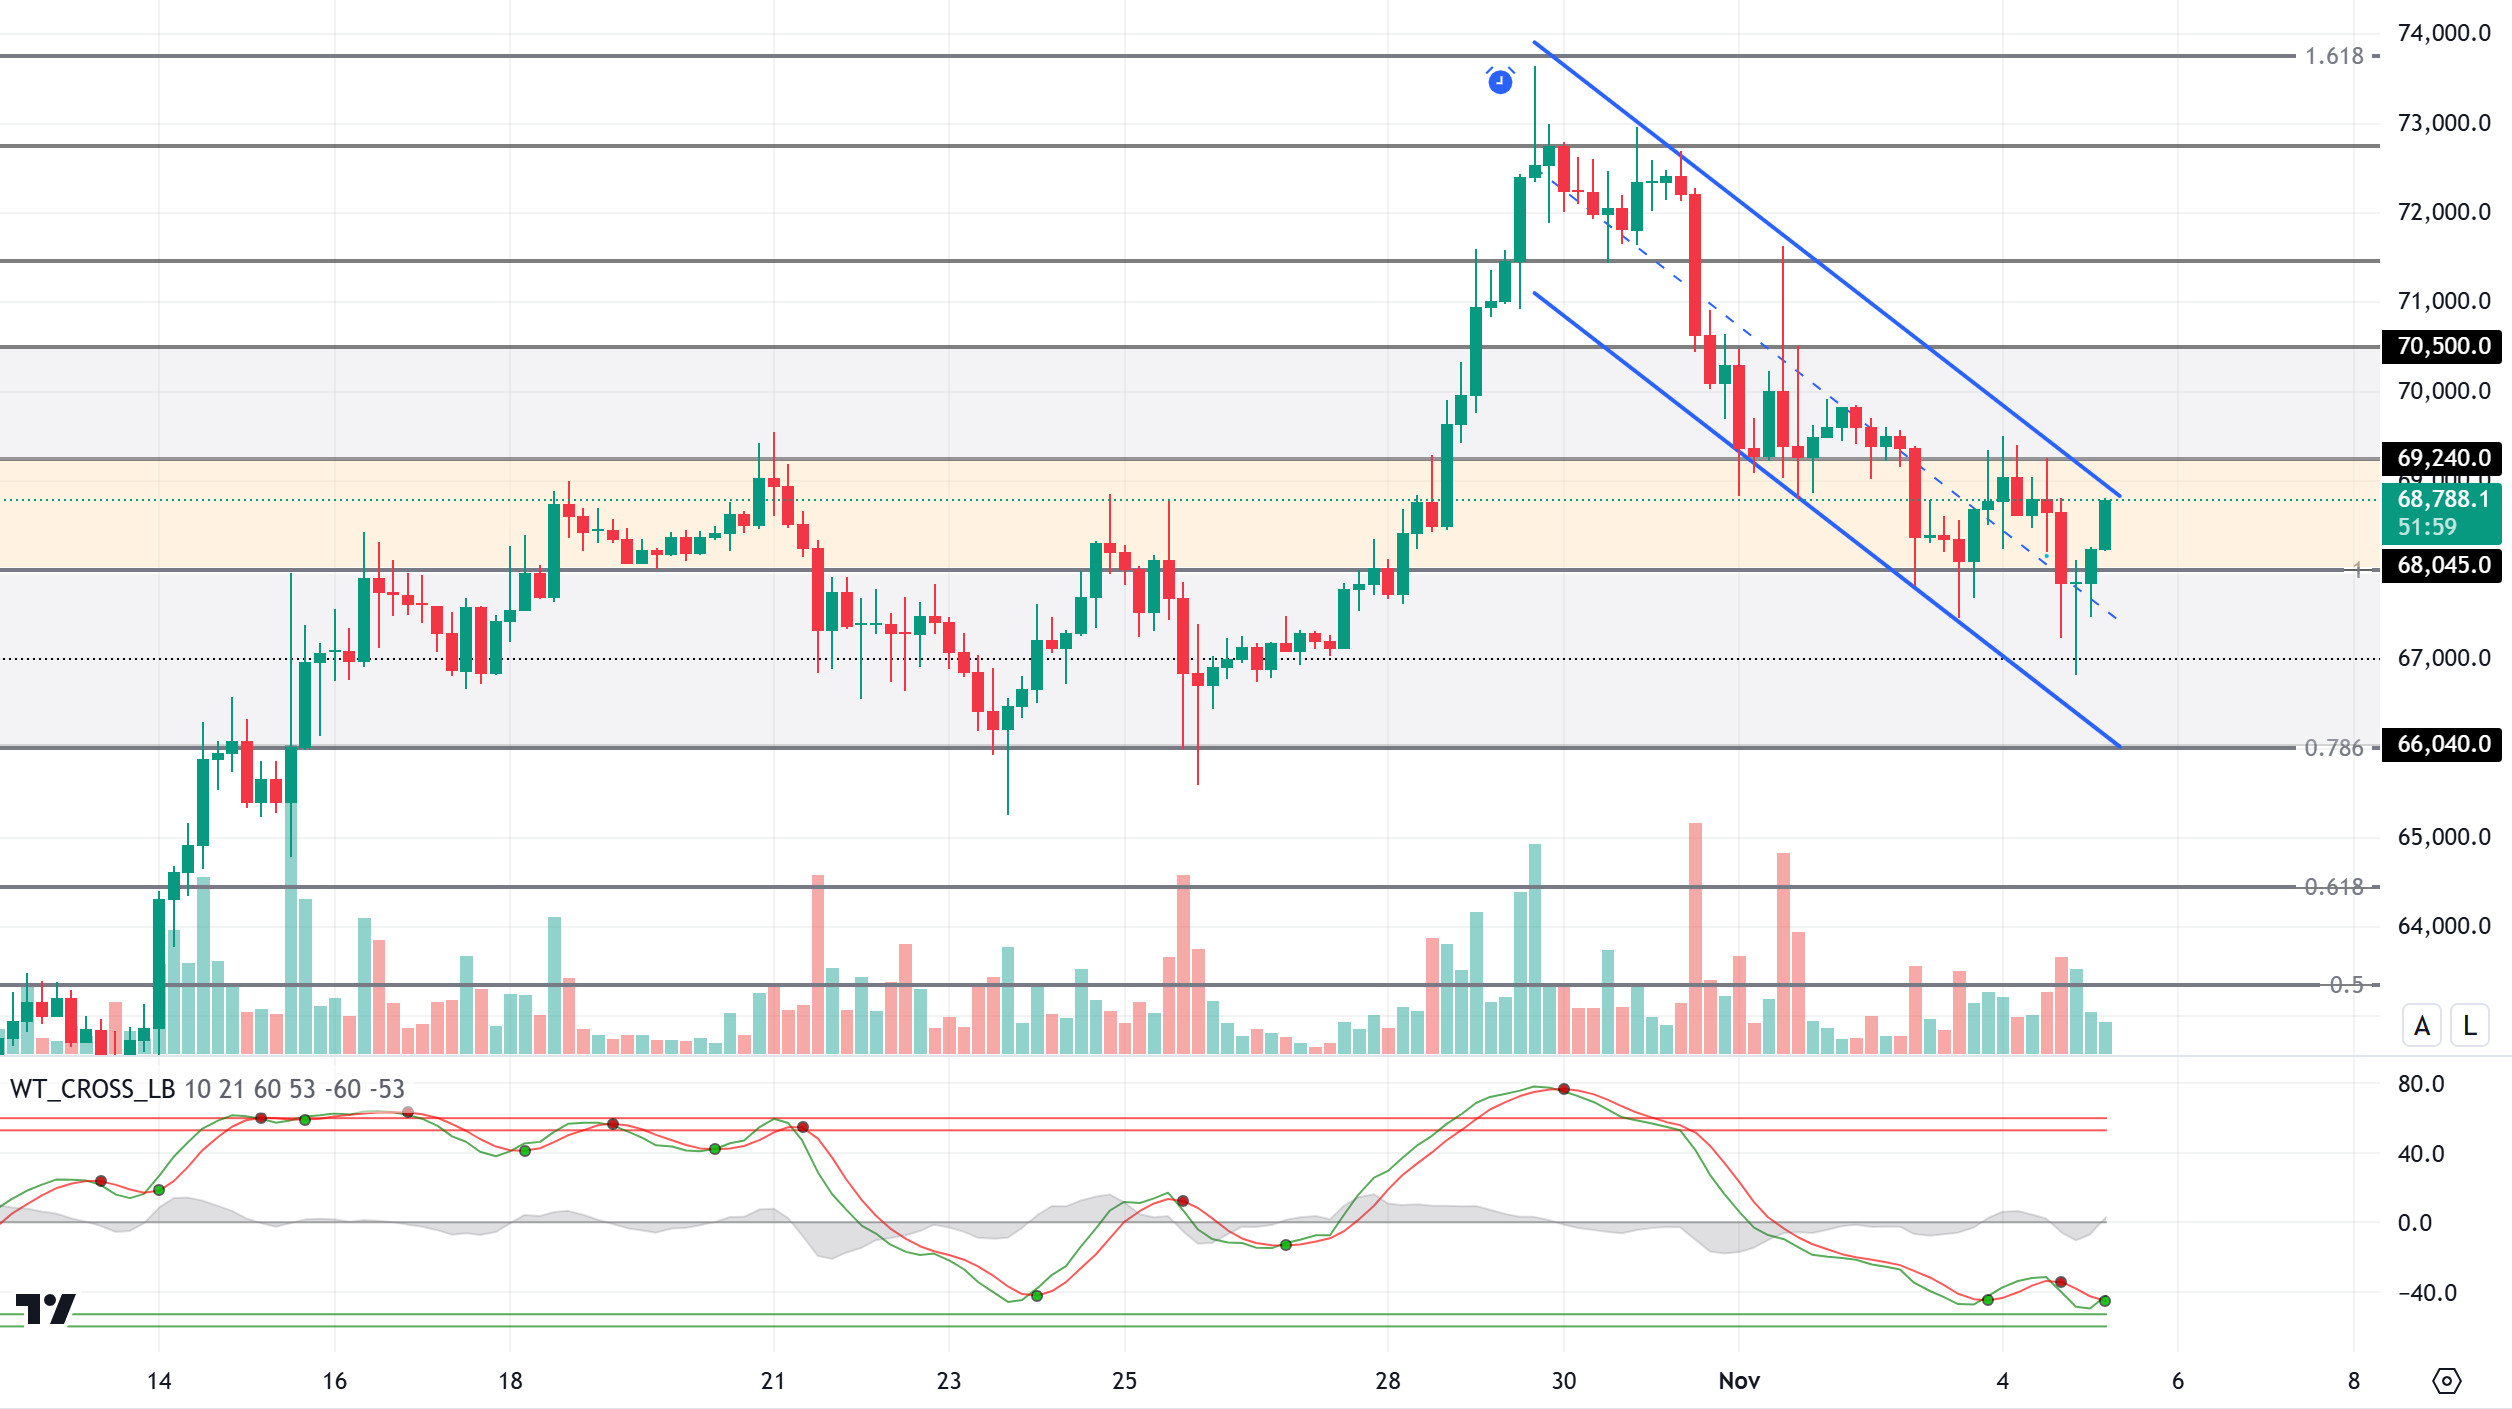
The expected day in the US presidential elections has arrived. Before the presidential election, which was one of the most important developments of the year, Bitcoin was frequently mentioned in electoral politics, which was one of the historical developments for Bitcoin. Donald Trump actively supported Bitcoin and the crypto market before the election, while Kamala Harris also showed a strong interest in the technology sector. The escalation of tensions in the Middle East and the continuation of Mt.Gox Bitcoin transfers were other developments that heated up the market environment.
In the light of all these developments, BTC’s technical outlook started to show the expected volatility movements in its price. Forming a falling trend channel within the major uptrend, BTC briefly fell to 66,800 levels after being rejected at the resistance level of 69,240. With the rapid recovery in its price, it is now priced at 68,700 again, pushing the upper line of the falling trend channel. In order for the uptrend to start, we will watch the 69,240 level to be crossed. Otherwise, our falling trend band has expanded towards the Fibonacci 0.786 (66,040) level. When we look at our technical oscillator, it shows market uncertainty by generating trading signals in the oversold zone.
Supports 68,045 -67,260 – 66,040
Resistances 69,240 – 70,500 – 71,460
ETH/USDT
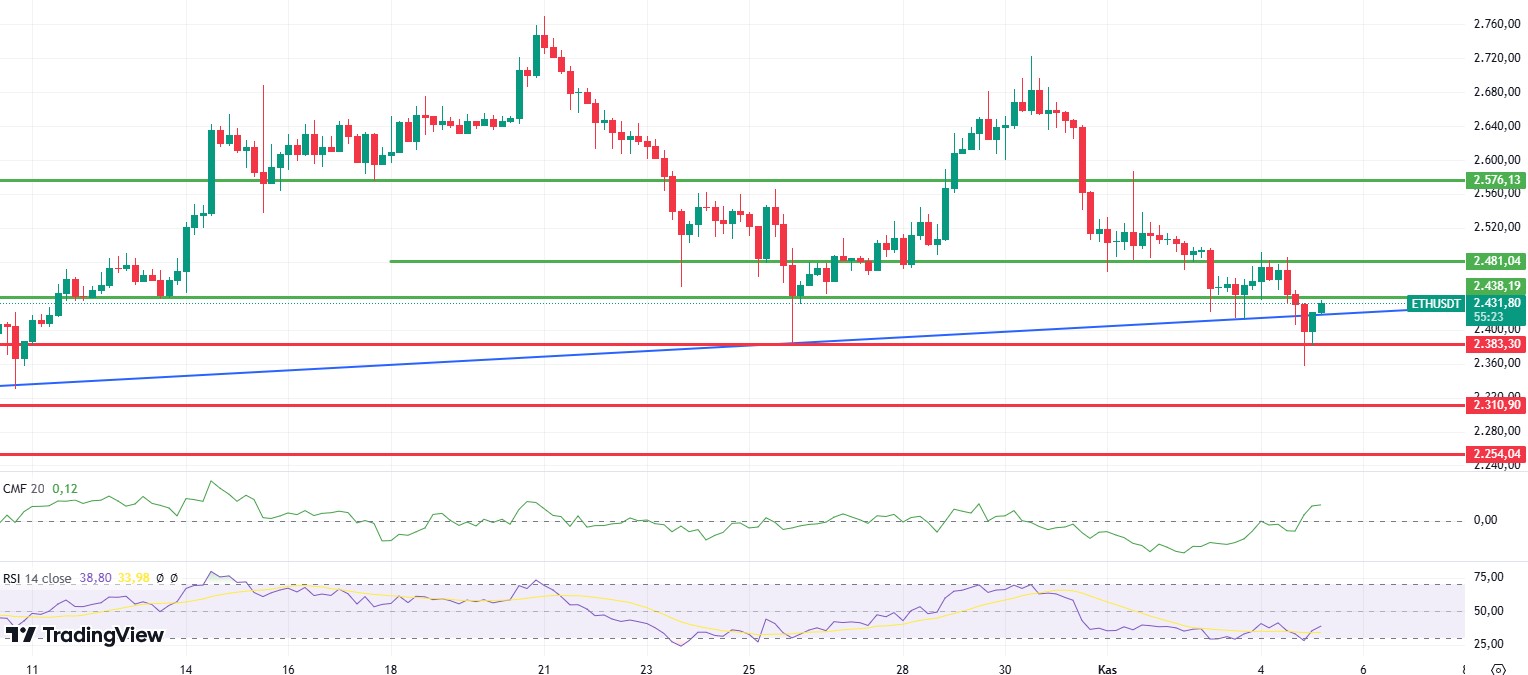
ETH lost the 2,438 level with the decline in Bitcoin in the evening hours and fell to the level of 2,350. Although it rises above the trend line again with the reaction it received from here, it continues to price below the 2,438 level. At first glance, there is a negative divergence on Chaikin Money Flow (CMF). A potential negative divergence on Relative Strength Index (RSI) may also materialize. ETH, which is squeezed between the rising trend line and 2,438 resistance, may decline further from here if it fails to break the 2,438 level. The gain of the 2,438 level may bring rises up to 2,481 levels again. In addition, since today is the US election day, volatility in the market is likely to be quite high, so it would be healthier to base resistance and support levels on closures rather than instant breakouts.
Supports 2,383 – 2,310 – 2,254
Resistances 2,438 – 2,481 – 2,576
LINK/USDT
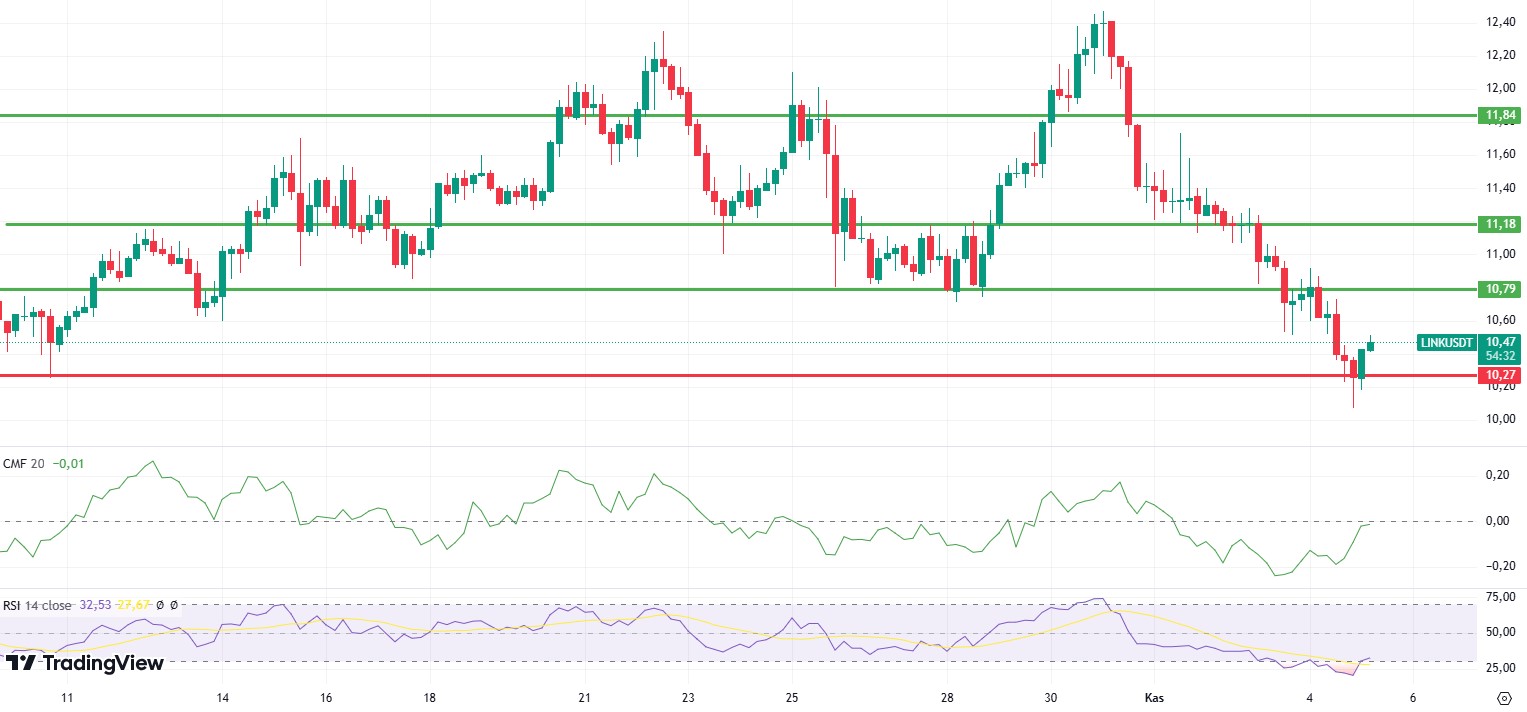
Although LINK was affected by the decline in the market and fell below 10.27, it continues to rise again and continues to price above this level. While the Relative Strength Index (RSI) exiting the oversold zone looks positive, divergences on Chaikin Money Flow (CMF) can be interpreted as negative. Looking at the Ichimoku indicator, it can be said that for LINK, which reacted from the tenkan level, if this level is exceeded, the rises to the next resistance level 10.79 region may continue. Loss of the 10.27 level may continue the decline.
Supports 10.27 – 9.91 – 9.31
Resistances 10.79 – 11.18 – 11.84
SOL/USDT
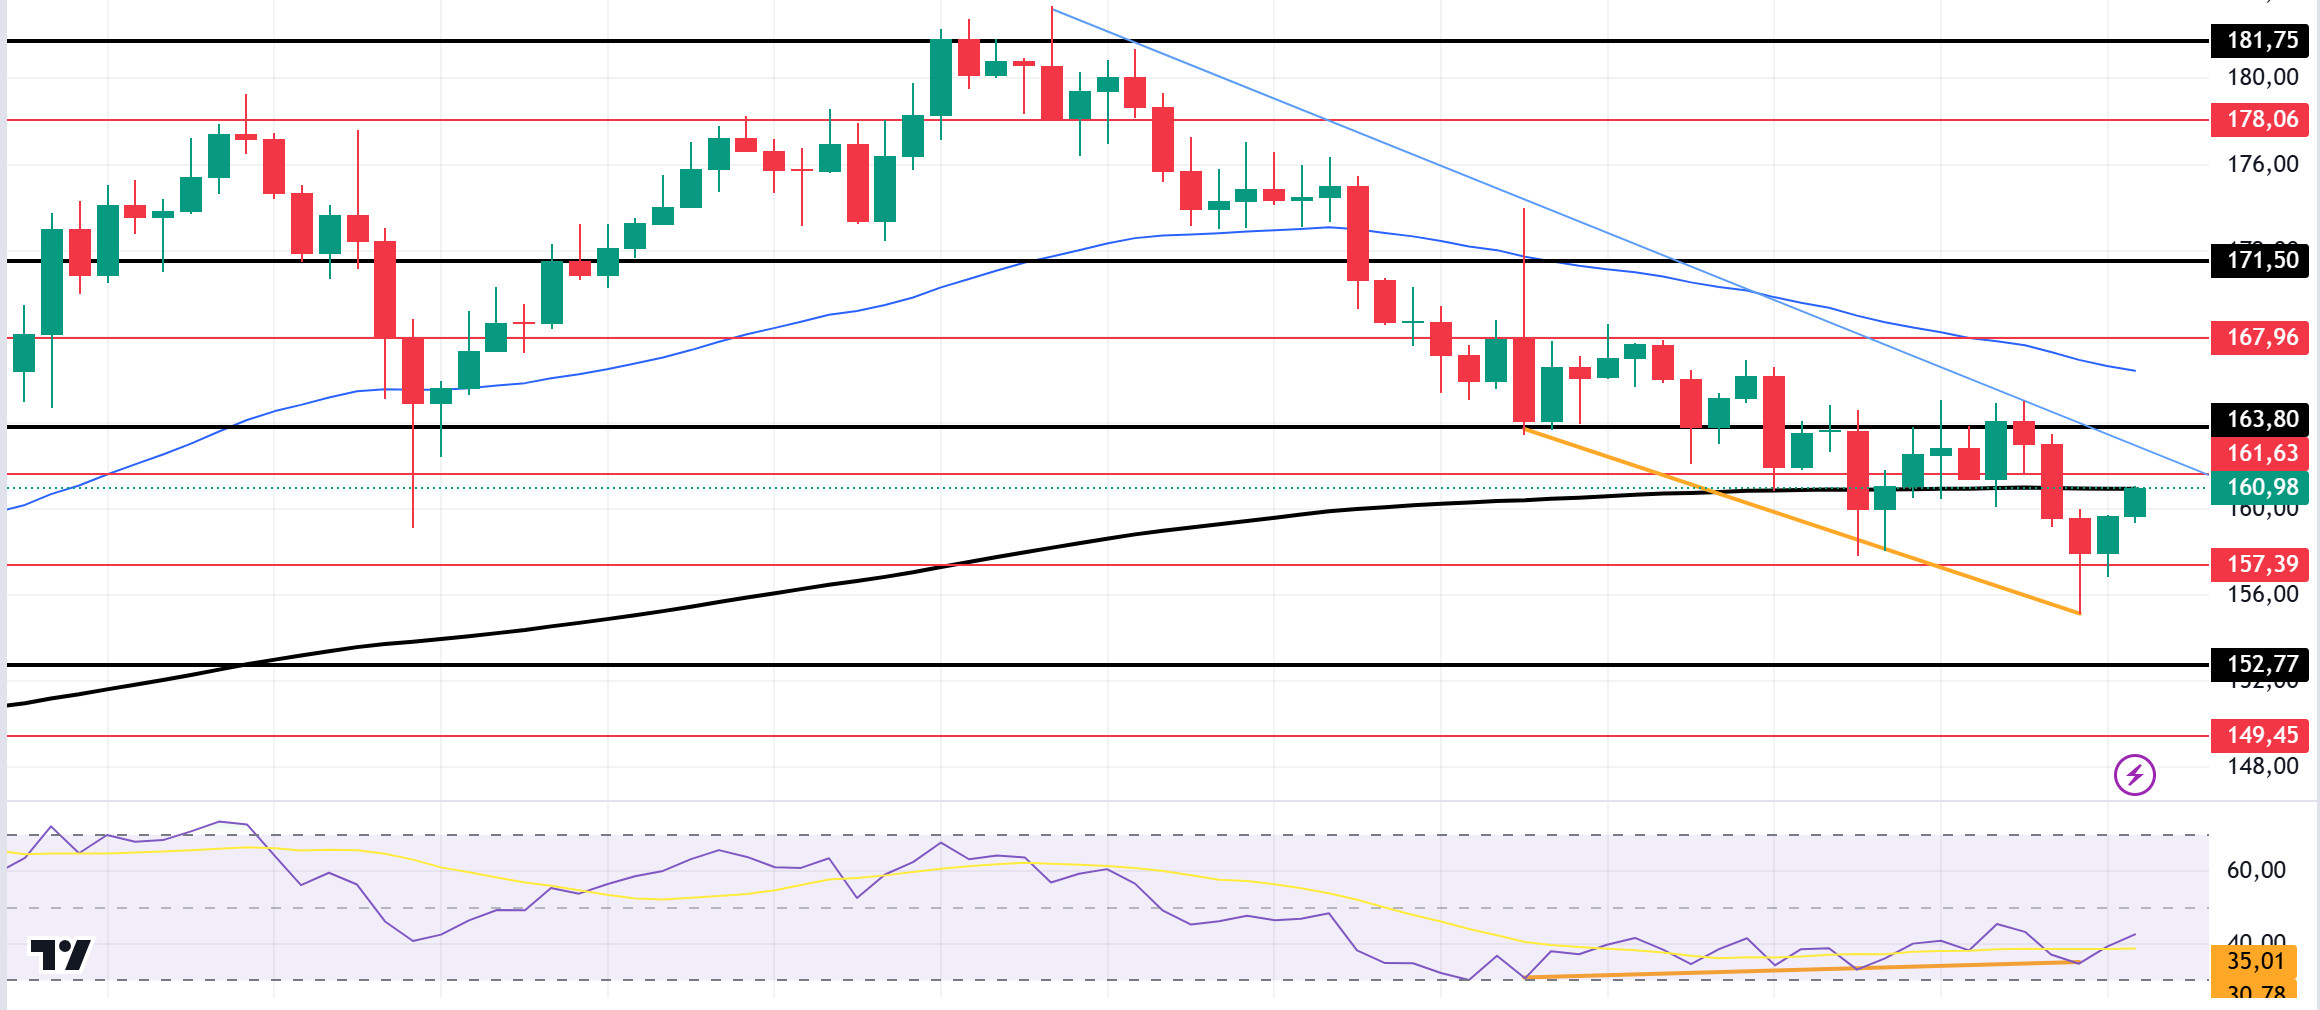
Today’s US Elections could cause a lot of volatility. According to data from Polymarket, Trump is currently 59.1% ahead in the overall results. On the blockchain, Mtgox transferred 32,371 BTC to three new wallets. This may create selling pressure. In the Solana ecosystem, the main liquidation levels are set at $156.7 at the bottom and $166.5 at the top. If the market continues to rise and the price rises to $164.1, about $74.98 million worth of short positions will be liquidated. Conversely, if it enters a downward trend and the price falls to the $154.5 level, long positions worth about $63.72 million will be liquidated. Technically, the SOL broke below the 200 EMA (Black Line) and moved from support to resistance. This could mean that investors are acting with the instinct to protect their investment as the election and interest rate decision will cause extreme volatility. As a matter of fact, Open Interest (OI) continues to fall. Testing the 163.80 level, SOL could not turn it into support and declined. On the 4-hour timeframe, the 50 EMA (Blue Line) continues to be above the 200 EMA (Black Line). This may mean that the rise will continue. Relative Strength Index (RSI)14 is diverging with the price. This points to a potential upside. However, the bearish resistance that started on October 29 has not yet been broken. The 171.50 level appears to be a very strong resistance point in the uptrend driven by both macroeconomic conditions and innovations in the Solana ecosystem. If it rises above this level, the rise may continue strongly. In case of possible political reasons or if the bear market takes over, the 152.77 support level may be triggered again. If the price hits this support level, momentum may increase and a potential bullish opportunity may arise.
Supports 157.39 – 152.77 – 149.45
Resistances 161.63 – 163.80 – 167.96
ADA/USDT
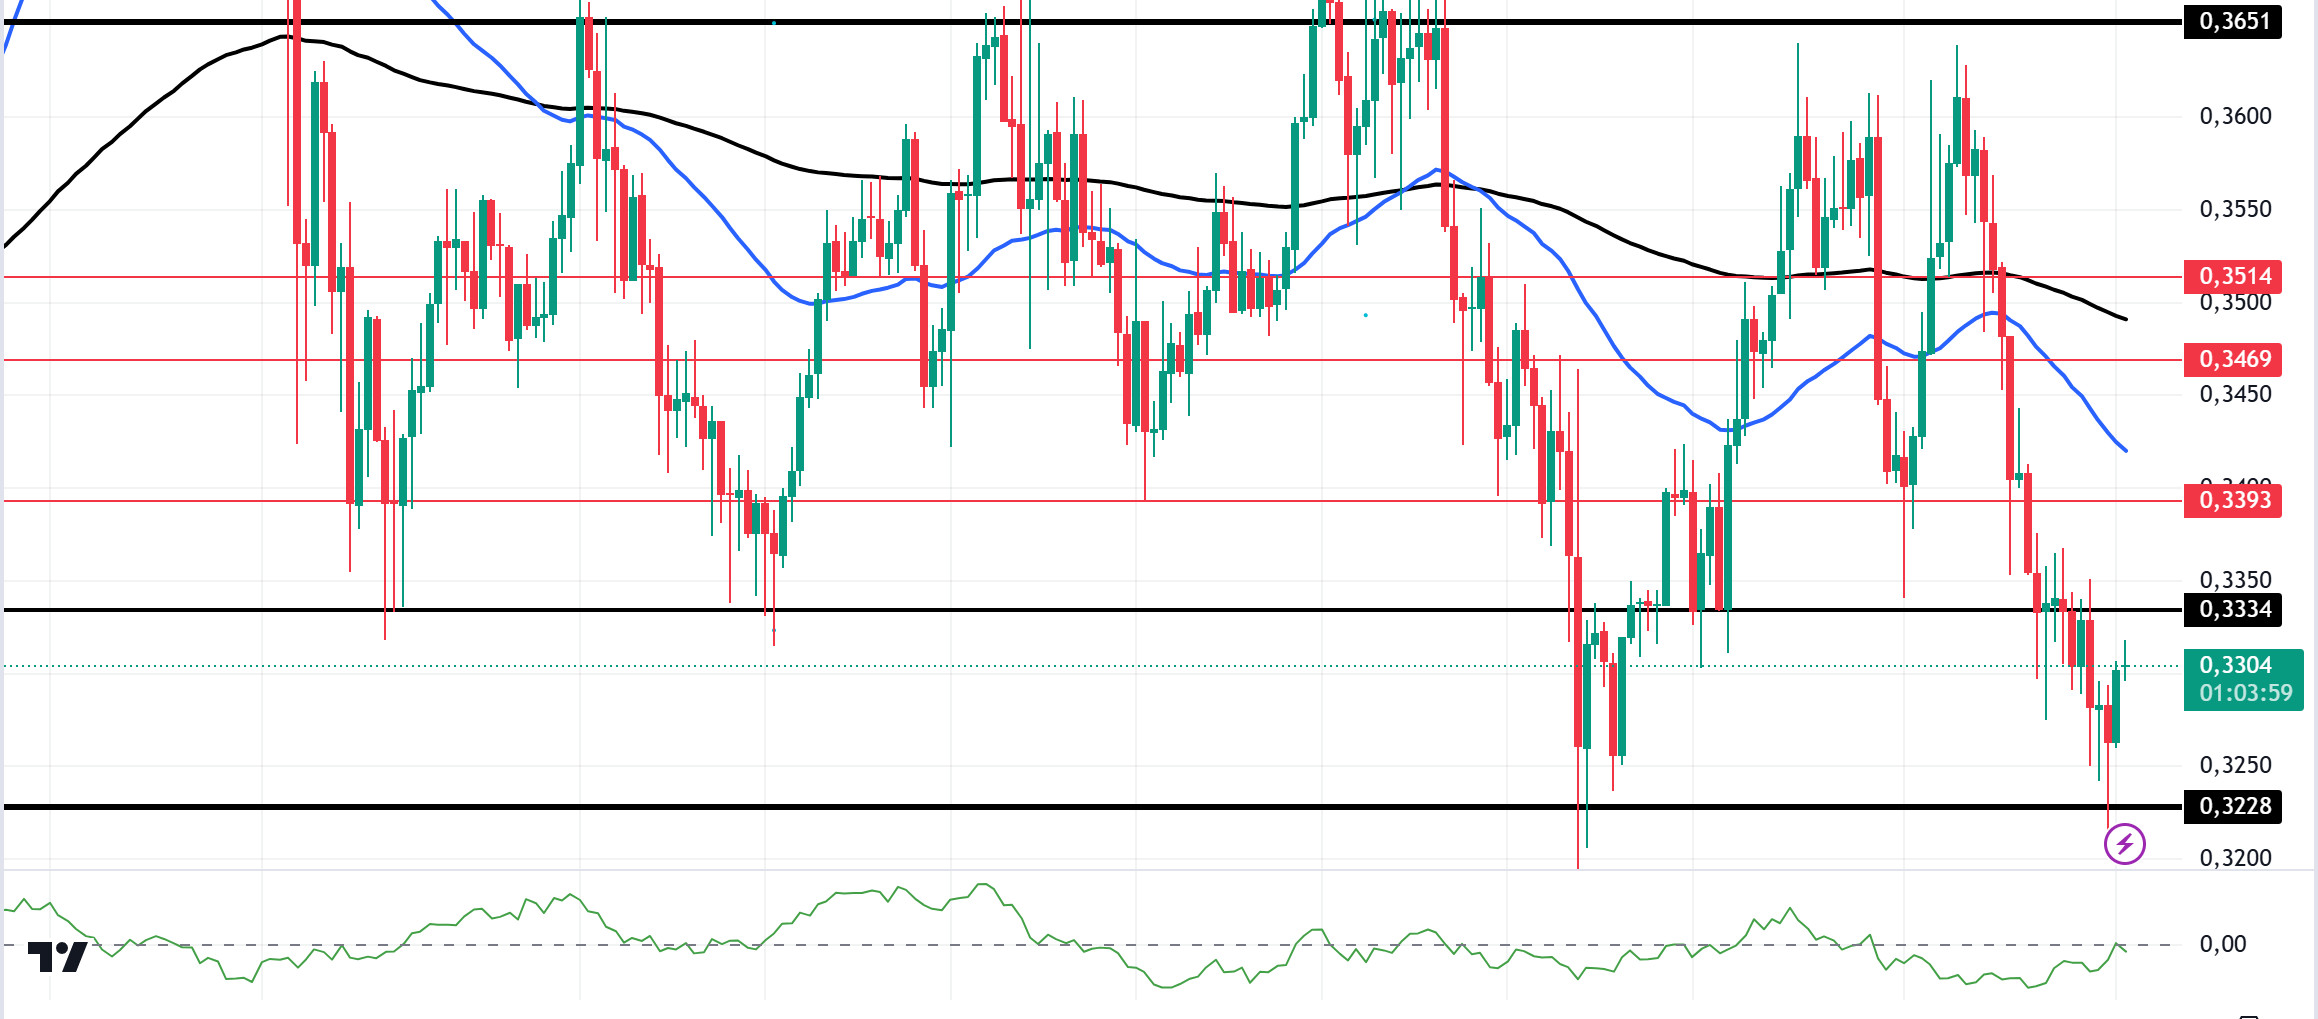
Today’s US Elections could cause a lot of volatility. According to data from Polymarket, Trump is currently 59.1% ahead in the overall results. On the blockchain, Mtgox transferred 32,371 BTC to three new wallets. This may create selling pressure. In the Cardano ecosystem, the Foundation plans to sell $500 million of ADA. Even if this amount is sold gradually, it will cause concerns among investors and there may be a fluctuation in the price. The community calls for balanced budgeting for stability amid market shifts. Technically, it has been accumulating since October 1. On the 4-hour chart, ADA is pricing below the 50 EMA (Blue Line) and 200 EMA (Black Line). However, the 50 EMA continues to hover below the 200 EMA. This shows us that the trend is bearish. At the same time, when we examine the Chaikin Money Flow (CMF)20 indicator, we can say that money inflows have increased slightly, albeit in the negative zone. Given all this, ADA may test the 0.3228 level once again. In the decline that will be experienced due to the macroeconomic data and negativities in the ecosystem, the support level of 0.3228 should be followed. It may be appropriate to buy when it comes to this price level. In the rises due to developments in the ecosystem, if the 0.3331 level is broken in a voluminous way, the upward acceleration will increase even more, and the 0.3651 level should be followed as a retracement place.
Supports 0.3228 – 0.3131 – 0.3064
Resistances 0.3334 – 0.3393 – 0.3469
AVAX/USDT
AVAX, which opened yesterday at 23.53, fell by about 3.5% during the day and closed the day at 22.72. US presidential elections will be held today. Volatility can be expected to be high during and after the election. News flows from the Middle East will be important for the market.
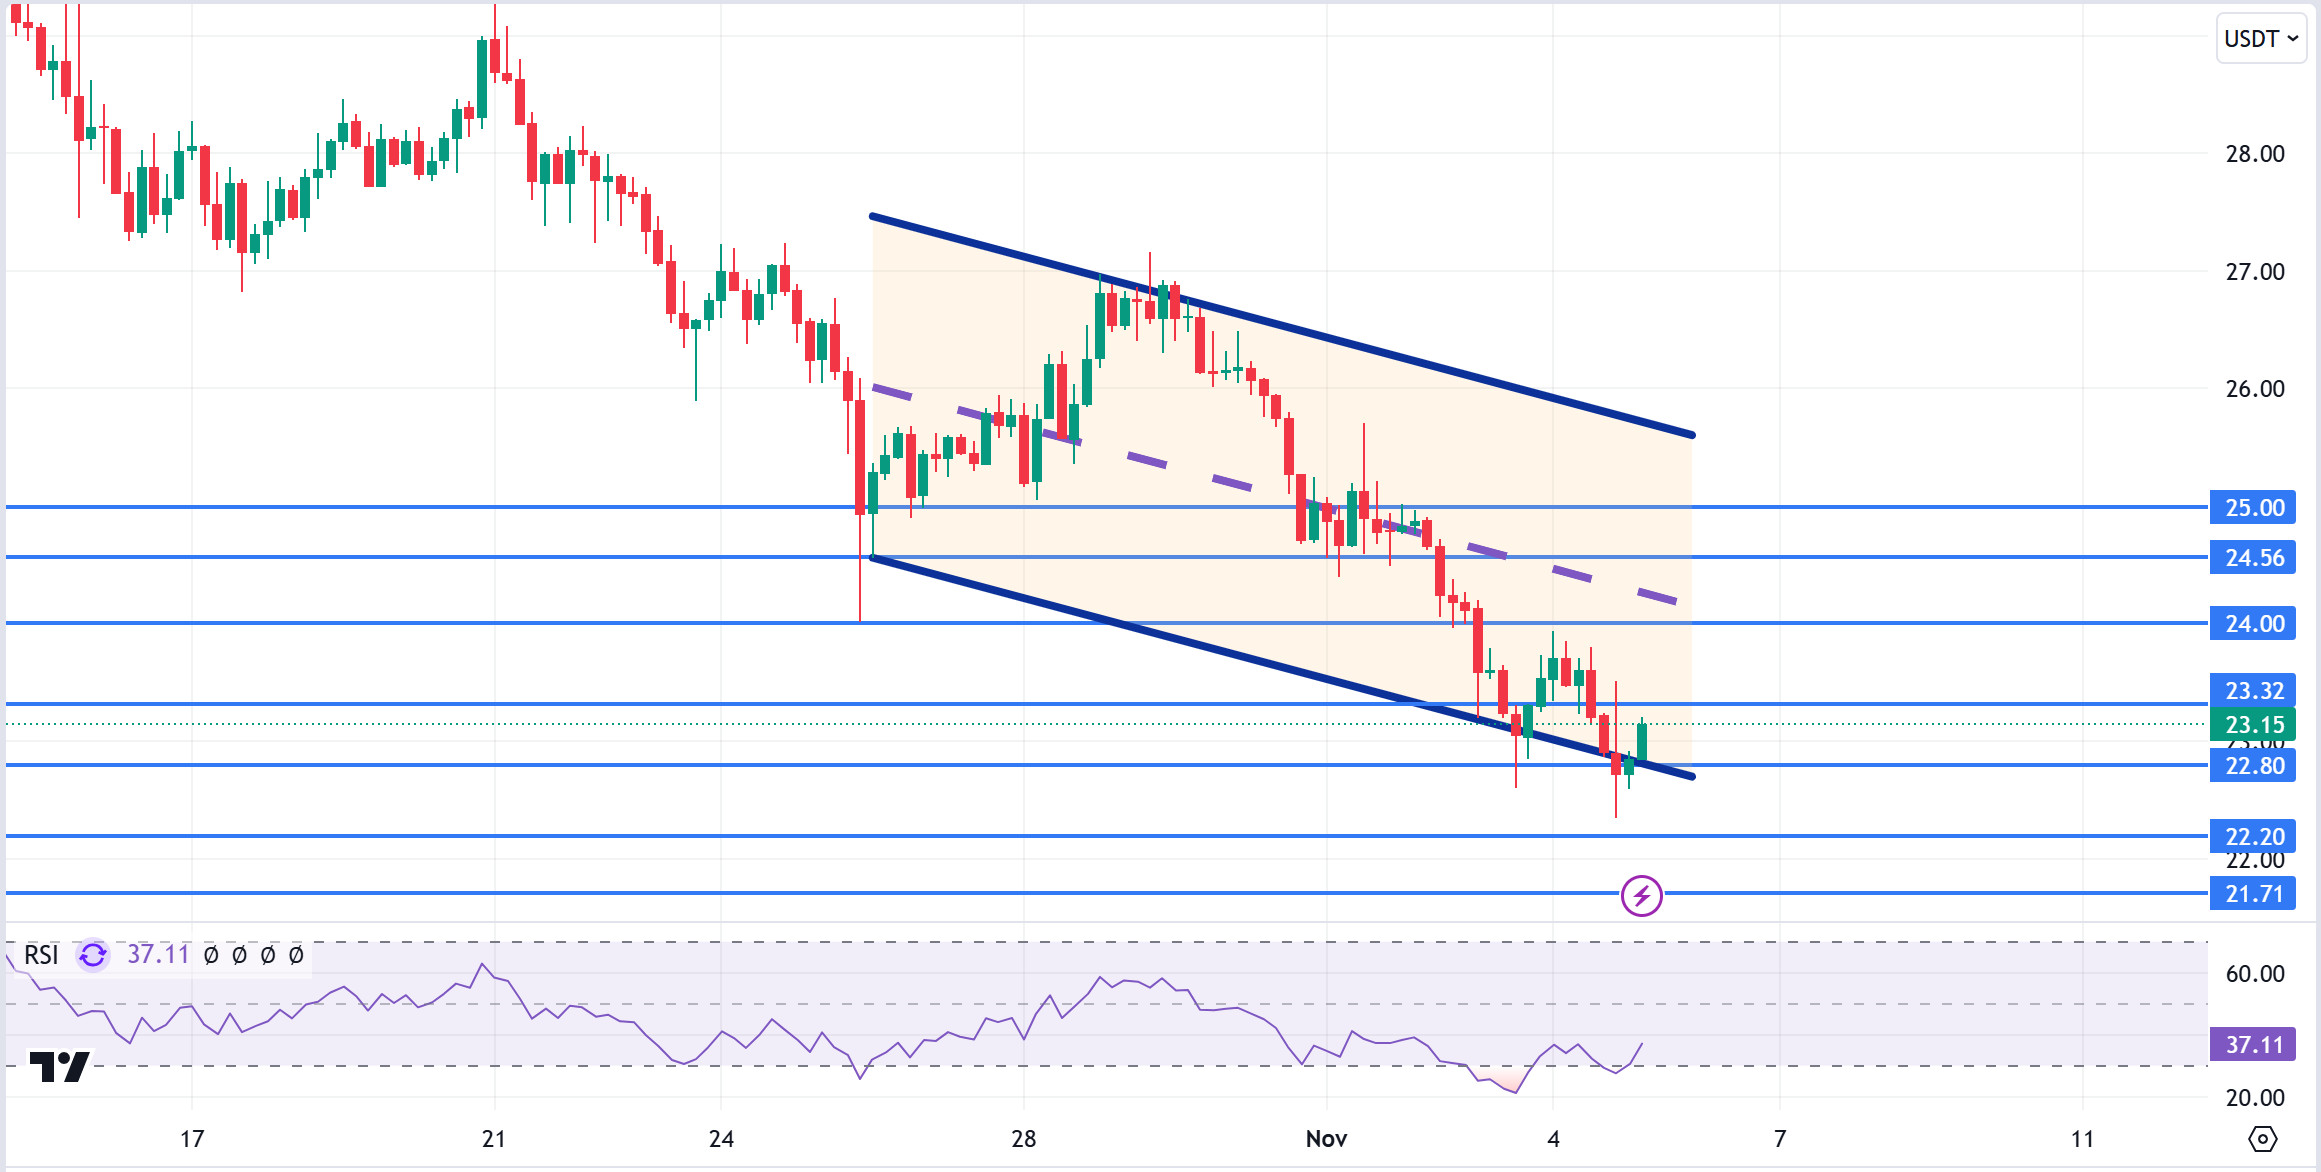
AVAX, currently trading at 23.15, is moving within the bearish channel on the 4-hour chart. It is in the lower band of the bearish channel and with a Relative Strength Index value of 37, it can be expected to rise slightly from these levels. In such a case, it may test the 23.32 and 24.00 resistances. On the other hand, selling pressure may increase if there is news of increasing tension in the Middle East. In such a case, it may test 22.80 support. As long as it stays above 22.80 support during the day, the desire to rise may continue. With the break of 22.80 support, sales may increase.
Supports 22.80 – 22.20 – 21.71
Resistances 23.32 – 24.00 – 24.56
TRX/USDT
TRX, which started yesterday at 0.1651, fell about 1.5% during the day and closed the day at 0.1629. Today, the market will be closely following the news flows regarding the presidential elections in the US and the tension in the Middle East.
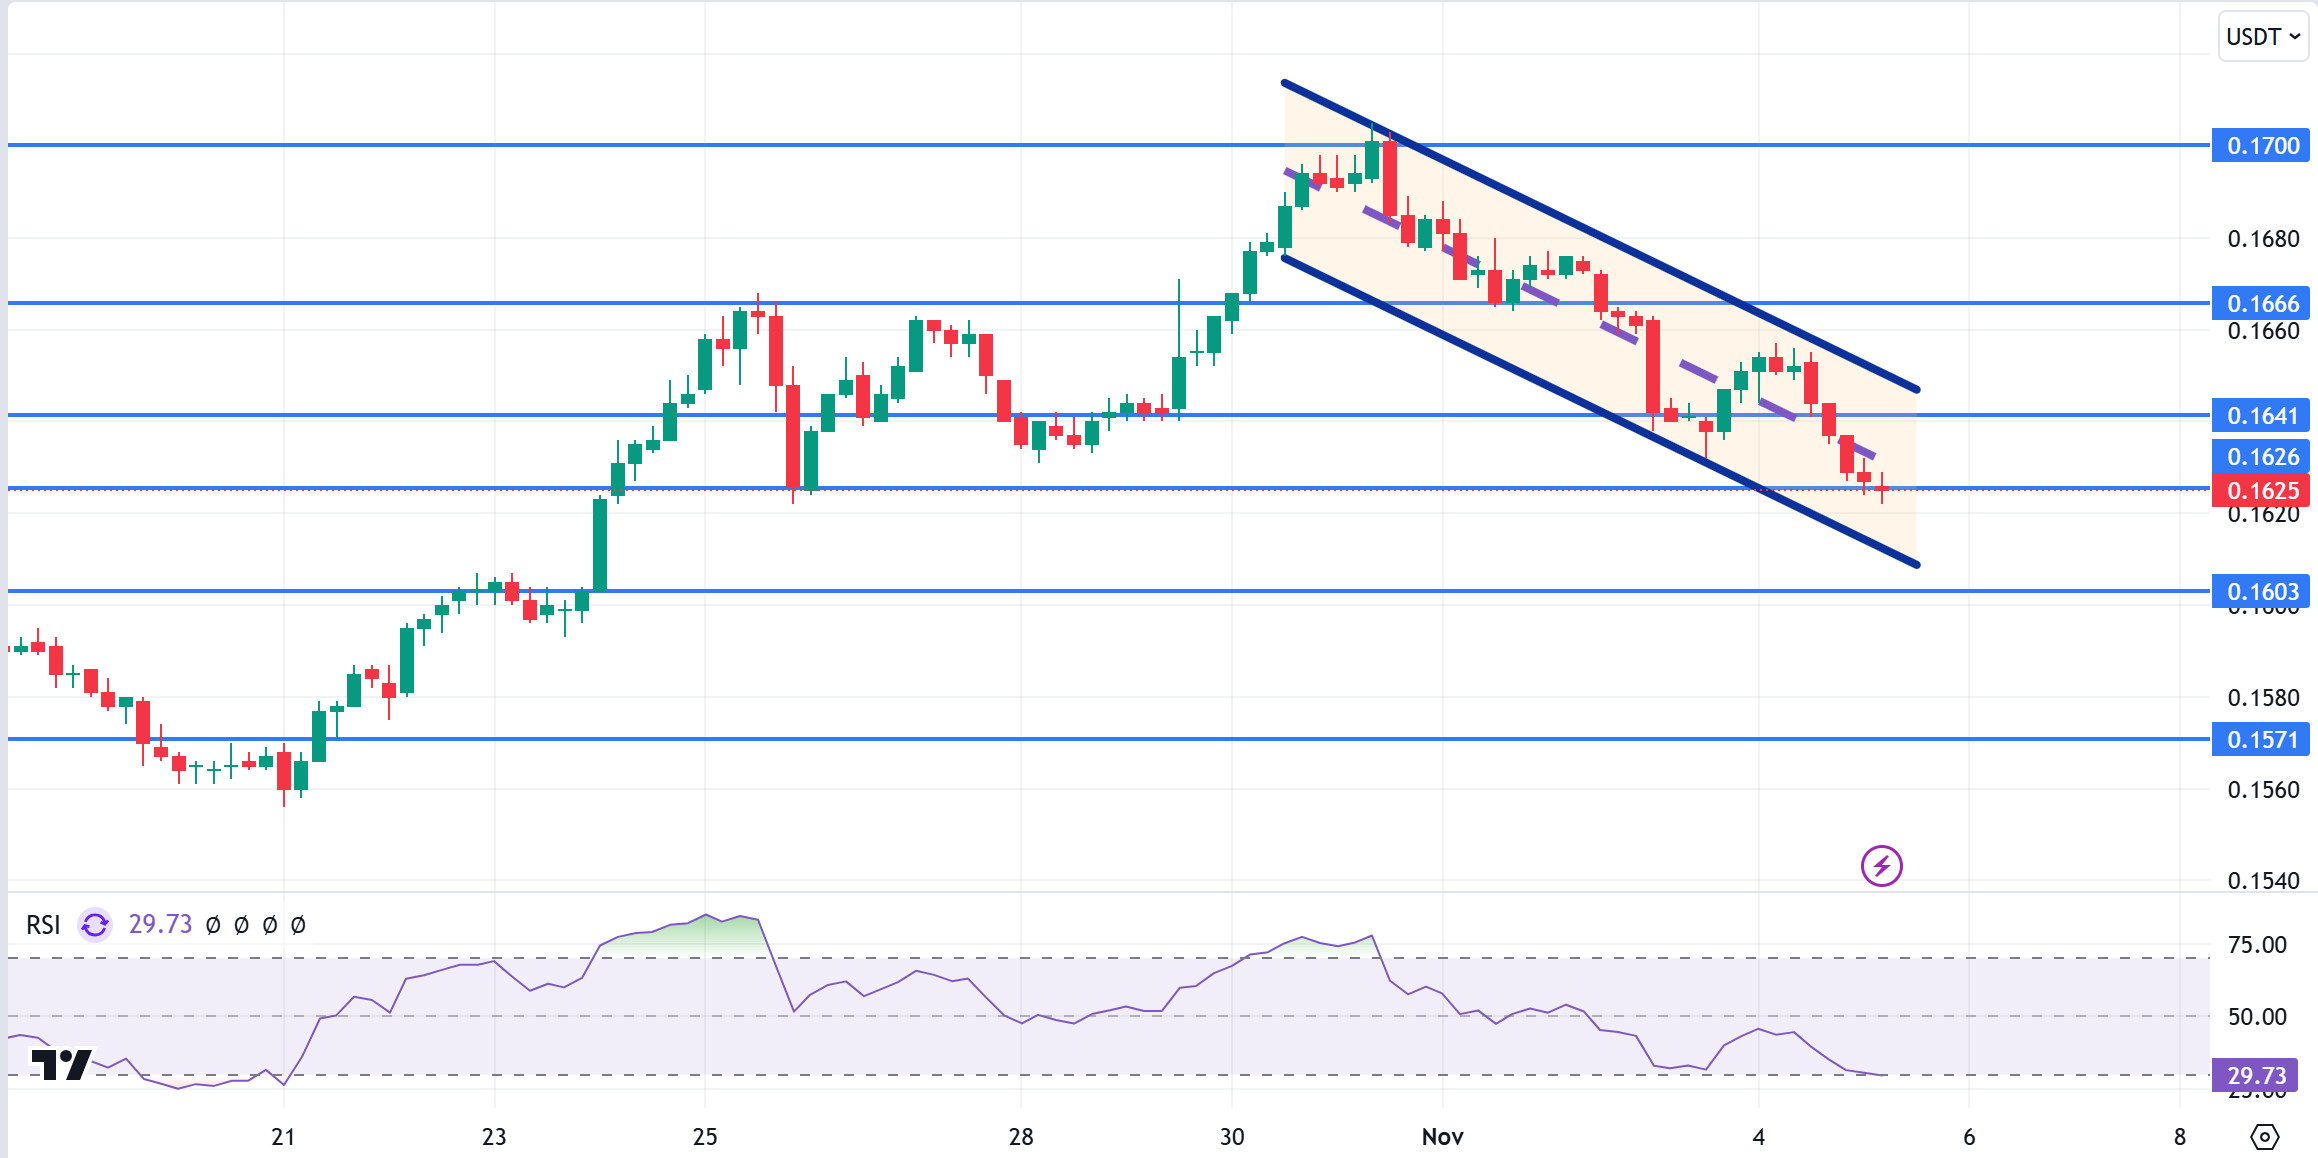
TRX, currently trading at 0.1625, is in the middle band of the bearish channel on the 4-hour chart. The Relative Strength Index value is in the oversold zone with 29 and can be expected to rise slightly from its current level. In such a case, it may move to the upper band of the channel and test the 0.1641 resistance. However, if it cannot close the candle above 0.1641 resistance, it may test 0.1603 support with the sales reaction that may occur. As long as TRX stays above 0.1482 support, the desire to rise may continue. If this support is broken downwards, sales can be expected to increase.
Supports 0.1626 – 0.1603 – 0.1571
Resistances 0.1641 – 0.1666 – 0.1700
DOT/USDT
Polkadot (DOT) is preparing to take the JAM protocol to the implementation phase with the Sub0 Reset event. The event, which will be held in Bangkok on November 9-11, 2024, aims to increase Polkadot’s flexibility and is considered as a critical step to achieve a balance of scalability and consistency in Web 3.0. The expanding use cases of Polkadot’s core infrastructure could accelerate the development of the network by offering more flexibility to projects in the ecosystem.
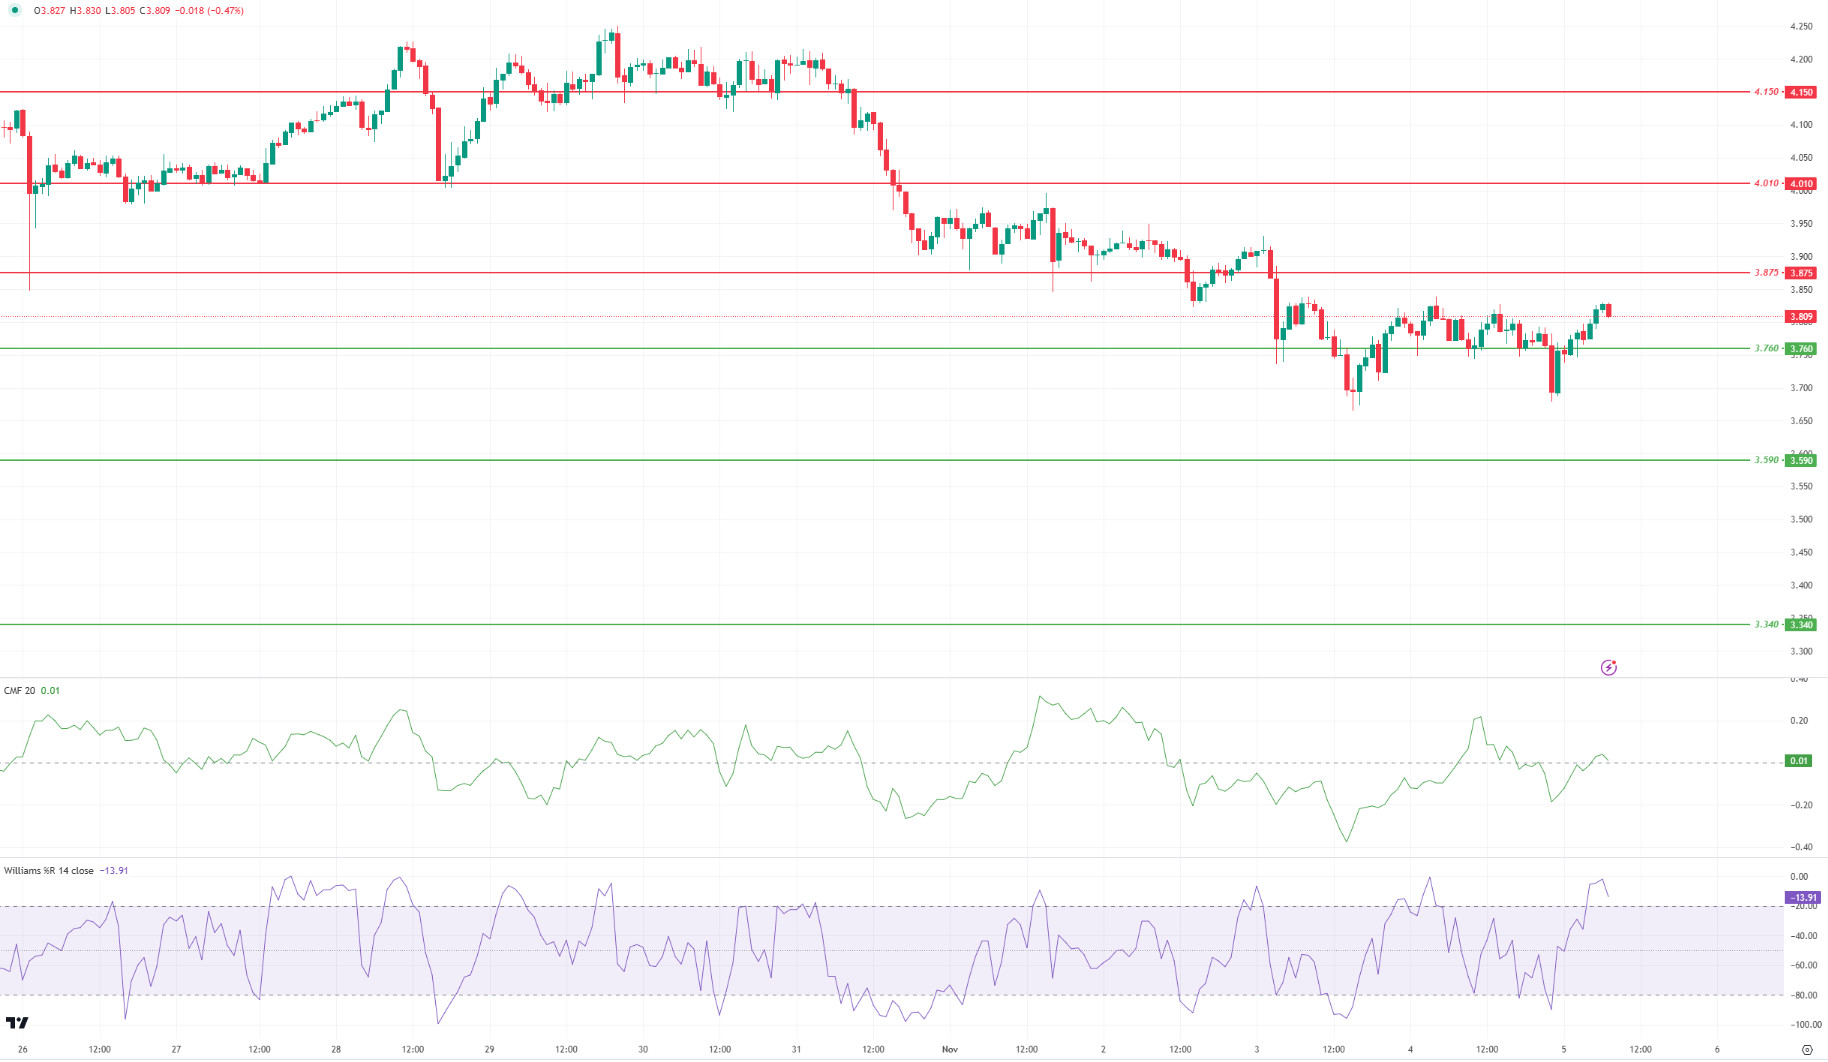
Technically, DOT is hovering above the 3.760 support level. According to the Chaikin Money Flow (CMF) oscillator, we can say that buyer pressure is stronger. The Williams %R oscillator is hovering above the -20 level. In this context, the price may move towards the 3.875 resistance level. In the negative scenario, if the price maintains below the 3.760 level, it may retreat towards the next support level of 3.590.
Supports 3,760 – 3,590 – 3,340
Resistances 3.875 – 4.010 – 4.150
SHIB/USDT
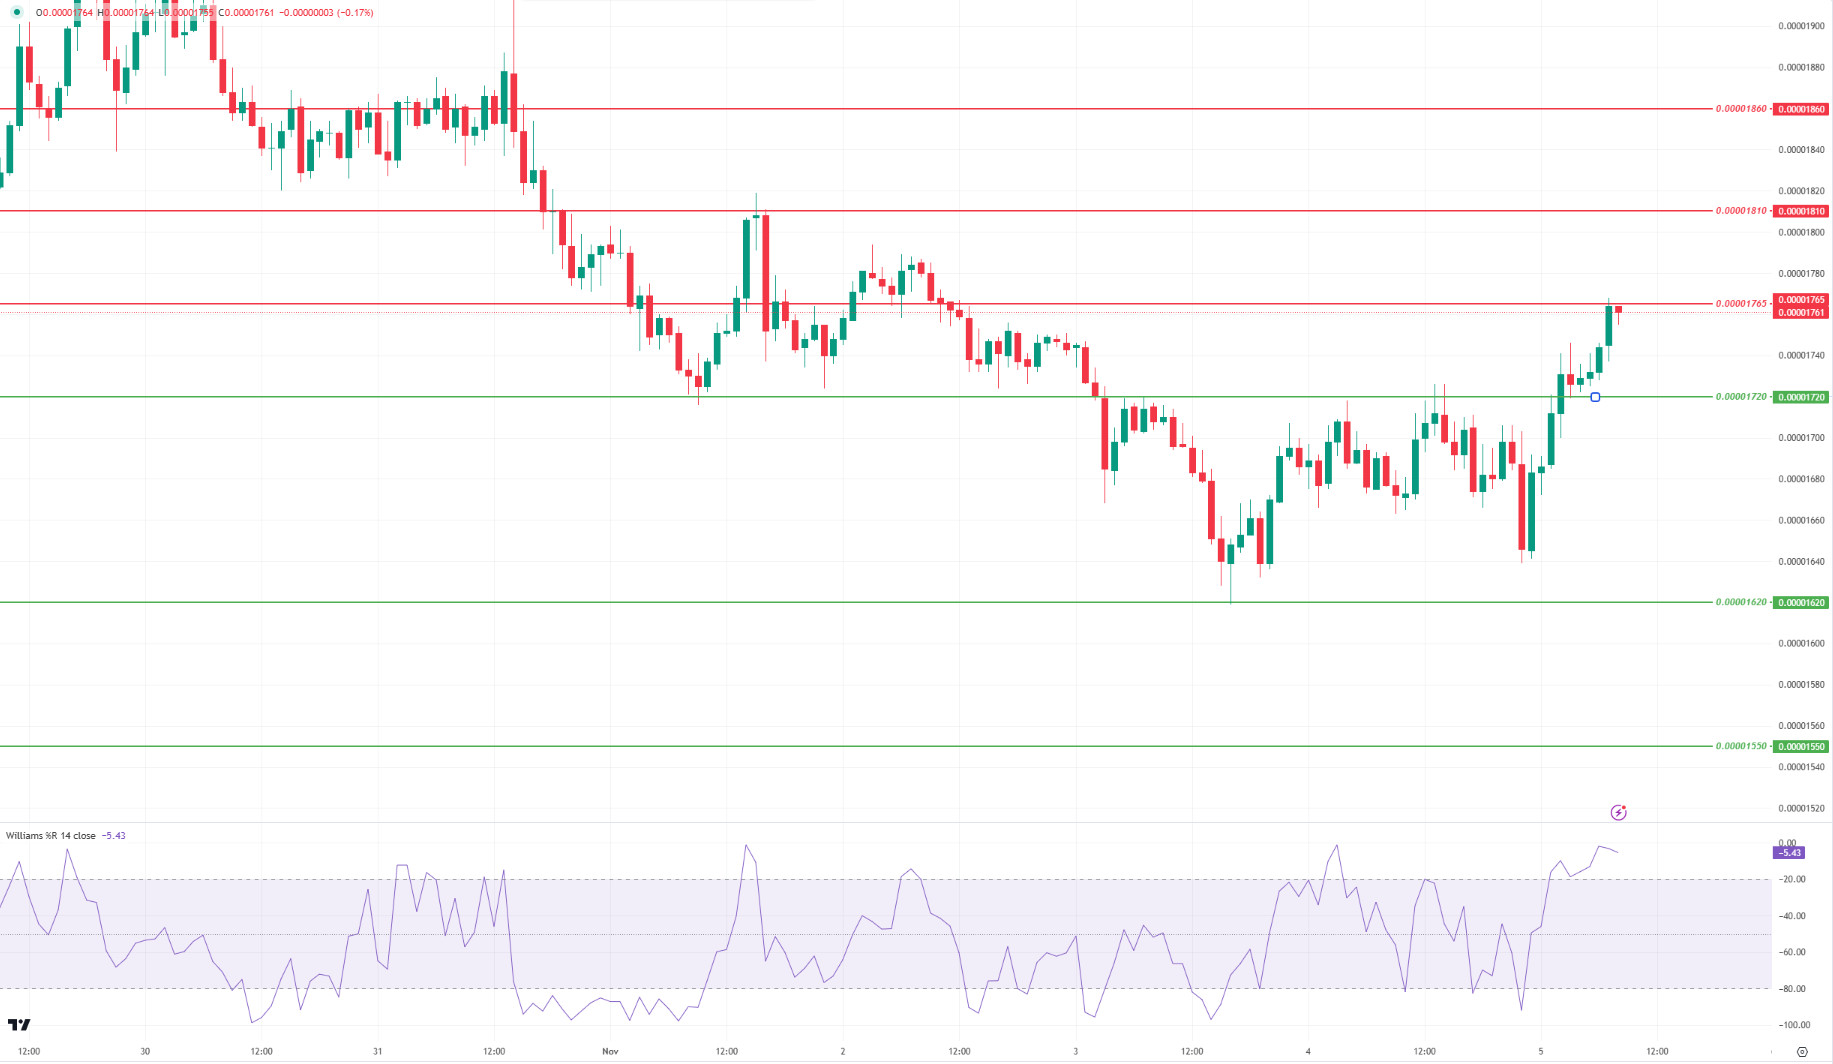
When we examine the chart of Shiba Inu (SHIB), we see that the price broke the 0.00001720 resistance level upwards. The Williams %R oscillator is hovering above the -20 level. In this context, if the price maintains above the 0.00001765 resistance level, it may move towards the next resistance level of 0.00001810. On the other hand, if the price fails to break the selling pressure at the 0.00001765 resistance level, it may want to test the 0.00001720 level again.
Supports 0.00001720 – 0.00001620 – 0.00001550
Resistances 0.00001765 – 0.00001810 – 0.00001860
LEGAL NOTICE
The investment information, comments and recommendations contained herein do not constitute investment advice. Investment advisory services are provided individually by authorized institutions taking into account the risk and return preferences of individuals. The comments and recommendations contained herein are of a general nature. These recommendations may not be suitable for your financial situation and risk and return preferences. Therefore, making an investment decision based solely on the information contained herein may not produce results in line with your expectations.


