MARKET SUMMARY
Latest Situation in Crypto Asset
| Assets | Last Price | 24h | Dominance | Market Cap |
|---|---|---|---|---|
| BTC | $67,244.00 | 3.00% | 57.40% | $1.33 T |
| ETH | $2,619.00 | 1.03% | 13.63% | $315.10 B |
| SOLANA | $154.42 | 0.35% | 3.14% | $72.52 B |
| XRP | $0.5429 | -0.03% | 1.33% | $30.73 B |
| DOGE | $0.1183 | 2.48% | 0.75% | $17.31 B |
| TRX | $0.1593 | 0.48% | 0.60% | $13.78 B |
| CARDANO | $0.3563 | -0.32% | 0.54% | $12.45 B |
| AVAX | $27.73 | -2.64% | 0.49% | $11.28 B |
| SHIB | $0.00001825 | 0.58% | 0.47% | $10.75 B |
| LINK | $11.31 | -0.49% | 0.31% | $7.09 B |
| DOT | $4.377 | 0.01% | 0.29% | $6.59 B |
*Prepared on 10.16.2024 at 06:00 (UTC)
WHAT’S LEFT BEHIND
Tesla’s Bitcoin Transfers
Tesla has raised eyebrows by transferring all of its Bitcoin (BTC) holdings, worth approximately $765 million, to unknown wallets. This notable move involves the transfer of 11,500 BTC to new addresses in 26 separate transactions, and these addresses are not linked to active crypto exchanges.
Trump’s Impact
Last night, Trump excited investors by saying on his Twitter account that Bitcoin is “the currency of the future”. After this statement, the price of Bitcoin started to rise rapidly. After Trump shared his thoughts on Bitcoin, there was a significant movement in the cryptocurrency market.
Bitcoin company Blockstream invests $210 million
Blockstream, the company founded by Adam Back, one of the names featured in last week’s Satoshi documentary, has received a $210 million investment. The funds from the investment round led by Fulgur Ventures will be spent on more Bitcoin purchases, layer 2 technologies and mining activities.
HIGHLIGHTS OF THE DAY
Important Economic Calendar Data
| Time | News | Expectation | Previous |
|---|---|---|---|
| Arbitrum (ARB): 92.65M Token Unlock | |||
| VeChain (VET): VebetterDAO AMA | |||
| 12:30 | US Import Price Index (MoM) (Sep) | -0.3% | -0.3% |
INFORMATION
*The calendar is based on UTC (Coordinated Universal Time) time zone. The economic calendar content on the relevant page is obtained from reliable news and data providers. The news in the economic calendar content, the date and time of the announcement of the news, possible changes in the previous, expectations and announced figures are made by the data provider institutions. Darkex cannot be held responsible for possible changes that may arise from similar situations.
MARKET COMPASS
In global markets, statements from the candidates ahead of the upcoming US presidential election are being monitored, while China is expected to take steps to support its economy. Yesterday, after the US stock markets recorded losses, especially Nasdaq, following the balance sheets of some technology companies that failed to meet expectations, the picture in Asian indices is mixed but sales are predominant.
Digital assets continue to maintain their positive sentiment. Despite the recent activity on the Tesla wallet and the volatility seen during European trading yesterday, major cryptocurrencies managed not to give back the gains. The news that polls suggest Trump is more likely to win the election and Polymarket data, along with China’s stimulus, which is far from satisfying the markets, formed the basis for the rises in digital assets. Meanwhile, China is expected to announce tomorrow how it will support the real estate sector. On the Middle East front, we see that there is no new news escalating tensions, but there are reports that the Biden administration may not be able to reconcile with Israel on every issue before the election. This front continues to remain under the scrutiny of the markets.
We maintain our view that the long-term direction for digital assets remains to the upside. On the other hand, the fact that BTC in particular is at critical resistances and has held on to its gains without a correction after recent rallies suggests that the potential for a short-term downside pullback remains. Nevertheless, as we mentioned in yesterday’s analysis, it is important to keep in mind that pullbacks that do not follow a rally may indicate that the possibility of a correction has diminished.
TECHNICAL ANALYSIS
BTC/USDT
The month of October, which is called the bullish month, continues on its way with the increase in market optimism as we reach the middle of the month. In this period when positive messages on behalf of the market increased with the approach of the US elections, Tesla, the company owned by Elon Musk, transferred Bitcoin assets to another wallet, although it creates a question mark, it does not seem to create sales pressure in the market for the moment. We can say that volatility in the markets will increase in the coming days as the election race heats up.
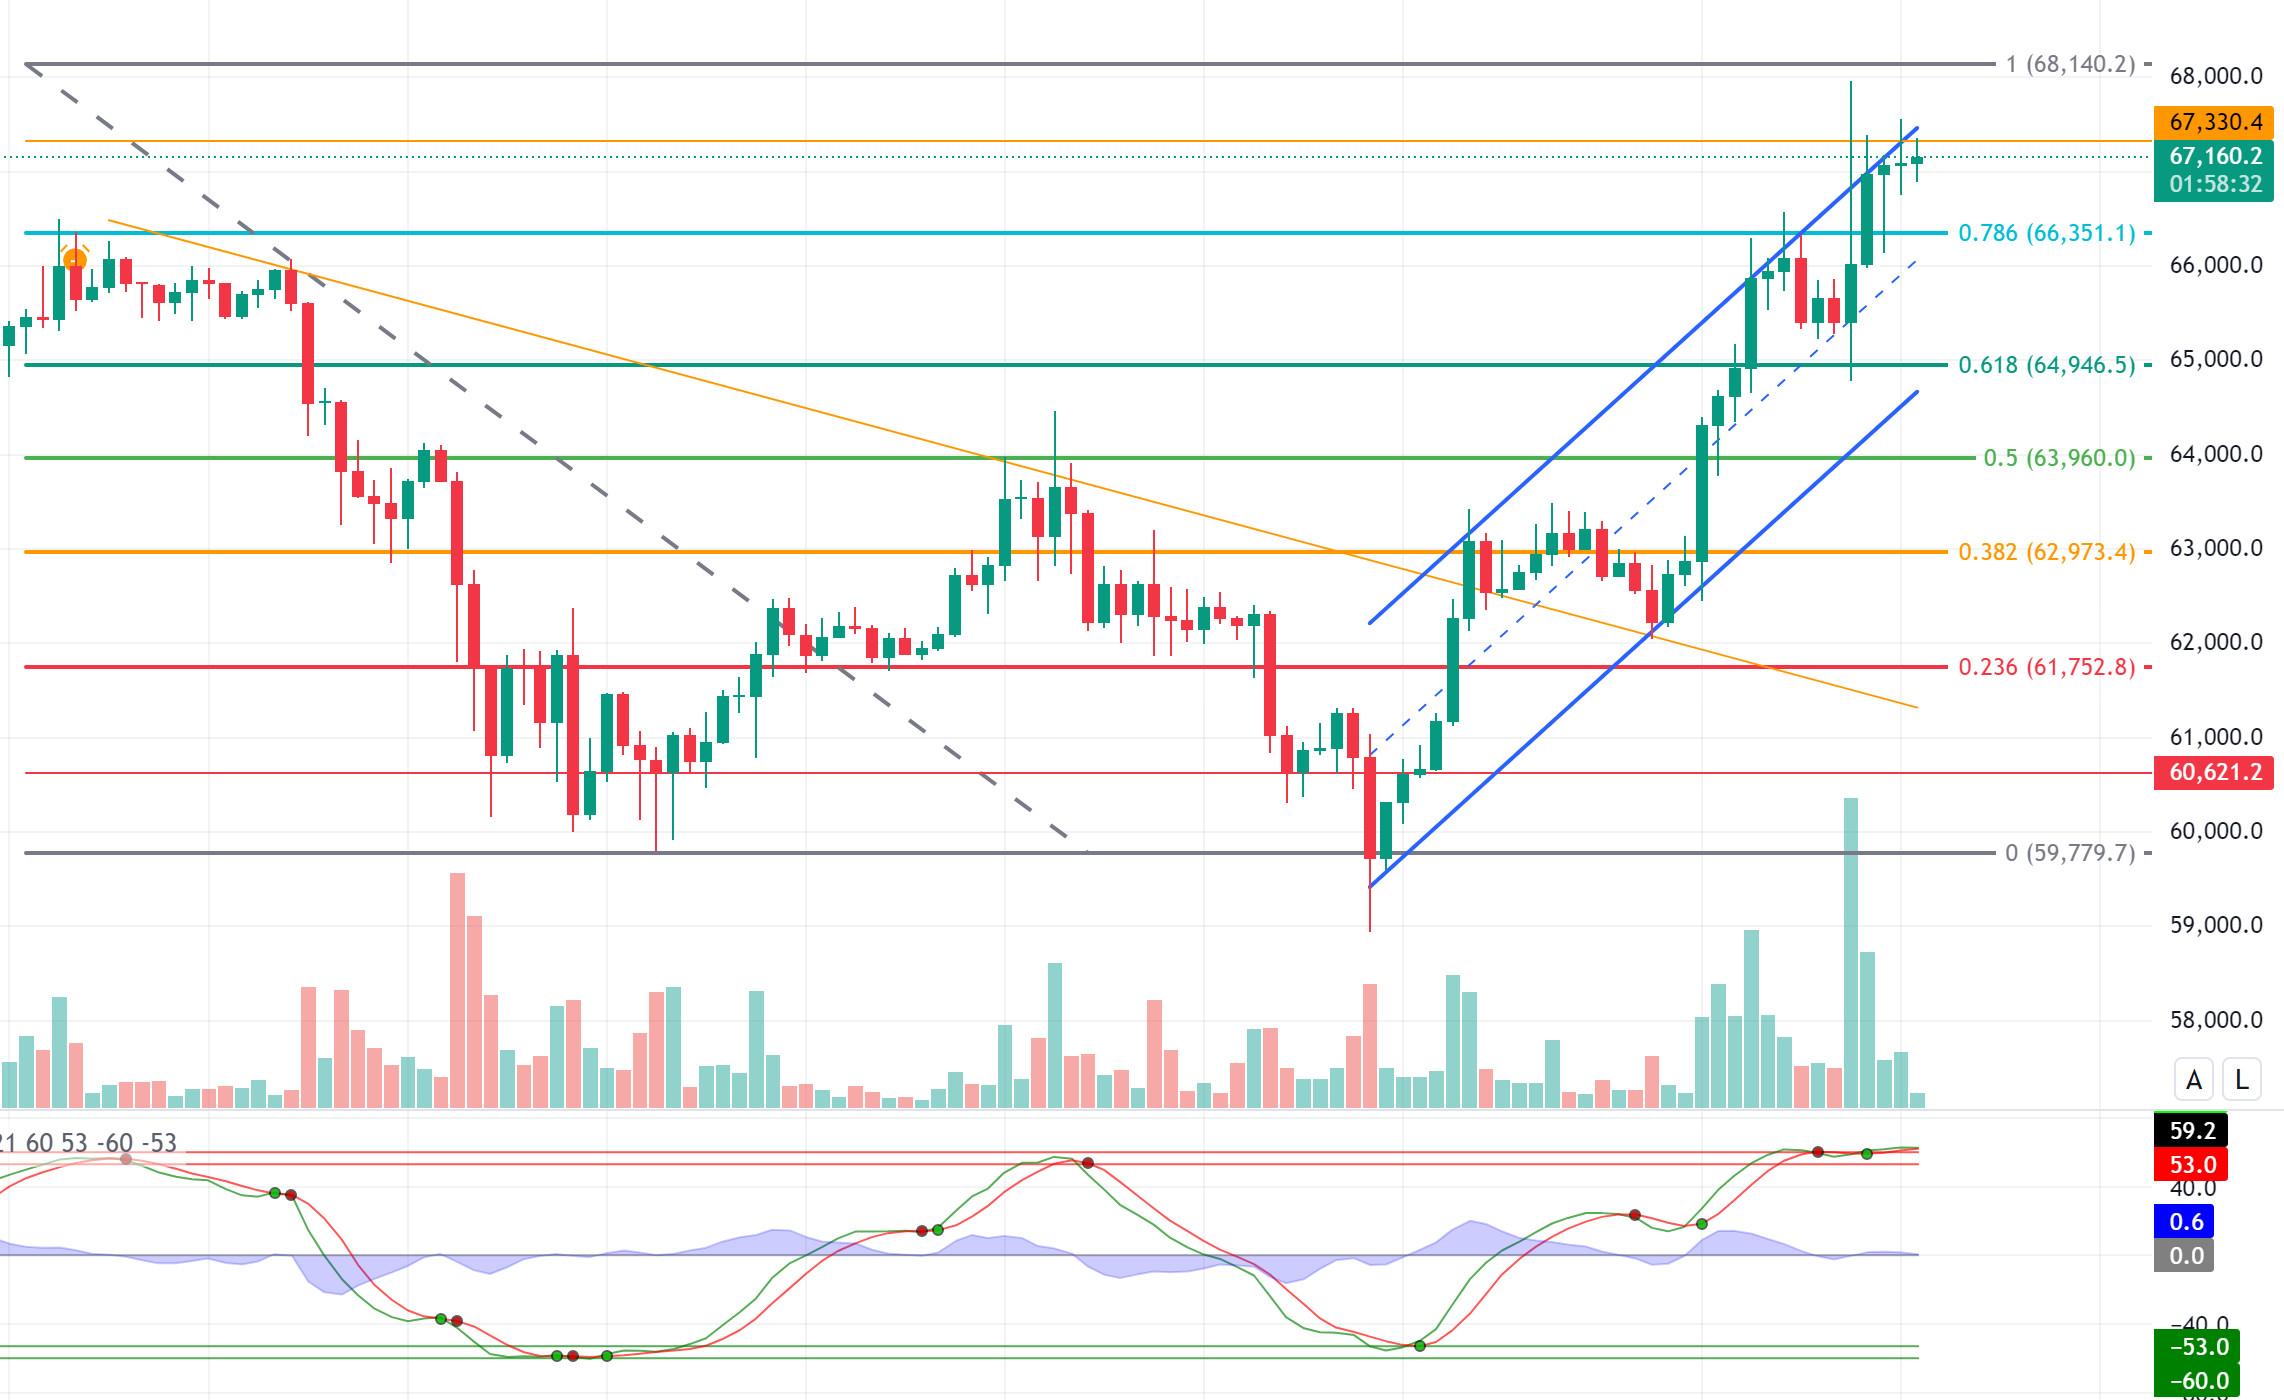
On the BTC 4-hour technical analysis chart, we see that the price continues its upward movement at the upper line of the bullish channel. BTC, which rose as high as 67,900 with the breakout of the fibonacci 0.786 (66,350) resistance level, then experienced a retracement towards our intermediate support of 67,300. It is the 1 (68,140) resistance level that we expect to meet us in the continuation of upward movements. We see that technical indicators occasionally generate buy signals on hourly charts even in the overbought zone as a result of market optimism and increased risk appetite. Before a potential correction, liquidation may retest the 68,000 level where “short” trades are clustered on the weekly chart. In case of a pullback, the support level we will encounter will be 0.786 (66,350).
Supports 66,350 – 64,946 – 63,960
Resistances 67,330 – 68,140 – 69,678
ETH/USDT
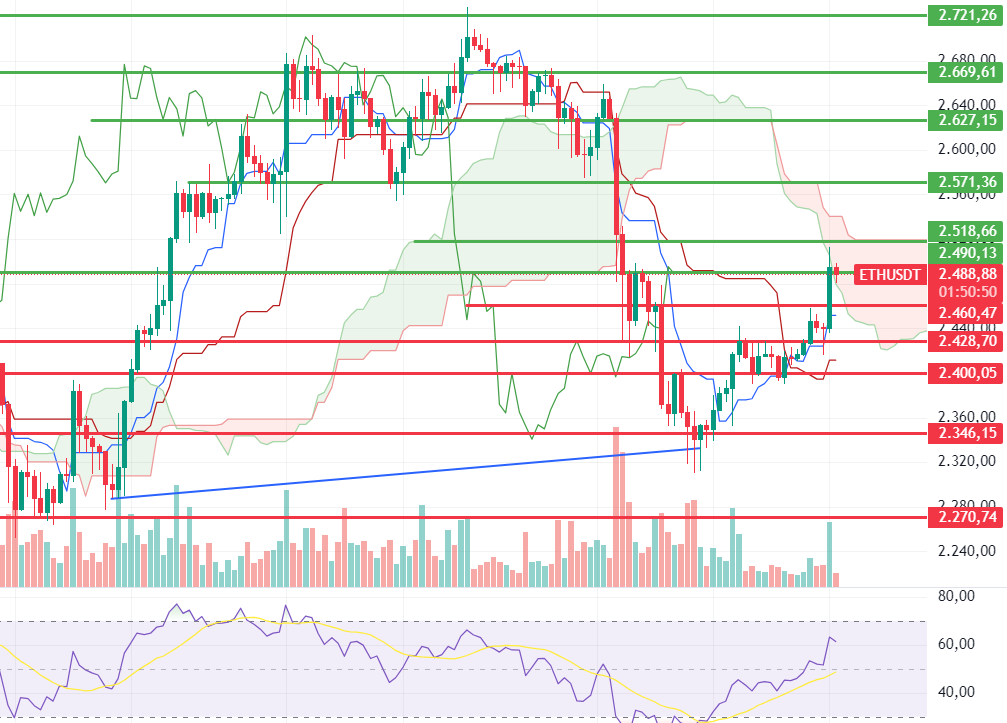
With yesterday’s volatility in Ethereum, first 2,669 resistance and then 2,571 support were tested. Priced above 2,600 again after testing the 2,571 level, this rise in ETH has come from the spot channel. However, in the last 4-hour candle, it is seen that the price has risen despite the increase in spot sales and futures purchases have increased. For this reason, it can be said that CMF has turned positive again for ETH, which may be slightly negative – horizontal during the day, while RSI is neutral. The 2,571 level stands out as the main support and the break of the level may deepen the decline. The 2,669 level is the most important resistance point and it can be said that the positive trend may continue with its break.
Supports 2,571 – 2,490 – 2,460
Resistances 2,669 – 2,731 – 2,815
LINK/USDT
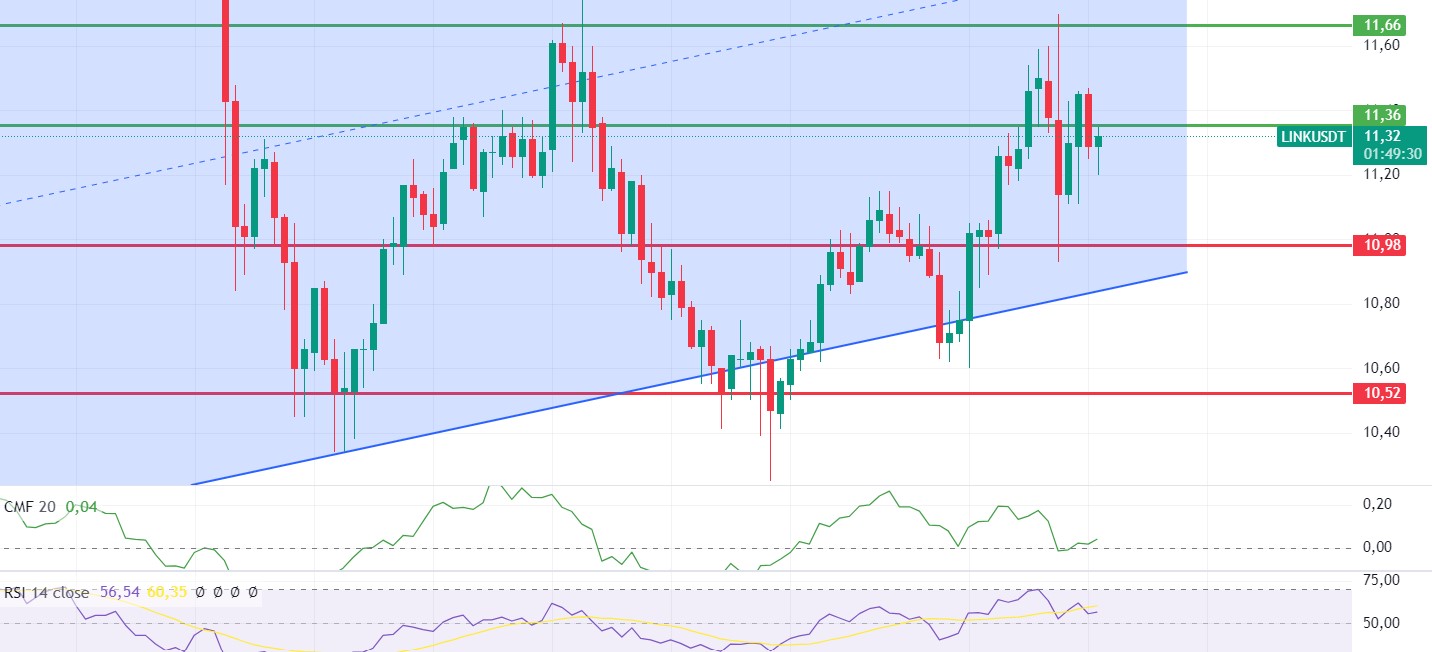
RSI, MFI, CMF and momentum for LINK, which fell back below 11.36 overnight, are starting to form slightly positive – horizontal structures. However, in addition to all these, both the Bitcoin dominance breaking certain resistance levels and the weakness in the ETH/BTC pair show certain weakness signals across altcoins. For this reason, we may see horizontal movements between support and resistance levels for a while. It would be healthier to act according to the breakouts. The 10.98 level is the main support level, but its breakout may cause deep declines.
Supports 10.98 – 10.52 – 9.89
Resistances 11.36 – 11.66 – 12.26
SOL/USDT
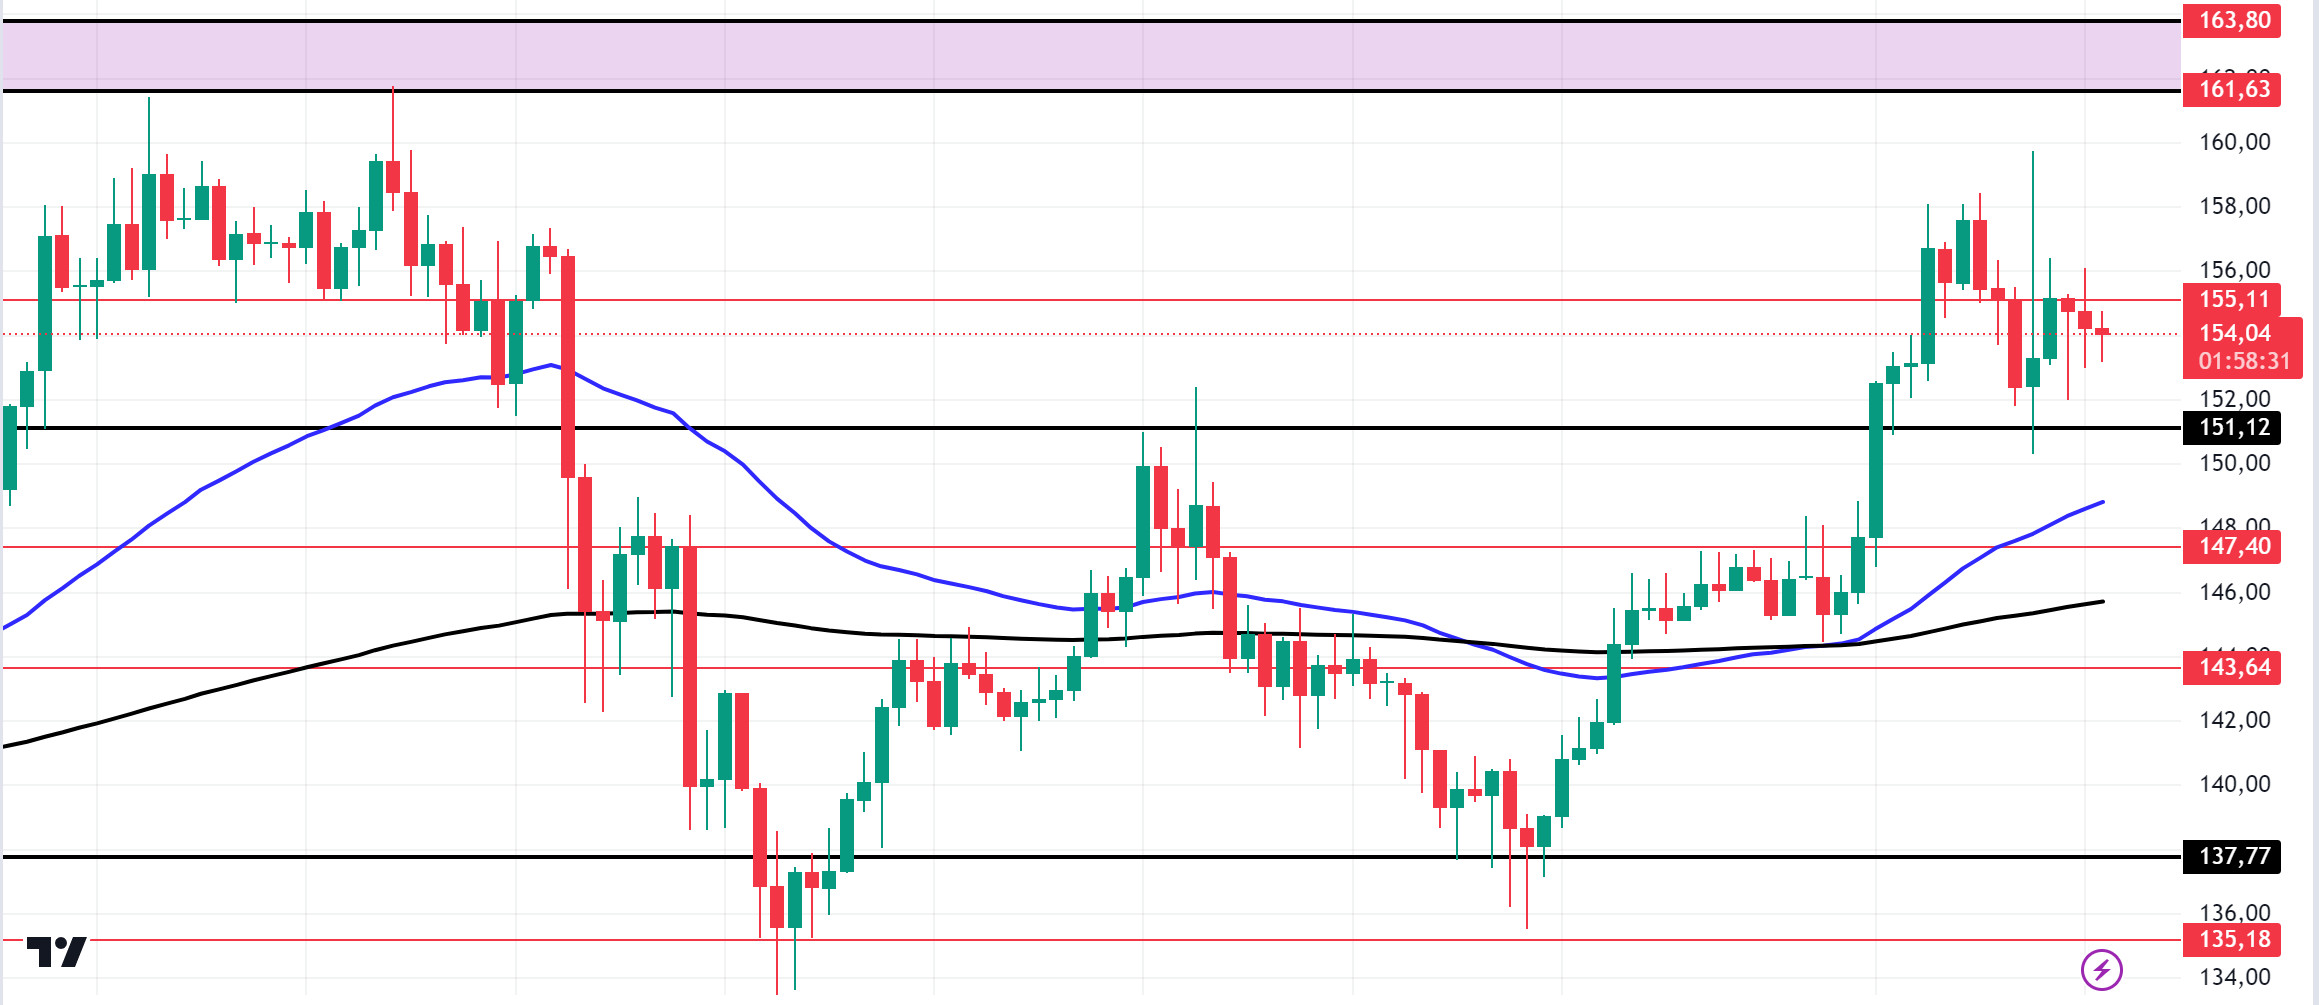
According to data from Arkham, more than 3,000 thousand Bitcoins exited the Tesla wallet yesterday evening. This caused a decline in cryptocurrencies. Technically, the 50 EMA continues to be above the 200 EMA in the 4-hour timeframe. This could mean that the rise will continue. It decisively broke the 151.12 level, an important resistance place. This means that it could test the 163.80 level, the ceiling of the band where it has been consolidating for a long time. The 161.63 level is a very strong resistance level in the uptrend driven by both macroeconomic conditions and innovations in the Solana ecosystem. If it rises above this level, the rise may continue strongly. In the sales that investors will make due to macroeconomic data or negativities in the ecosystem, the support level of 151.12 – 147.40 should be followed. If the price comes to these support levels, a potential bullish opportunity may arise.
Supports 151.12 – 147.40 – 143.64
Resistances 155.11 – 161.63 – 163.80
ADA/USDT
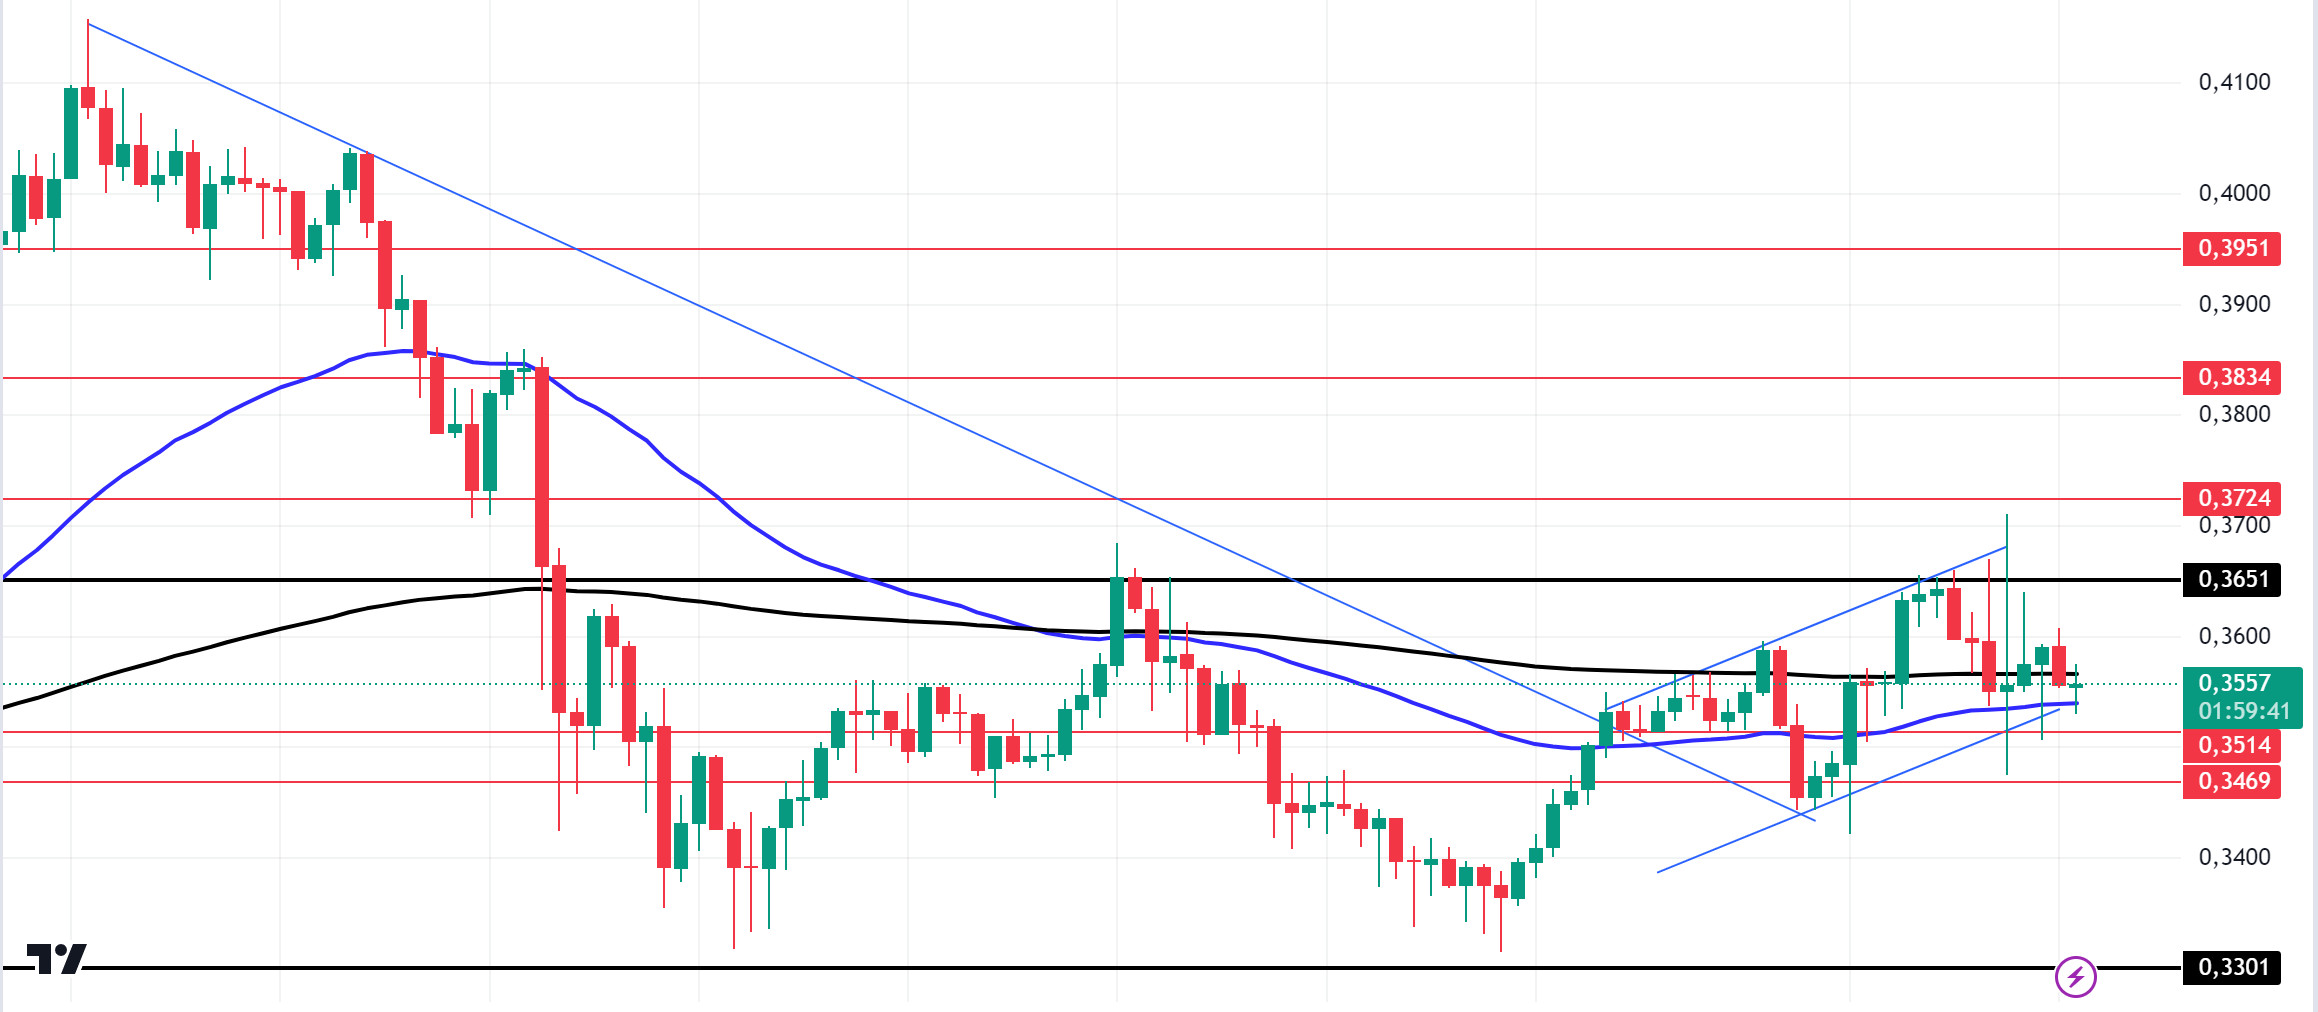
According to data from Arkham, there were more than 3,000 Bitcoin outflows from the Tesla wallet yesterday evening. This caused a decline in cryptocurrencies. In the ecosystem, Cardano Founder Charles Hoskinson provided insight into what could be the next upgrade for the network following the announcement of the Ouroboros Peras protocol. Hoskinson acknowledged that this potential upgrade was long overdue and added that it would “greatly enhance” the Cardano network, hinting that the next network upgrade could revolve around changes to validation zones. On-chain data shows that there are approximately 161,740 wallets holding more than 2 billion ADA. This could affect price movements. Data from Santiment revealed an increase in retail interest in ADA in recent weeks. Technically, ADA tested the critical resistance level of 0.3651 and retreated slightly from that level. On the 4-hour chart, the downtrend that started on September 27 was broken by whale movements and seems to have received support from the downtrend level. This could be a bullish sign. On the other hand, the 50 EMA continues to hover below the 200 EMA. The 50 EMA has supported the price. More signals may be needed for a rise. If macroeconomic data is positive for cryptocurrencies, it will retest the 0.3651 resistance level. If the money flow decreases and macroeconomic data is negative for cryptocurrencies, 0.3469 is a support level and can be followed as a good buying place.
Supports 0.3514 – 0.3469 – 0.3301
Resistances 0.3651 – 0.3724 – 0.3834
AVAX/USDT
AVAX, which opened yesterday at 29.07, fell by about 3% during the day and closed the day at 28.21. Today, there is no planned data to be announced especially by the US and expected to affect the market. For this reason, it may be a low-volume day where we may see limited movements. News flows from the Middle East will be important for the market.
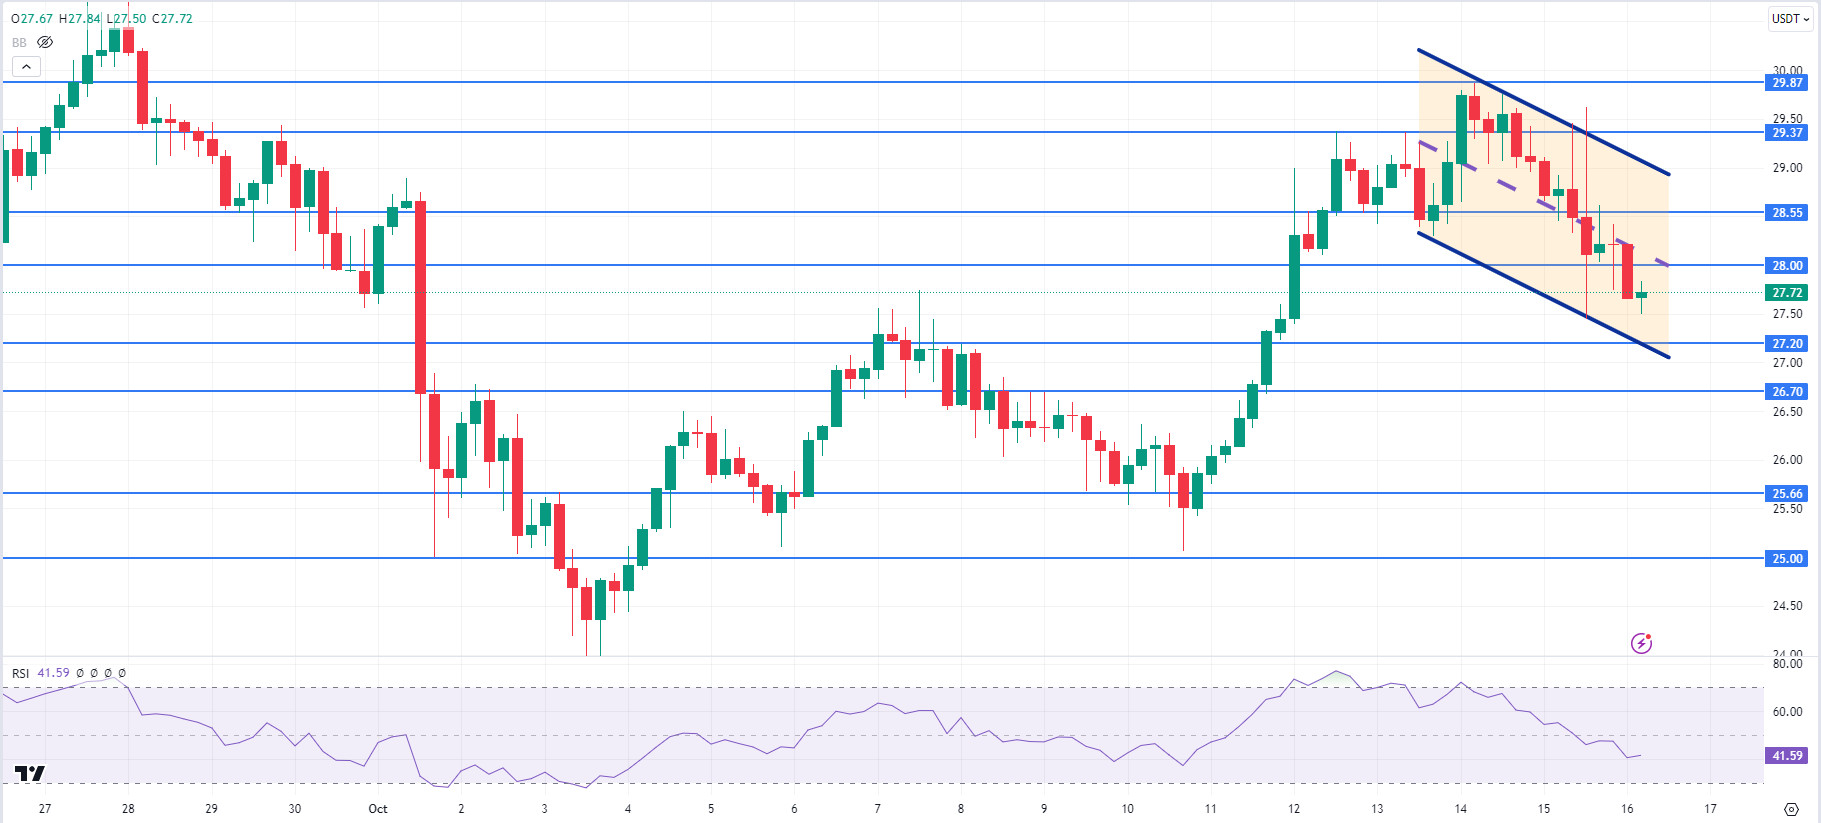
AVAX, currently trading at 27.72, is moving in a falling channel on the 4-hour chart. It is in the lower band of the falling channel and with the RSI 41 value, it can be expected to rise from here and move to the middle band. In such a case, it may test the 28.00 resistance. In case of negative news about the increasing tension in the Middle East, sales may increase. In such a case, it may test 27.20 support. As long as it stays above 25.00 support during the day, the desire to rise may continue. With the break of 25.00 support, sales may increase.
Supports 27.20 – 26.70 – 25.66
Resistances 28.00 – 28.55 – 29.37
TRX/USDT
TRX, which started yesterday at 0.1605, fell about 1% during the day and closed the day at 0.1588. There is no scheduled data for the market today. The market will be closely following the news flows regarding the tension in the Middle East.
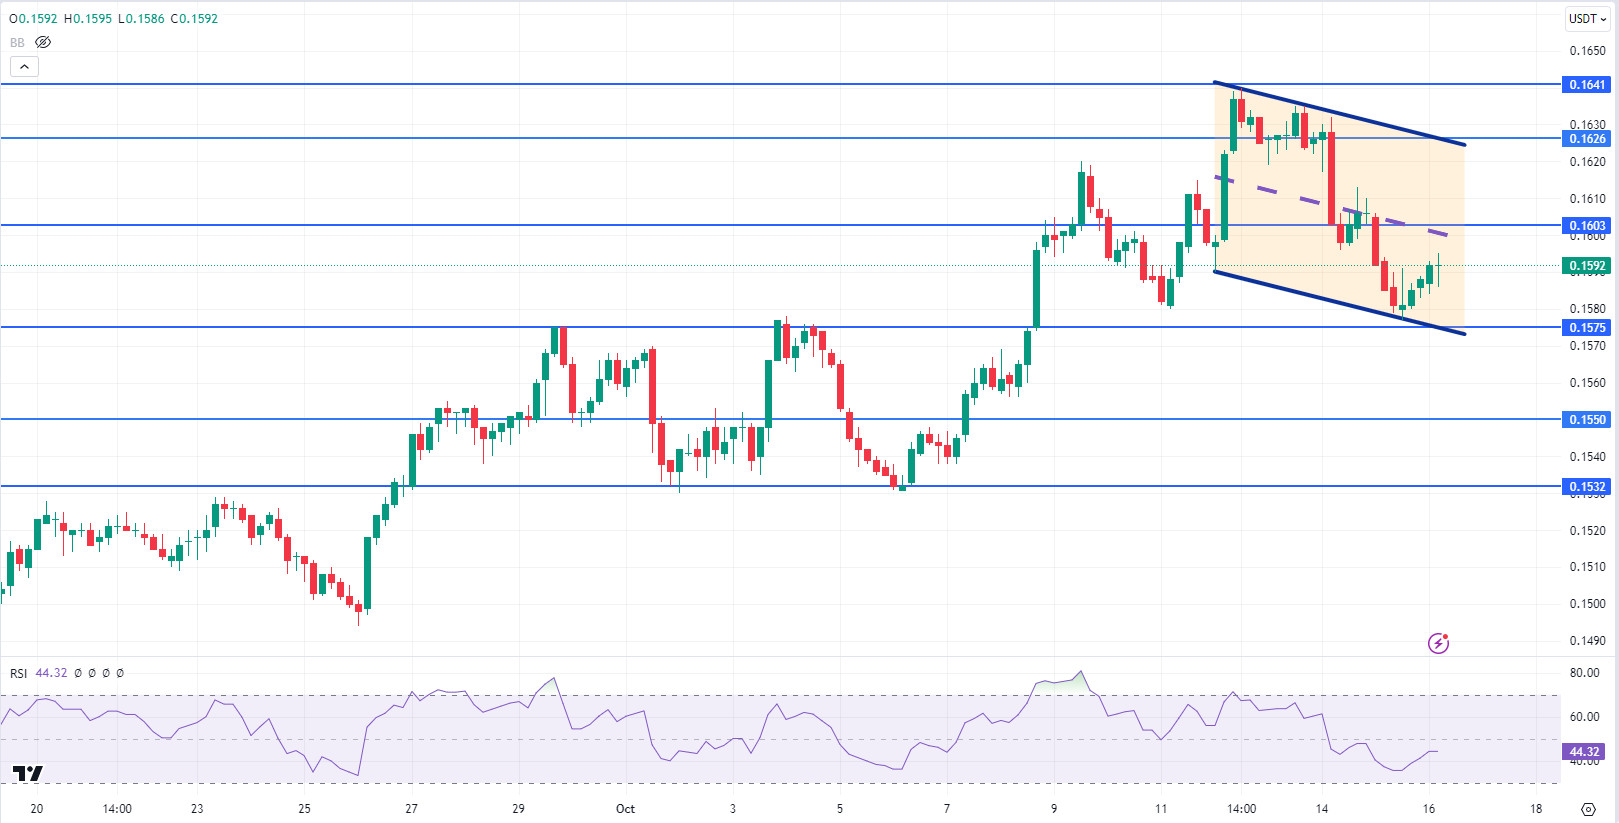
TRX, currently trading at 0.1592, moves from the lower band to the middle band of the falling channel on the 4-hour chart. With the RSI value of 44, it can be expected to rise slightly from its current level. In such a case, it may test the 0.1603 resistance by moving up from the middle band of the channel. However, if it cannot close the candle above 0.1603 resistance, it may test 0.1575 support with the selling pressure that may occur. As long as TRX stays above 0.1482 support, the desire to rise may continue. If this support is broken downwards, sales can be expected to increase.
Supports 0.1575 – 0.1550 – 0.1532
Resistances 0.1603 – 0.1626 – 0.1641
XRP/USDT
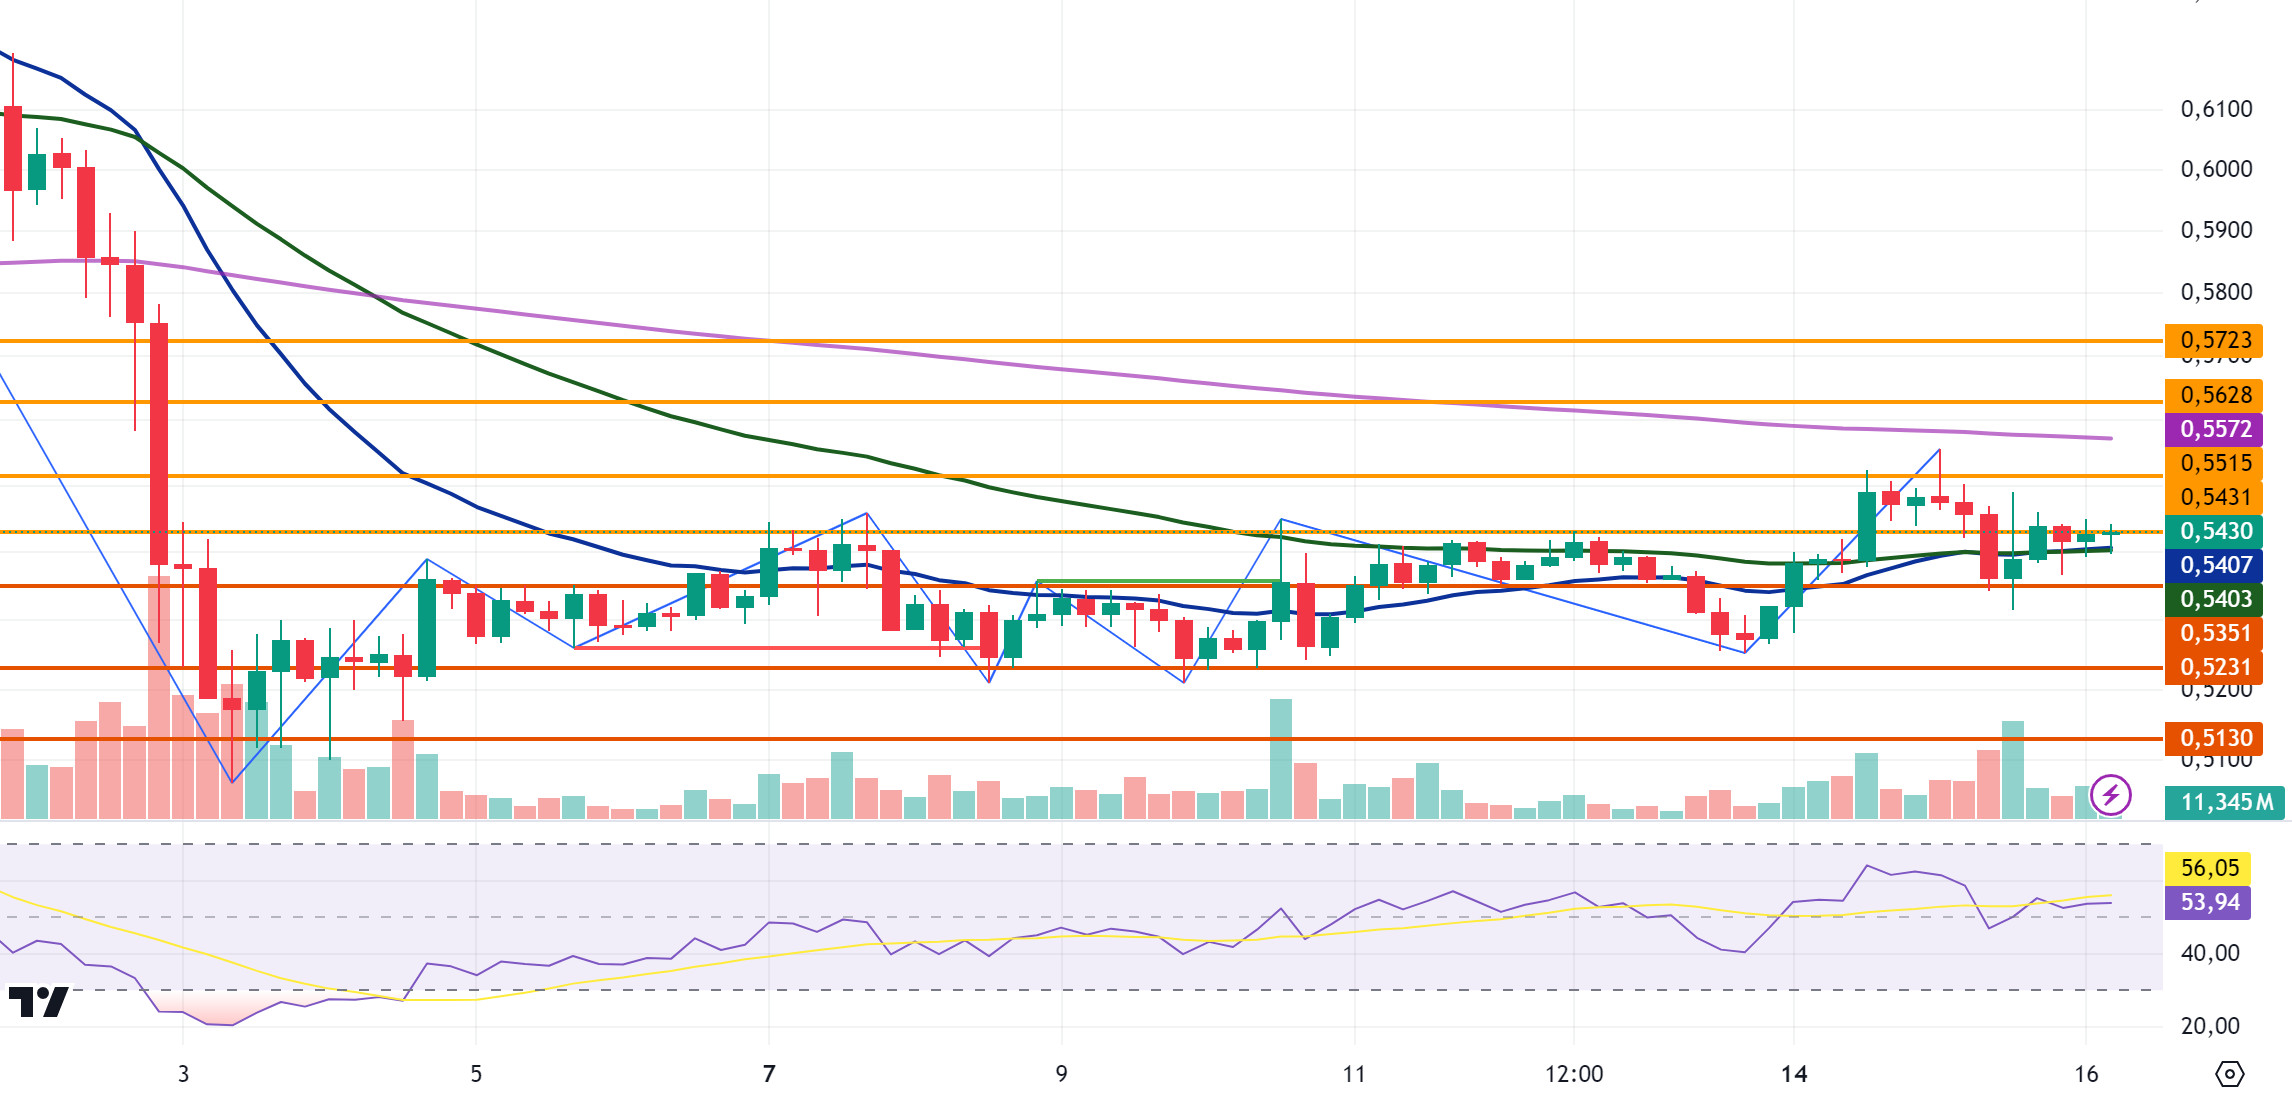
Yesterday, XRP fell below the EMA levels with a decline in the closing candle in the 4-hour analysis, and then the daily close was realized at 0.5415 above the EMA20 and EMA50 levels with the incoming purchases. XRP is testing the 0.5431 resistance level with a bullish 4-hour analysis today and has not yet broken it. If it breaks the 0.5431 resistance level and continues its rise, it may test the 0.5515-0.5628 resistance levels. If it fails to break the resistance level in question and declines with the sales that may come, it will test the EMA20 and EMA50 levels and may test the support levels of 0.5351-0.5231-0.5130 with its decline after breaking these levels downwards.
On the upside, XRP may decline with possible sales at EMA200 and 0.55 and may offer a short trading opportunity. In its decline, it may rise with possible purchases at EMA20 and EMA50 levels and may offer a long trading opportunity.
EMA20 (Blue Line) – EMA50 (Green Line) – EMA200 (Purple Line)
Supports 0.5351 – 0.5231 – 0.5130
Resistances 0.5431 – 0.5515 – 0.5628
DOGE/USDT
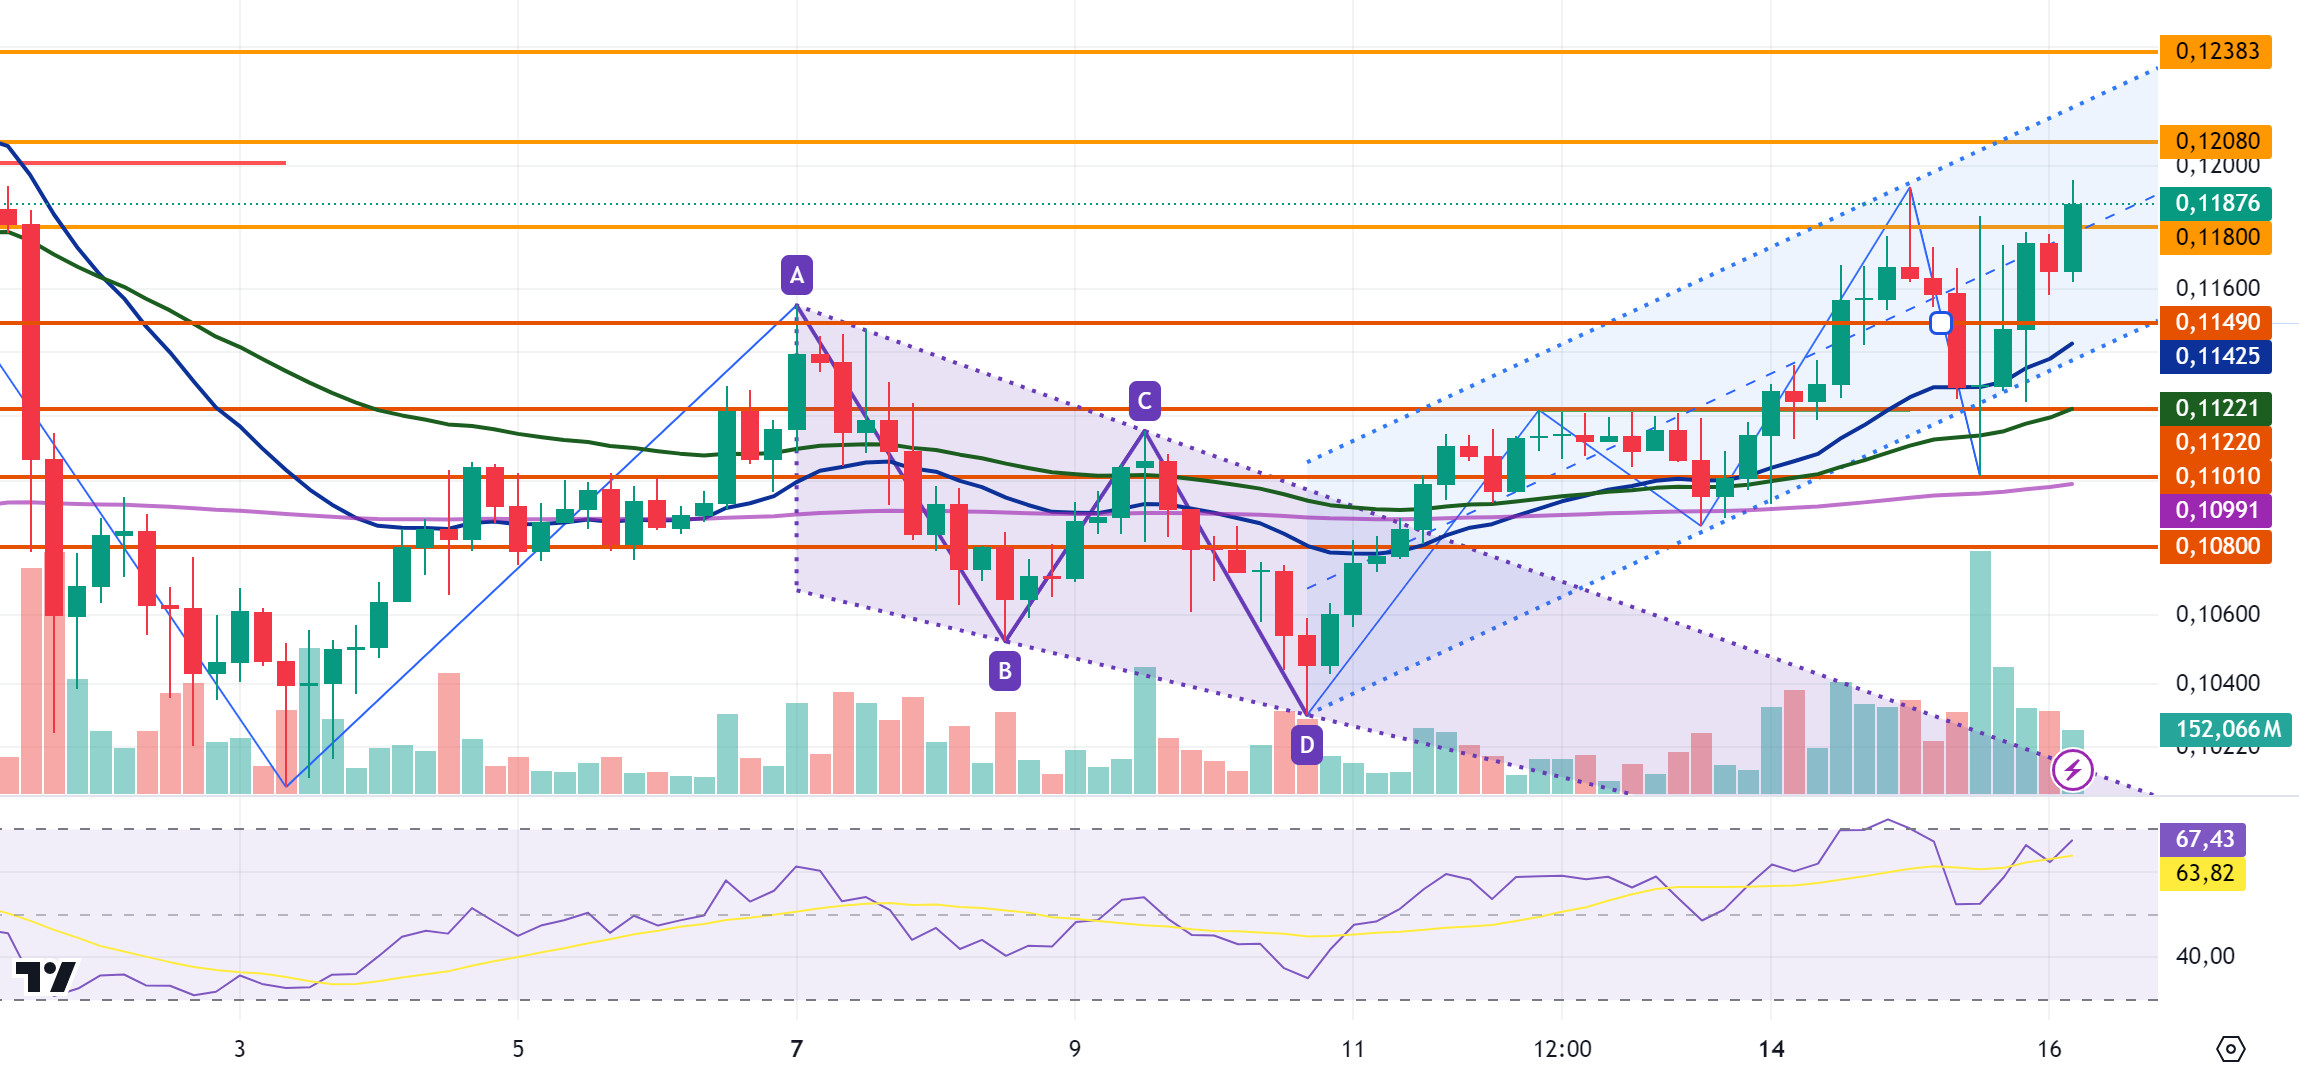
DOGE continues to trade in an ascending channel and the daily close was realized at 0.1174 with a value increase of about 1% yesterday. DOGE, which started today with a decline in the 4-hour analysis, started to rise with purchases at 0.1157 and is currently trading at 0.1187. DOGE, which tested the 0.1180 resistance level with its rise, may test the 0.1208-0.1238 resistance levels if the level is broken and the rise continues. In case it declines with the negative news that may come in the uptrend, it may test the support levels of 0.1149-0.1122-0.1101.
DOGE, which is in the ascending channel, may decline with possible sales at 0.12 and may offer a short trading opportunity. In case of a decline, it may rise with purchases at EMA20 and 0.1149 and may offer a long trading opportunity.
EMA20 (Blue Line) – EMA50 (Green Line) – EMA200 (Purple Line)
Supports 0.1149 – 0.1122 – 0.1101
Resistances 0.1180 – 0.1208 – 0.1238
DOT/USDT
Polkadot spent 5.1 million DOT in Q3 2024, bringing its treasury balance to $150 million. Focusing on DeFi chain investments and development, Polkadot plans to keep its spending at DOT 4.5 million in the future. Sustainable financial management has contributed to Polkadot’s positive outlook in the market.
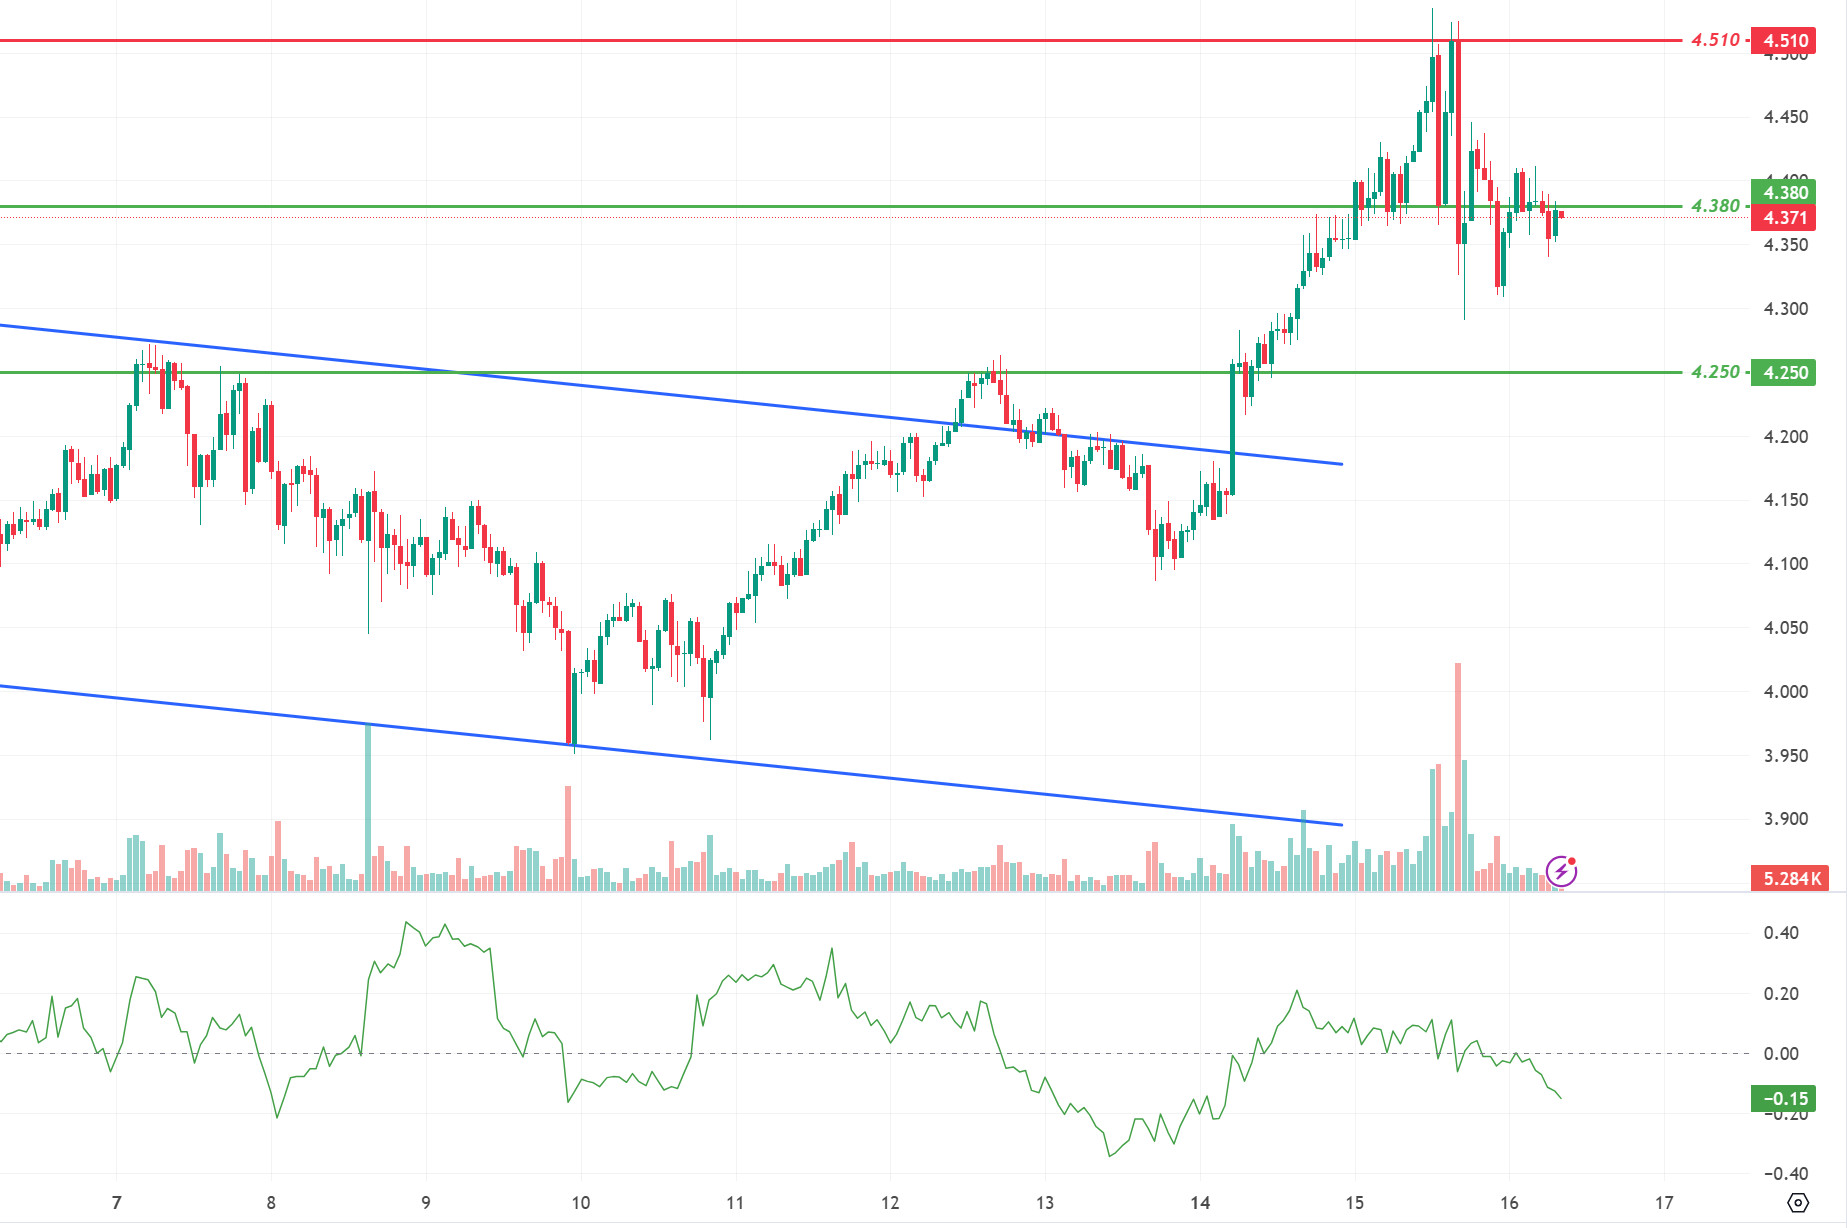
When we examine the DOT chart, the price continues to fall with the reaction from the 4.510 resistance level. According to the CMF oscillator, we can see that the selling pressure is stronger. In this context, if the price cannot hold the 4.380 support band, it may retreat towards the next support level of 4.250. On the other hand, if the price maintains above the 4,380 level, its next target may be to break the selling pressure at the 4,510 resistance level.
Supports 4.380 – 4.250 – 4.165
Resistances 4.450 – 4.510 – 4.655
SHIB/USDT
Shiba Inu’s (SHIB) burn rate increased by 14.575%, leading to 279 million tokens being removed from circulation and the SHIB price remaining above the 0.00001810 support level. This burn continues to attract investor interest as it reduces the supply of SHIB, increasing expectations for a price increase.
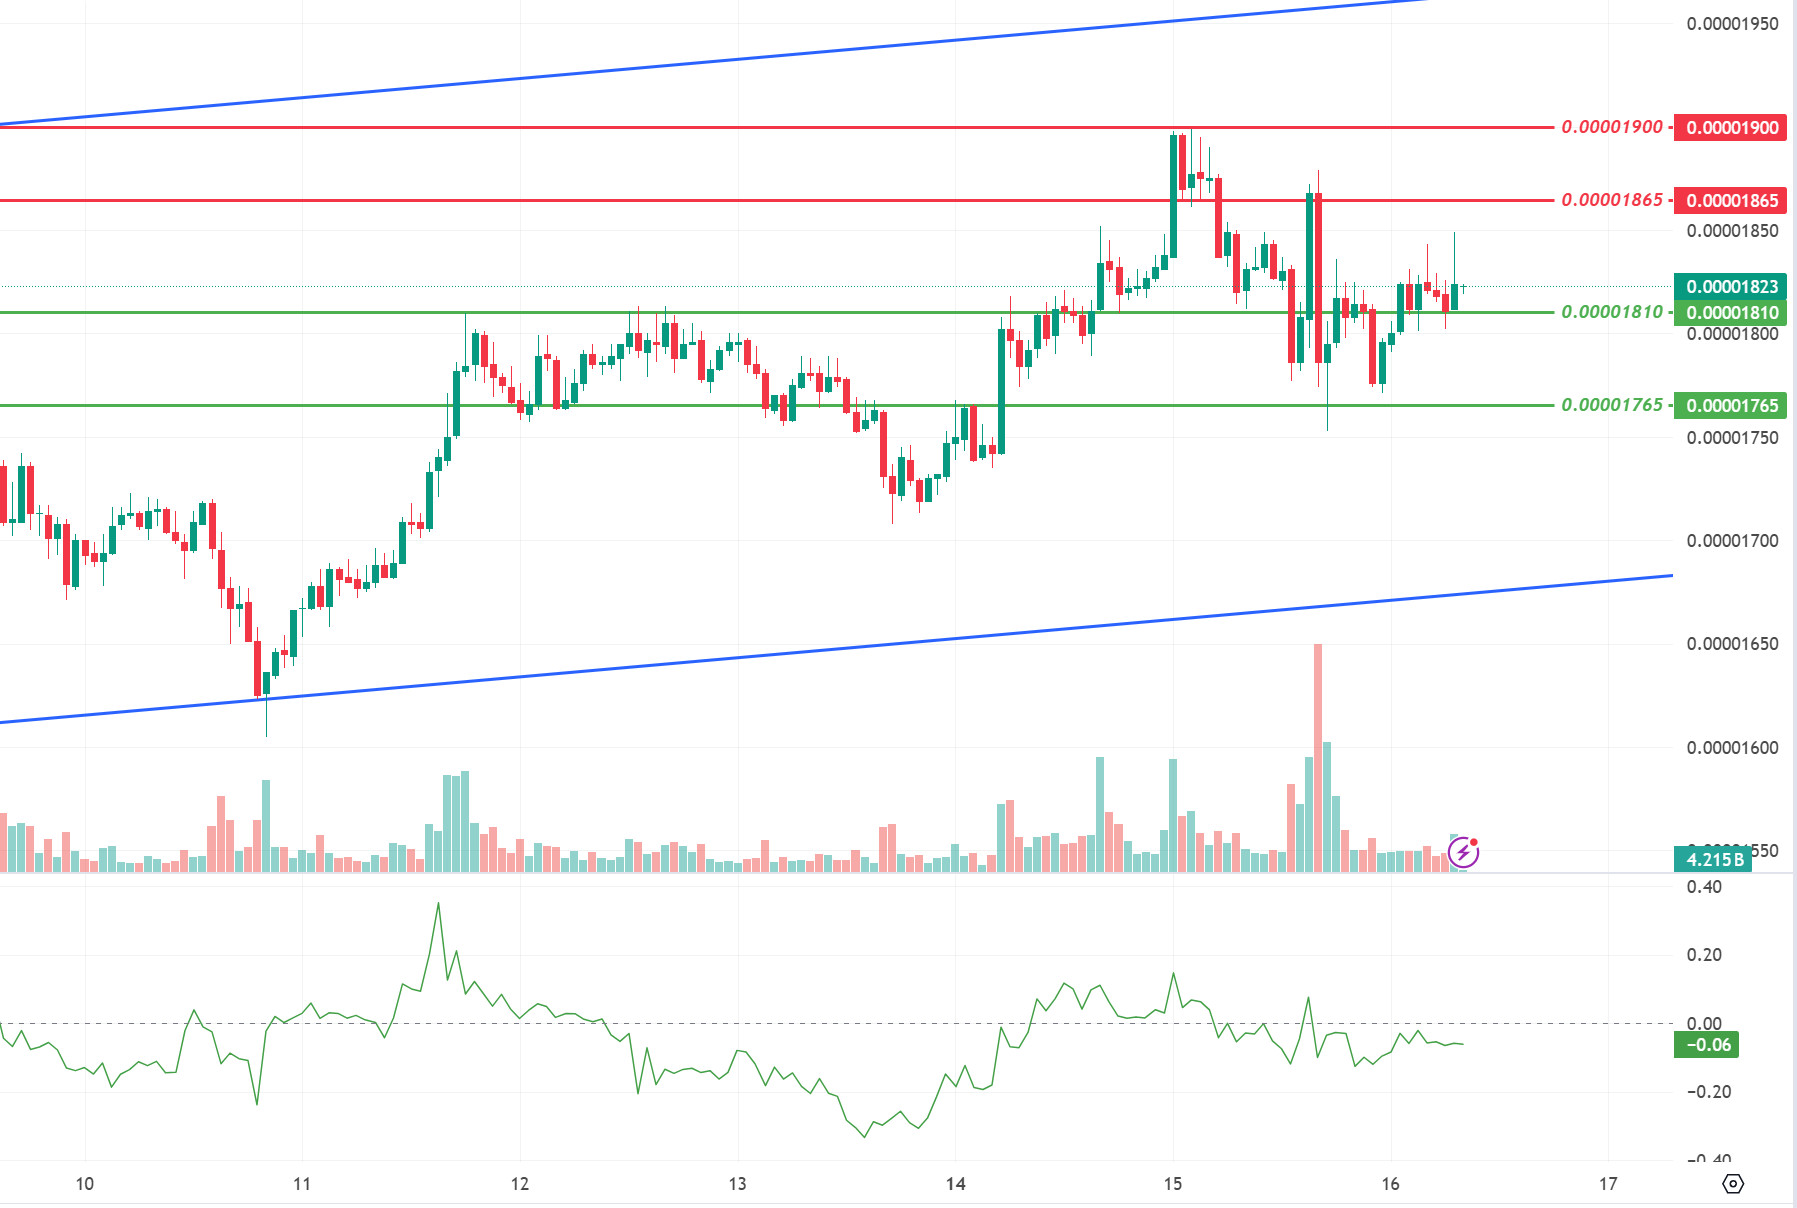
SHIB is trending sideways above the 0.00001810 support level. According to the CMF oscillator, we can say that the selling pressure is stronger. In the negative scenario, if the price breaks below the 0.00001810 support level, the next level for a reaction could be 0.00001765. On the other hand, if the price continues to persist above 0.00001810 with increasing close rates, we may see a move towards 0.00001865 levels.
Supports 0.00001810 – 0.00001765 – 0.00001690
Resistances 0.00001865 – 0.00001900 – 0.00001950
LEGAL NOTICE
The investment information, comments and recommendations contained herein do not constitute investment advice. Investment advisory services are provided individually by authorized institutions taking into account the risk and return preferences of individuals. The comments and recommendations contained herein are of a general nature. These recommendations may not be suitable for your financial situation and risk and return preferences. Therefore, making an investment decision based solely on the information contained herein may not produce results in line with your expectations.


