MARKET SUMMARY
Latest Situation in Crypto Assets
| Assets | Last Price | 24h Change | Dominance | Market Cap |
|---|---|---|---|---|
| BTC | 92,662.23 | -1.06% | 56.71% | 1,84 T |
| ETH | 3,347.41 | -2.13% | 12.45% | 403,00 B |
| XRP | 2.022 | -2.77% | 3.59% | 116,15 B |
| SOLANA | 188.63 | -1.97% | 2.80% | 90,53 B |
| DOGE | 0.3111 | -2.89% | 1.42% | 45,87 B |
| CARDANO | 0.8426 | -3.16% | 0.91% | 29,61 B |
| TRX | 0.2521 | -2.37% | 0.67% | 21,74 B |
| AVAX | 35.19 | -4.21% | 0.45% | 14,43 B |
| LINK | 20.29 | -4.42% | 0.40% | 12,95 B |
| SHIB | 0.00002062 | -4.94% | 0.38% | 12,15 B |
| DOT | 6.579 | -5.72% | 0.31% | 10,09 B |
*Prepared on 12.31.2024 at 07:00 (UTC)
WHAT’S LEFT BEHIND
US Blockchain Association Files Lawsuit Against IRS’s New Digital Asset Reporting Rules
New regulations from the US Internal Revenue Service (IRS) requiring digital asset platforms, including decentralized exchanges (DEXs), to disclose user transaction information and crypto sales revenue starting in 2027 have been sued by the Blockchain Association and the Texas Blockchain Commission. The plaintiffs argued that the regulations are unconstitutional and violate the Administrative Procedure Act.
FED’s Daly: “Crypto Is Not Yet a Currency”
Mary Daly, President of the Federal Reserve Bank of San Francisco, said that cryptocurrencies have very different characteristics from traditional currencies and “do not yet meet the conditions to be a currency”. Daly pointed out that crypto assets should be considered as an independent asset class, while volatility and demand-driven value variability push crypto into a limited position between value preservation tools and speculative assets.
BlackRock Bitcoin ETF Breaks Record
BlackRock’s iShares Bitcoin Trust (IBIT) ETF has been described as “the biggest launch in ETF history”. Launched in 2024, IBIT grew its assets to over $50 billion in just 11 months. This performance surpassed the size of many traditional ETFs in 20 years, marking a significant milestone in the industry.
Tether Increases Bitcoin Holdings to 83,759 BTC
Tether-associated wallets added 8,404 BTC worth $772 million on December 30, 2024. The company’s total Bitcoin holdings now stand at 83,759 BTC with a market capitalization of $7.7 billion. This transaction involves the transfer of 7,628 BTC received from a wallet labeled Bitfinex.
USDC Treasury Prints 400 Million USDCs
According to Whale Alert data, USDC Treasury minted a total of 400 million USDC today. These mintings took place on the Ethereum and Algorand networks. The transaction on Algorand was recorded as the last USDC mint on the network.
MicroStrategy Continues Bitcoin Purchases
MicroStrategy sold 592,987 shares between December 23 and 29, 2024, generating $209 million in revenue. All of this revenue was used to buy 2,138 BTC at an average price of $97,837. The company’s total Bitcoin holdings now stand at 446,400 BTC. The average purchase cost was recorded as 62,428 dollars.
HIGHLIGHTS OF THE DAY
Important Economic Calender Data
| Time | News | Expectation | Previous |
|---|---|---|---|
| Cardano (ADA) | Decentralized Governance Tools | ||
| Cardano (ADA) | Annual Member Meeting | ||
| Ankr Network (ANKR) | Q4 2024 Neura Mainnet Launch | ||
| Immutable (IMX) | Q4 2024 Red One Launch | ||
| Pendle (PENDLE) | CePendle Airdrop Snapshot | ||
| Optimism (OP) | 31.34MM Token Unlock | ||
| TRON (TRX) | Chainlink Data Feeds Integration | ||
| Celestia (TIA) | Restaking | ||
| 14:00 | US S&P/CS Composite – 20 HPI (YoY) (Oct) | 4.1% | 4.6% |
INFORMATION:
*The calendar is based on UTC (Coordinated Universal Time) time zone.
The economic calendar content on the relevant page is obtained from reliable news and data providers. The news in the economic calendar content, the date and time of the announcement of the news, possible changes in the previous, expectations and announced figures are made by the data provider institutions. Darkex cannot be held responsible for possible changes that may arise from similar situations.
MARKET COMPASS
On the last trading day of the year, global markets seem far from experiencing a “Santa Claus Rally”. Following the declines in Wall Street indices, there is a cautious stance in Asian stock markets this morning and volumes are classically low. The yield on the US 10-year bond is flat below 4.60% and the dollar index is hovering around 108. In Europe, German and Italian stock markets will be closed today. UK and France will close early.
While digital assets continue to trade sideways with low volumes and wider wavelengths brought by the year-end, they are also affected by the sell-off in traditional markets and investors seem to be more willing to take profits. We do not expect the market to return to its active trend before the second week of January and we think that the sideways trend will continue along with volatility. For the long term outlook, we maintain our bullish expectation as mentioned below.
From the short term to the big picture.
The victory of former President Trump on November 5, which was one of the main pillars of our bullish expectation for the long-term outlook in digital assets, produced a result in line with our predictions. Afterwards, the president-elect’s appointments and expectations of increased regulation of the crypto ecosystem in the US continued to be a positive variable in our equation. Although it is expected to continue at a slower pace, the FED’s signal that it will continue its interest rate cut cycle and the volume in crypto asset ETFs indicating an increase in institutional investor interest (in addition to MicroStrategy’s BTC purchases, BlackRock’s BTC ETF options start trading…) support our upward forecast for the big picture for now.
In the short term, given the nature of the market and pricing behavior, we think it would not be surprising to see occasional pauses or pullbacks in digital assets. However, at this point, it is worth emphasizing again that the fundamental dynamics continue to be bullish.
TECHNICAL ANALYSIS
BTC/USDT
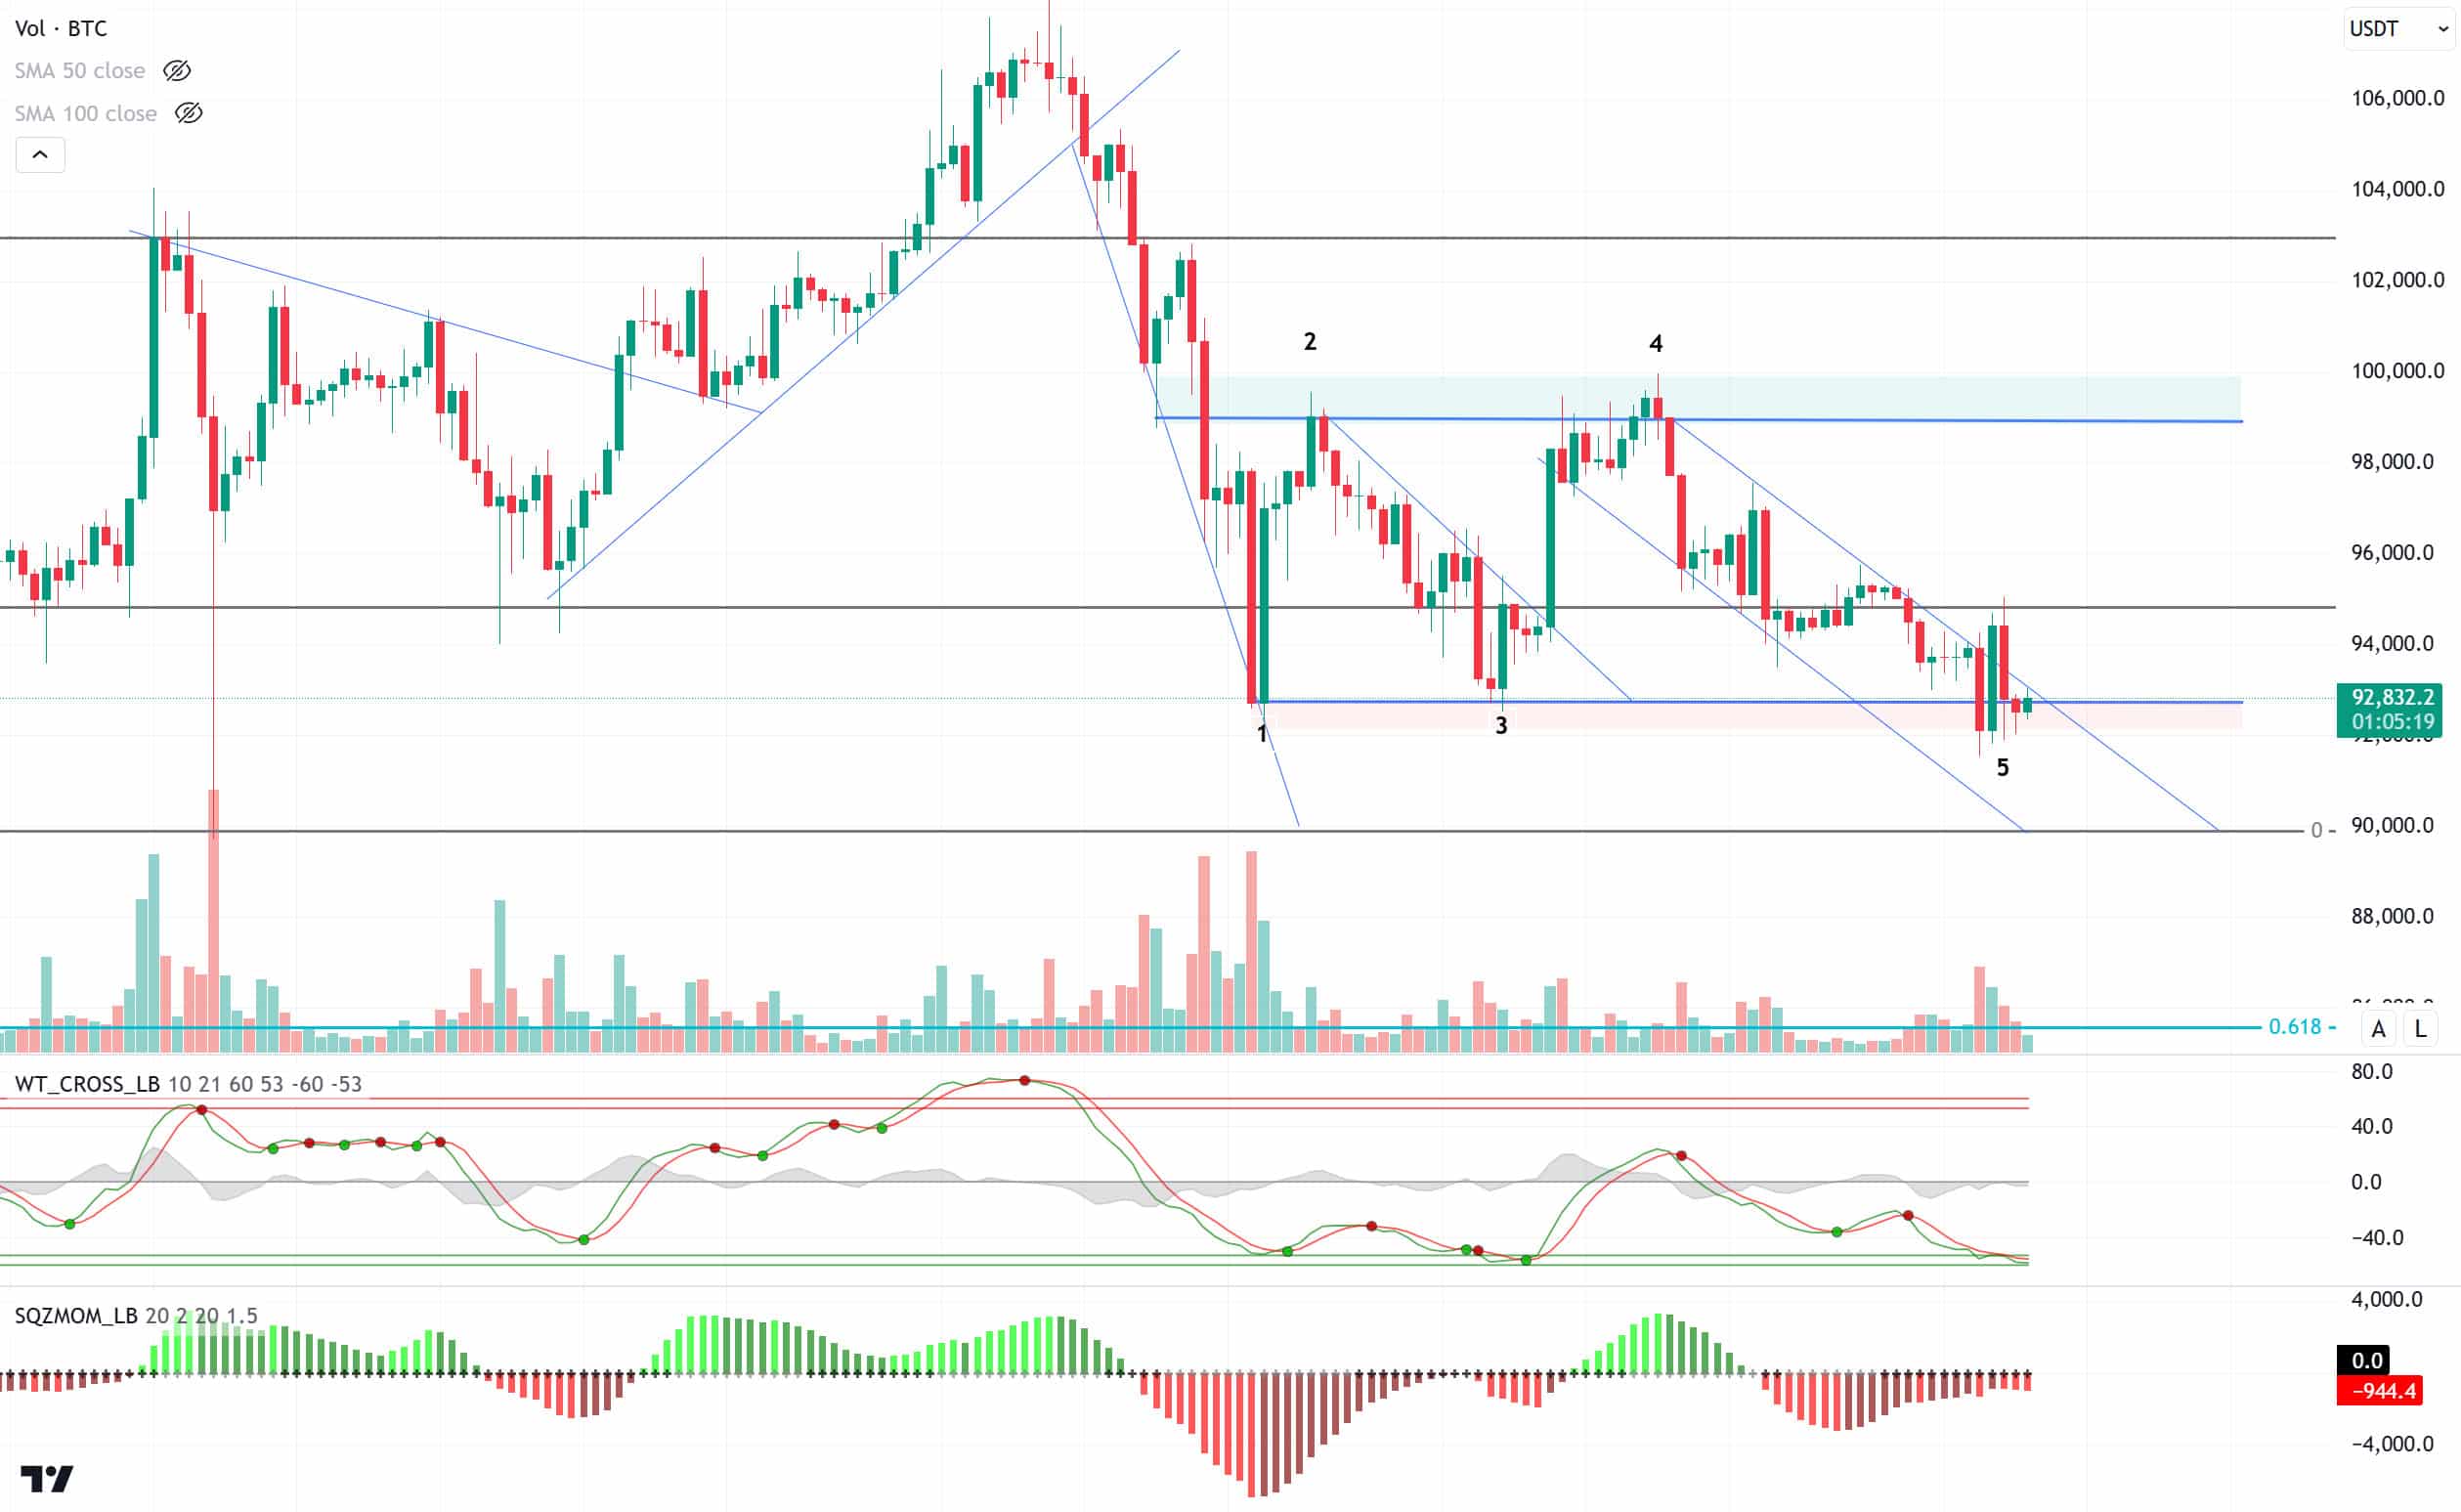
On the last trading day of the year, Bitcoin spot ETFs recorded net outflows totaling $426 million. This marks the second consecutive day of net outflows. Bitcoin price is preparing to close at a level between $90,000 and $100,000 on the last day of the year. When we look at the last day of last year, Bitcoin was traded at $ 42,350. With the increasing risk appetite in the first days of the new year, the price rose to $ 45,000.
When we look at the technical outlook with the closing data of the year, we saw some increased volatility in the market as of yesterday. The price, which tested the downtrend structure, could not stay on it and broke the 92,800 support level and fell to 91,700. Then, the price, which recovered rapidly again, tested the resistance level of 95,000. In the candles before the two 4-hour volume candles, we saw the struggle of bears and bulls. Although the bears momentarily dominated, the bulls rebalanced and the price is currently trading at the support level of 92,800. Technical oscillators may generate a buy signal during the day while moving in the oversold zone. Momentum indicator, on the other hand, seems to have weakened in the negative area for a transition to the positive zone. In the continuation of the rise, closures above the 93,000 intermediate resistance level will be followed and the 95,000 level can be targeted again. In a possible decline, we will expect the price to hold in the 92,800 and 92,200 band, otherwise it may retreat to 90,000 levels.
Supports 92,800 – 90,000 – 88,500
Resistances 95,000 – 97,200 – 99,100
ETH/USDT
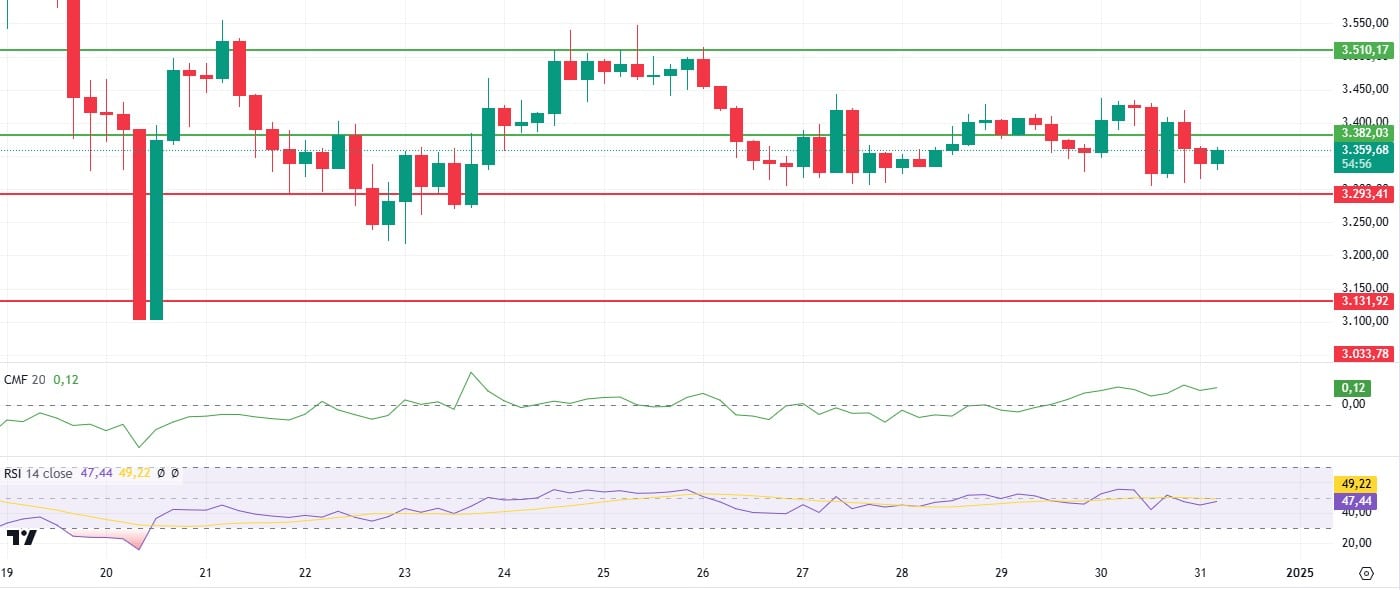
The crypto market had a very volatile day yesterday, with Bitcoin’s volatile movements also affecting Ethereum. After losing and retesting the critical 3,382 level, ETH is currently pricing below this level.
Technically, Ethereum maintains its positive structure. In particular, the Chaikin Money Flow (CMF) indicator is trending up in positive territory during these volatile movements, indicating that capital inflows remain strong in favor of ETH. Similarly, the Relative Strength Index (RSI) also remains positive, indicating that momentum is on the upside. Cumulative Volume Delta (CVD) data reveals that the recent bearish and bullish movements were mainly driven by the futures market. In addition, the significant decline in open interest (OI) data suggests that the market is in a short-term consolidation phase and traders are reducing their risk.
The critical support level for ETH stands out as 3,293. If the price stays above this level, the possibility of upside momentum remains strong. Potential targets are 3,382 and 3,510 levels respectively. However, the loss of the 3,293 level may disrupt the positive structure and pave the way for deeper correction movements.
Supports 3,293 – 3,131- 3,033
Resistances 3,382 – 3,510 – 3,670
XRP/USDT
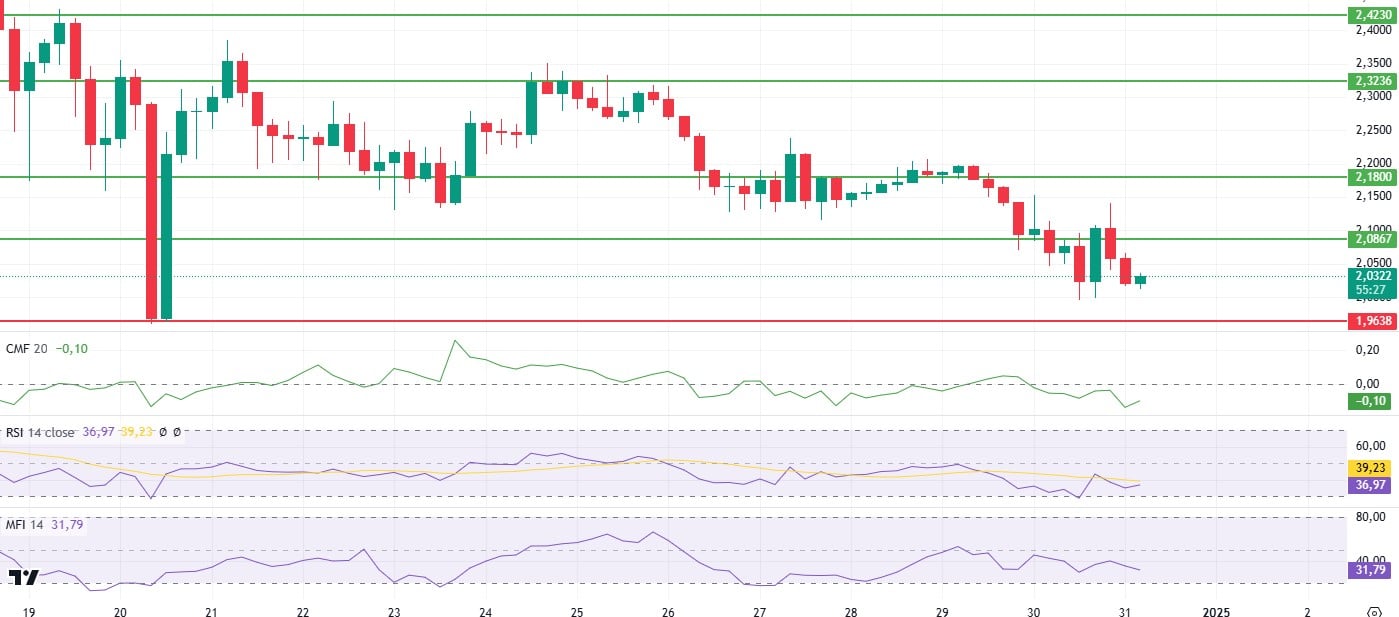
XRP price continues its downward trend in line with expectations. Unable to persist above the 2.08 level, XRP continues to remain under selling pressure as technical indicators maintain their negative outlook.
The Chaikin Money Flow (CMF) indicator continues to move downwards in negative territory, indicating that capital outflows are continuing and eliminating the possibility of a potential positive divergence. However, there is a noticeable positive divergence on the Money Flow Index (MFI). Relative Strength Index (RSI), on the other hand, is flat at 35 on a rebound from the oversold area, indicating that the sell-off has abated somewhat but momentum is still weak.
XRP continues its move towards the main support point of 1.96. This area stands out as a critical level where buyers can step in and the price can react upwards. However, it should be kept in mind that if it fails to hold at 1.96, sales may deepen and cause the price to fall to 1.86 levels. On the other hand, the technical outlook may turn positive if the price rises above the 2.08 level again and maintains this level. In such a scenario, one can expect the upside momentum to start and the price to gain momentum towards higher levels
Supports 1.9638 – 1.8651 – 1.6309
Resistances 2.0800 – 2.1800 – 2. 3236
SOL/USDT
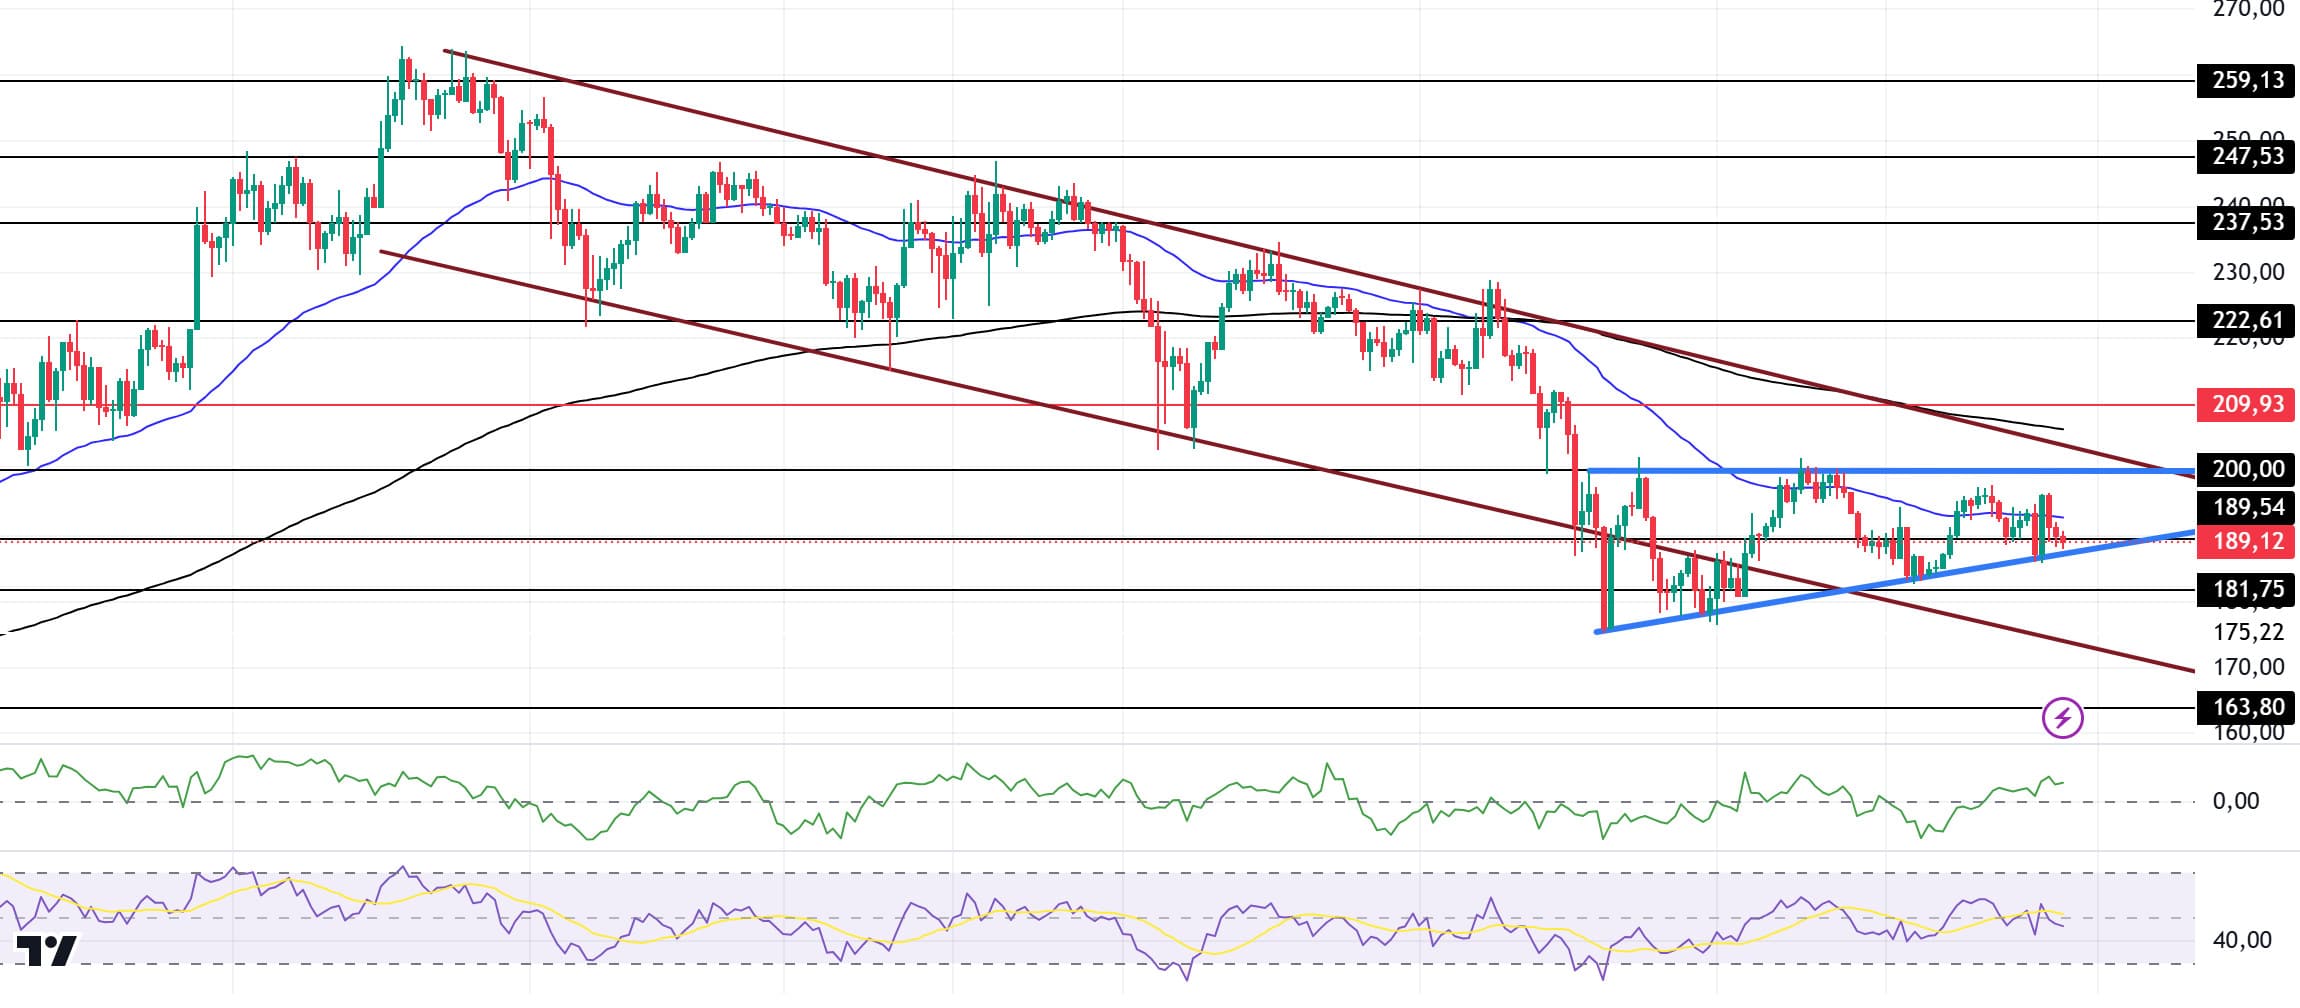
Solana led the way in stablecoin inflows as DEX trading accelerated. More than $5 billion in stablecoin assets paved the way for a slight weekly rebound. However, SOL’s price may continue to decline as trading volume fell last week. The data in the metric points to a continuation of the bearish trend.
Solana continues to price horizontally inside the ascending triangle. On the 4-hour timeframe, the 50 EMA (Blue Line) is below the 200 EMA (Black Line). As a matter of fact, the asset tested the 50 EMA resistance during the day but failed to break it and took support from the base level of the ascending triangle pattern. If it retests and breaks the 50 EMA resistance, the uptrend may continue. When we examine the Chaikin Money Flow (CMF)20 indicator, it is in positive territory and money inflows are gradually increasing. However, Relative Strength Index (RSI)14 is at the neutral level. On the other hand, the ascending triangle pattern should be taken into consideration. The 209.93 level stands out as a very strong resistance point in the rises driven by both the upcoming macroeconomic data and the news in the Solana ecosystem. If it breaks here, the rise may continue. In case of retracements for the opposite reasons or due to profit sales, the 163.80 support level can be triggered. If the price comes to these support levels, a potential bullish opportunity may arise if momentum increases.
Supports 189.54 – 181.75 – 163.80
Resistances 200.00 – 209.93 – 222.61
DOGE/USDT
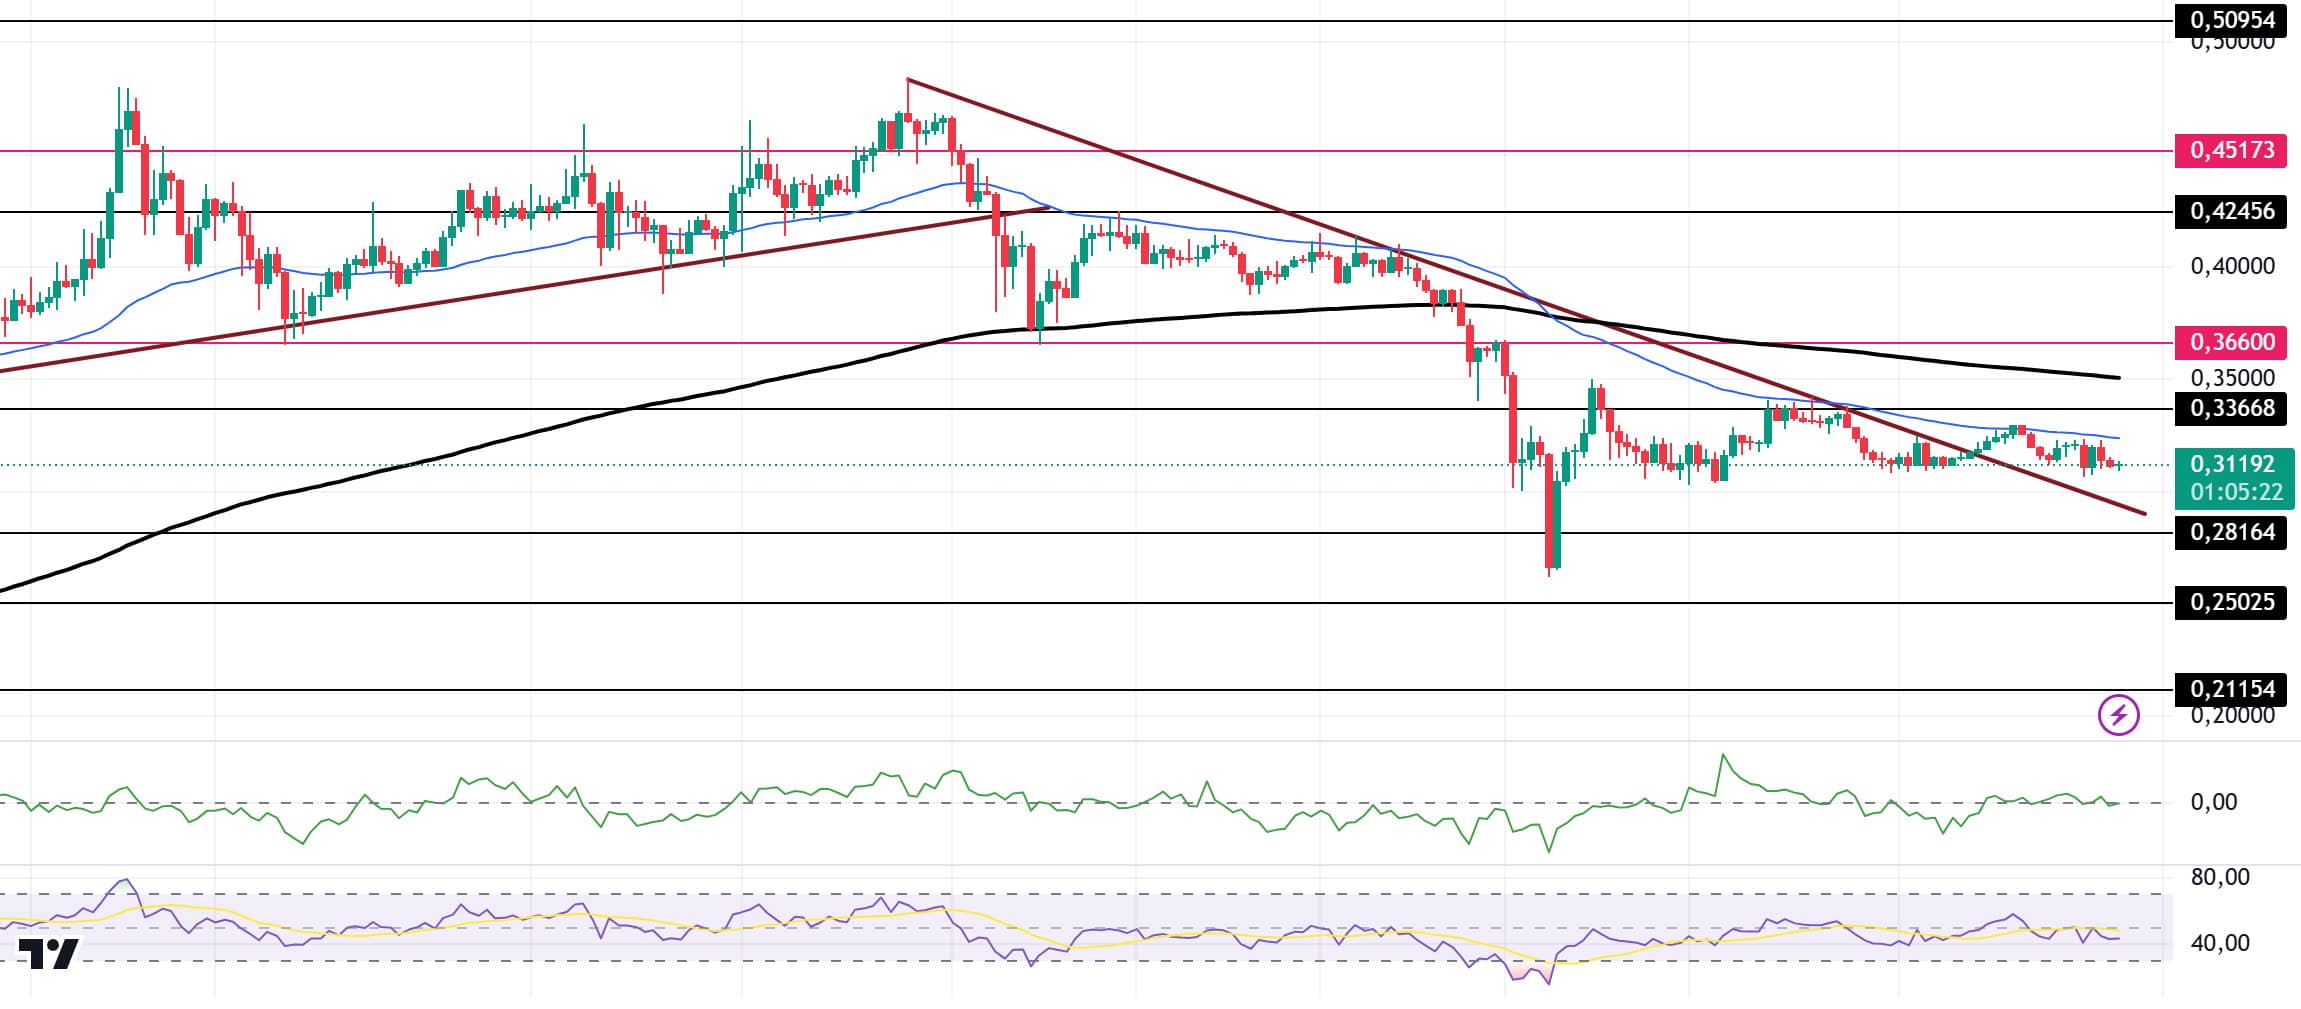
In just over an hour, more than 800 million Dogecoins were transferred. During this transfer, the asset appeared to go down.
When we look at the chart, DOGE, which has been in a downtrend since December 8, gained momentum from the support of this trend and consolidated in the middle of the trend, then tested the resistance level of the trend with horizontal movements and went out of the trend. Currently, the 50 EMA (Blue Line) is working as resistance for the asset. Although it tested the 50 EMA twice, the volume was not enough to break this resistance. On the 4-hour timeframe, the 50 EMA (Blue Line) continues to be below the 200 EMA (Black Line). When we examine the Chaikin Money Flow (CMF)20 indicator, it is in the neutral zone. But money outflows started to increase. However, Relative Strength Index (RSI)14 is in negative territory. The 0.36600 level stands out as a very strong resistance point in the rises driven by both the upcoming macroeconomic data and the innovations in the Doge coin. If DOGE catches a new momentum and rises above this level, the rise may continue strongly. In case of possible pullbacks due to macroeconomic reasons or negativity in the ecosystem, the 0.25025 level, which is the base level of the trend, is an important support. If the price reaches these support levels, a potential bullish opportunity may arise if momentum increases.
Supports 0.28164 – 0.25025 – 0.21154
Resistances 0.33668 – 0.36600 – 0.42456
LEGAL NOTICE
The investment information, comments and recommendations contained herein do not constitute investment advice. Investment advisory services are provided individually by authorized institutions taking into account the risk and return preferences of individuals. The comments and recommendations contained herein are of a general nature. These recommendations may not be suitable for your financial situation and risk and return preferences. Therefore, making an investment decision based solely on the information contained herein may not produce results in line with your expectations.


