MARKET SUMMARY
Latest Situation in Crypto Assets
| Assets | Last Price | 24h Change | Dominance | Market Cap |
|---|---|---|---|---|
| BTC | 100,218.22 | -0.67% | 55.06% | 1,98 T |
| ETH | 3,918.38 | -0.33% | 13.12% | 472,07 B |
| XRP | 2.381 | -1.45% | 3.77% | 135,70 B |
| SOLANA | 223.01 | -2.73% | 2.96% | 106,86 B |
| DOGE | 0.4049 | -1.21% | 1.65% | 59,59 B |
| CARDANO | 1.104 | -2.55% | 1.08% | 38,74 B |
| TRX | 0.2878 | -3.53% | 0.69% | 24,82 B |
| AVAX | 52.04 | 1.95% | 0.59% | 21,26 B |
| LINK | 28.37 | 2.88% | 0.49% | 17,75 B |
| SHIB | 0.00002803 | -2.64% | 0.46% | 16,48 B |
| DOT | 9.042 | -1.54% | 0.38% | 13,74 B |
*Prepared on 12.13.2024 at 14:00 (UTC)
WHAT’S LEFT BEHIND
French Hill Named Chairman of the Financial Services Committee
With the election of Donald Trump as US president, pro-crypto Congressman French Hill was appointed as the chairman of the Financial Services Committee, which also oversees the SEC. This appointment signals positive developments in crypto regulations.
First Ethereum Mainnet Proposal from WLFI Community Approved
The WLFI community has approved the first proposal to launch the Aave v3-based lending protocol on the Ethereum mainnet. The protocol will support transactions with ETH, WBTC, USDC and USDT.
Early Bitcoin Investor Sentenced to Prison for Tax Evasion
The US Department of Justice announced that Frank Richard Ahlgren III was sentenced to two years in prison for misrepresenting his Bitcoin earnings of $3.7 million. He was also ordered to pay $1.09 million in restitution.
HIGHLIGHTS OF THE DAY
Important Economic Calender Data
*There is no important calendar data for the rest of the day.
INFORMATION:
*The calendar is based on UTC (Coordinated Universal Time) time zone. The economic calendar content on the relevant page is obtained from reliable news and data providers. The news in the economic calendar content, the date and time of the announcement of the news, possible changes in the previous, expectations and announced figures are made by the data provider institutions. Darkex cannot be held responsible for possible changes that may arise from similar situations
MARKET COMPASS
On the last trading day of the week for traditional markets, European stock markets managed to stay in the green, while Wall Street futures are in a similar outlook. Yesterday, the dollar index gave back some of its gains after a new rise that started with the macro data released. While it is almost certain that the US Federal Reserve (FED) will cut interest rates next week, the course to be followed for 2025 seems more uncertain. Digital assets are relatively flat and, as mentioned in our previous analysis, there is a lack of catalysts for a new bullish wave. While we maintain our view that the main direction is up, we think it would not be surprising to see a sideways movement for a while, unless there is an extraordinary development.
From the short term to the big picture…
The victory of former President Trump on November 5, which was one of the main pillars of our bullish expectation for the long-term outlook in digital assets, produced a result in line with our predictions. Afterwards, the appointments made by the president-elect and the expectations of increased regulation of the crypto ecosystem in the US continued to take place in our equation as a positive variable. Although Powell gave cautious messages in his last speech, the continuation of the FED’s interest rate cut cycle and the volume in BTC ETFs indicating an increase in institutional investor interest (in addition to MicroStrategy’s BTC purchases, BlackRock’s BTC ETF options started trading…) support our upward forecast for the big picture for now.
In the short term, given the nature of the market and pricing behavior, we think it would not be surprising to see occasional pauses or pullbacks in digital assets. However, at this point, it is worth emphasizing again that the fundamental dynamics continue to be bullish.
TECHNICAL ANALYSIS
BTC/USDT
With the election of Donald Trump as US president, pro-crypto Congressman French Hill was appointed as the chairman of the Financial Services Committee, which oversees the SEC. This appointment signals the continuation of positive developments in crypto regulations.
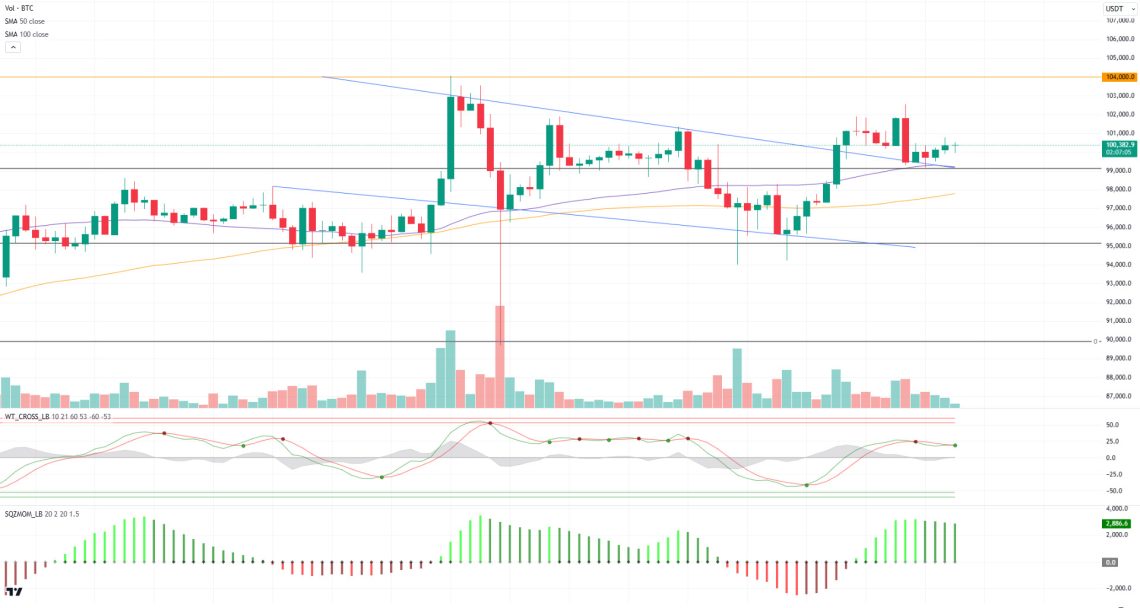
Looking at the BTC technical outlook with the latest development, the price continues to consolidate above six-digit levels, breaking the falling minor trend channel upwards. Closes above this level may continue to support the uptrend. BTC, which is currently trading at 100,400, may see a new attack in its price as technical oscillators give a buy signal again, and exceeding the 102,450 level brings a new ATH level to the agenda . In the event of a possible pullback, we will first follow the 99,140 support level followed by the 100-day SMA line of 97,750 with the loss of the falling upper minor trend line.
Supports 99,140 – 97,200 – 95,000
Resistances 102,450 – 103,500 – 104,000
ETH/USDT
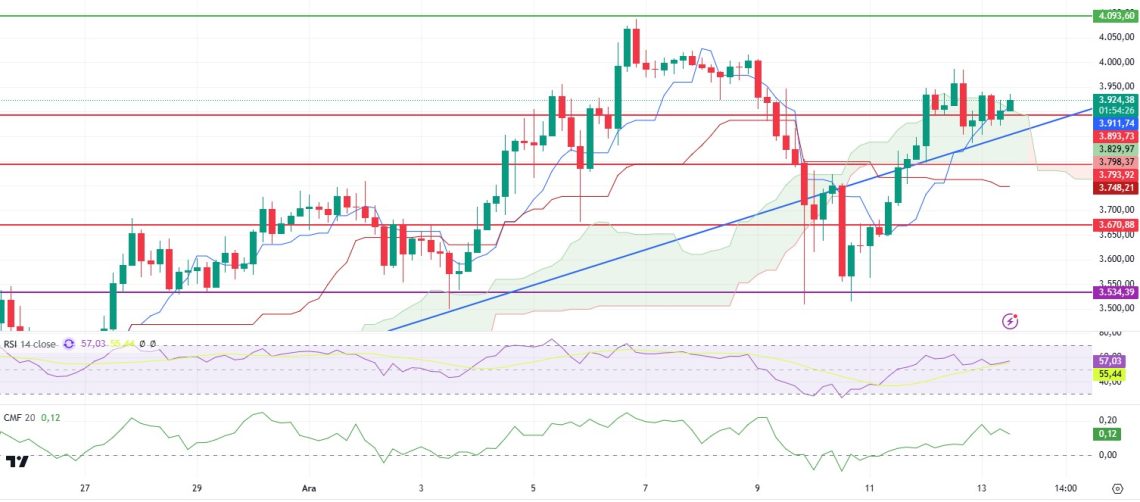
ETH found support at 3,534 after the recent drop and managed to rise back to 3,900 levels. In this region, the price action continues to follow a sideways trend, entering an accumulation phase.
When the Ichimoku Indicator is analyzed, it is seen that the price is stuck at the cloud resistance after the buy signal. If this resistance can be broken, the uptrend can be expected to continue. Relative Strength Index (RSI) shows a positive outlook with the double bottom and upward movement. Chaikin Money Flow (CMF) continues to move sideways in the positive zone, indicating that the market is maintaining strong buyer interest.
The fact that Open Interest resumed its uptrend and this increase did not affect the funding rate is a positive signal for market sentiment. In addition, there are signs of a recovery in the Cumulative Volume Delta (CVD) after the decline after 3,970. This indicates that the selling pressure in the spot market has eased.
In case the price makes a lasting close above the Kumo Cloud, an uptrend up to 4,093 is highly likely. In case of a close below 3,893, the price has the potential to retreat to 3,793.
Supports 3,893 – 3,793 – 3,670
Resistances 4,093 – 4,299 – 4,440
XRP/USDT
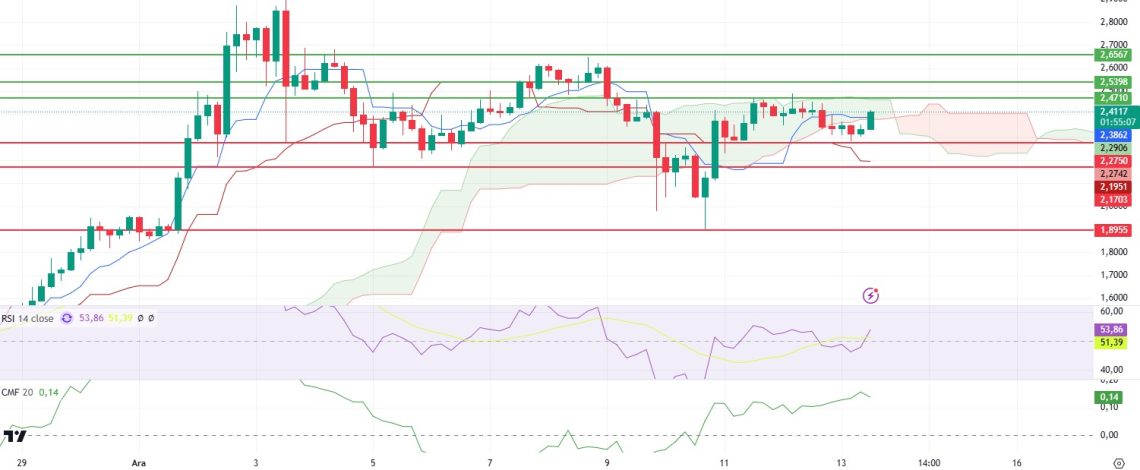
After its recent rise, XRP faced selling pressure at the 2.47 level and retreated to the 2.27 support level. However, with the support it received from this level, it managed to rise into the Kumo Cloud again. With this rebound, the Relative Strength Index (RSI) is showing a positive outlook, exceeding the 52 level. This movement in the RSI signals a renewed strength on the buy side of the market.
The 2.47 level stands out as both the upper band of the Kumo Cloud and an important resistance point for XRP. Breaching this level may pave the way for the price to rise up to 2.65 levels. The 2.27 level stands out as an important intermediate support zone. A downside break of this level could signal a deeper correction in the price. If XRP continues to hold within the Kumo Cloud and breaks the 2.47 resistance, the upside movement can be expected to strengthen. However, caution should be exercised on the loss of the 2.27 support, as this could increase selling pressure.
Supports 2.2750 – 1.1703- 1.8955
Resistances 2.4710 – 2.5398 – 2.6567
SOL/USDT
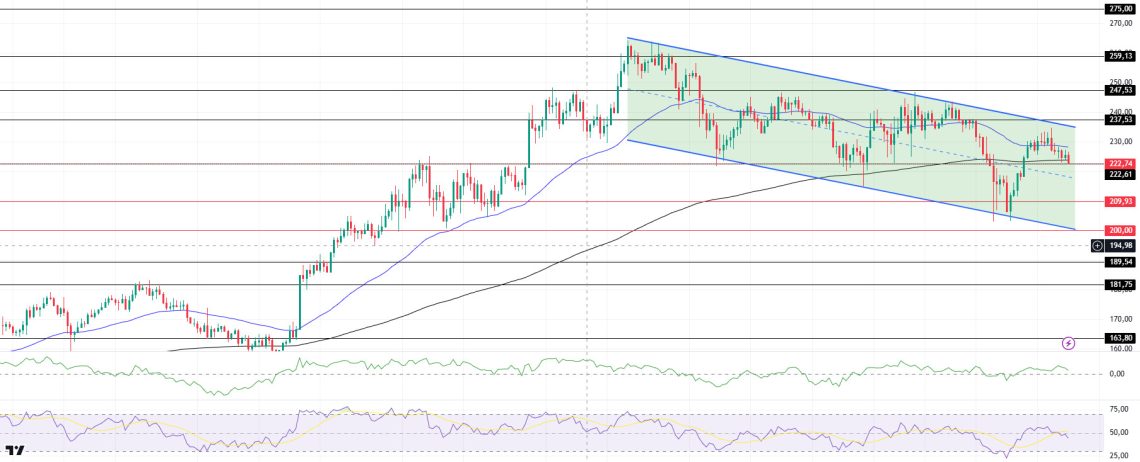
Solana seems to have lost its bullish momentum again. SOL is in the middle of a wide channel. Volume remains low, which means that neither buyers nor sellers are ready for a sharp move. On the 4-hour timeframe, the 50 EMA (Blue Line) is above the 200 EMA (Black Line). Although there is an upward momentum from the support level, the volume started to fall again, making the 200 EMA support and the 50 EMA resistance. When we examine the Chaikin Money Flow (CMF)20 indicator, it is seen that although money inflows are positive, the decline has started. While this is shown as a downward signal, it also means that selling pressure is suppressing the price. However, Relative Strength Index (RSI)14 is in the neutral zone. The 237.53 level stands out as a very strong resistance point in the rises driven by both the upcoming macroeconomic data and the news in the Solana ecosystem. If it breaks here, the rise may continue. In case of retracements for the opposite reasons or due to profit sales, support levels 189.54 and 181.75 can be triggered again. If the price hits these support levels, a potential bullish opportunity may arise if momentum increases.
Supports 222.61 – 209.93 – 200.00
Resistances 237.53 – 247.53 – 259.13
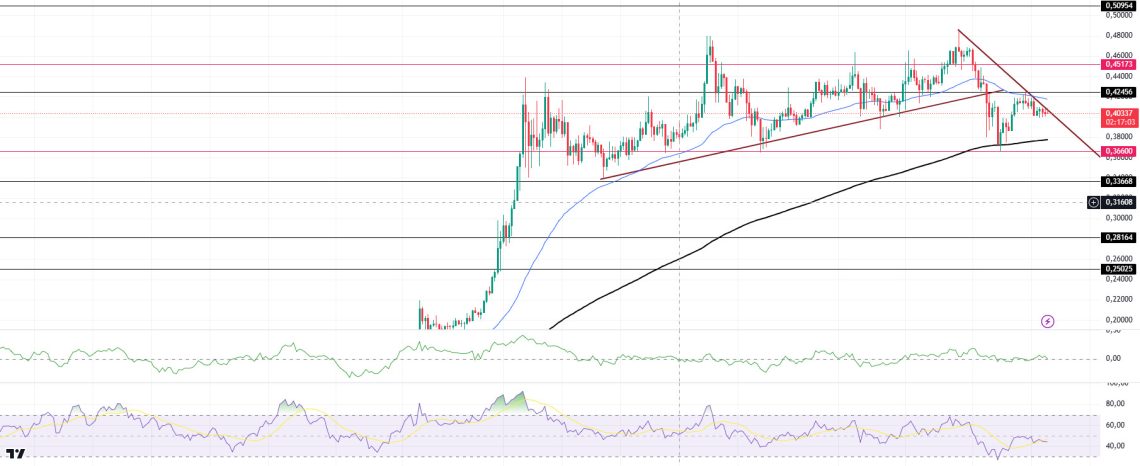
DOGE/USDT
DOGE successfully unwound from overbought levels. The Relative Strength Index (RSI) 14 on the chart returned to the neutral 50 zone. This suggests that the token has relieved the overbought pressure and paved the way for another potential leg upwards. When we look at the chart, the asset, which has been in an uptrend since November 11, has started to move by breaking the trend downwards due to the usual pullback in the market, but the uptrend seems to have started again. Since this move was strong, it tested the 0.42456 level and hit resistance from both this level and the 50 EMA (Blue Line) and lost some momentum. On the 4-hour timeframe, the 50 EMA (Blue Line) is above the 200 EMA (Black Line). On the other hand, when we look at the Relative Strength Index (RSI) 14 indicator, it is deployed at a neutral level. However, when we examine the Chaikin Money Flow (CMF)20 indicator, it maintains its neutrality even though there are a few money outflows. The 0.50954 level stands out as a very strong resistance place in the rises driven by both the upcoming macroeconomic data and the innovations in the Doge coin. If DOGE maintains its momentum and rises above this level, the rise may continue strongly. In case of possible retracements due to macroeconomic reasons or negativities in the ecosystem, the 0.33668 support level is an important support level. If the price reaches these support levels, a potential bullish opportunity may arise if momentum increases.
Supports 0.36600 – 0.33668 – 0.28164
Resistances 0.42456 – 0.45173 – 0.50954
LEGAL NOTICE
The investment information, comments and recommendations contained herein do not constitute investment advice. Investment advisory services are provided individually by authorized institutions taking into account the risk and return preferences of individuals. The comments and recommendations contained herein are of a general nature. These recommendations may not be suitable for your financial situation and risk and return preferences. Therefore, making an investment decision based solely on the information contained herein may not produce results in line with your expectations.


