MARKET SUMMARY
Latest Situation in Crypto Assets
| Assets | Last Price | 24h Change | Dominance | Market Cap |
|---|---|---|---|---|
| BTC | 103,949.99$ | 1.18% | 56.29% | 2,06 T |
| ETH | 3,899.97$ | 0.26% | 12.86% | 469,92 B |
| XRP | 2.380$ | -1.32% | 3.72% | 136,12 B |
| SOLANA | 216.12$ | -1.65% | 2.83% | 103,41 B |
| DOGE | 0.3961$ | -1.54% | 1.60% | 58,32 B |
| CARDANO | 1.0620$ | -2.09% | 1.02% | 37,32 B |
| TRX | 0.2776$ | -2.95% | 0.66% | 23,99 B |
| AVAX | 48.49$ | -4.12% | 0.54% | 19,90 B |
| LINK | 29.48$ | 2.62% | 0.51% | 18,57 B |
| SHIB | 0.00002681$ | -3.56% | 0.43% | 15,82 B |
| DOT | 8.683$ | -3.18% | 0.36% | 13,28 B |
*Prepared on 12.16.2024 at 14:00 (UTC)
WHAT’S LEFT BEHIND
MicroStrategy Buys Another 15,350 Bitcoins
MicroStrategy made a new $1.5 billion purchase, paying $100,386 for each Bitcoin. The company’s total Bitcoin purchase cost average reached $61,725.
Digital Asset Investment Products See $44.5 Billion Inflows
According to a CoinShares report, digital asset investment products have received $44.5 billion in inflows this year, four times more than any other year. Bitcoin investment products have attracted inflows totaling $11.5 billion since the US election.
UK Plans to Ban Cryptocurrency IPOs
The UK’s Financial Conduct Authority (FCA) has announced that it is working on a law banning the IPO of cryptocurrencies. This regulation would only allow platforms and products that qualify for an exemption to IPO.
Avalanche’s 9000 Update Active Today
The Avalanche9000 update, an important milestone for the Avalanche network, went live today. The update improves the functioning of “subnets” and greatly reduces the cost for users to build their own Tier-1 networks.
HIGHLIGHTS OF THE DAY
Important Economic Calender Data
| Time | News | Expectation | Previous |
|---|---|---|---|
| 14:45 | US Flash Manufacturing PMI (Dec) | 49.4 | 49.7 |
| 14:45 | US Flash Services PMI (Dec) | 55.7 | 56.1 |
INFORMATION:
*The calendar is based on UTC (Coordinated Universal Time) time zone. The economic calendar content on the relevant page is obtained from reliable news and data providers. The news in the economic calendar content, the date and time of the announcement of the news, possible changes in the previous, expectations and announced figures are made by the data provider institutions. Darkex cannot be held responsible for possible changes that may arise from similar situations.
MARKET COMPASS
While the markets are eagerly awaiting the US Federal Reserve’s announcements on Wednesday evening, today they will be watching the PMI data for the world’s largest economy. Ahead of this, we see stock market indices down and Wall Street futures slightly higher on the back of political tensions in Europe and lower-than-expected PMI figures. Bitcoin retreated a bit in this environment, in line with the nature of the market, after a rally on Trump’s recent statements. Expectations for the US economy may shape the markets later in the day and, as we mentioned, macro indicators may be important. For intraday trading, after the recent pullbacks, for each asset, it looks like the declines may continue if they fail to hold on to their important supports.
From the short term to the big picture….
The victory of former President Trump on November 5, which was one of the main pillars of our bullish expectation for the long-term outlook in digital assets, produced a result in line with our predictions. Afterwards, the appointments made by the president-elect and the expectations of increased regulation of the crypto ecosystem in the US continued to take place in our equation as a positive variable. Although Powell gave cautious messages in his last speech, the continuation of the FED’s interest rate cut cycle and the volume in BTC ETFs indicating an increase in institutional investor interest (in addition to MicroStrategy’s BTC purchases, BlackRock’s BTC ETF options started trading…) support our upward forecast for the big picture for now.
In the short term, given the nature of the market and pricing behavior, we think it would not be surprising to see occasional pauses or pullbacks in digital assets. However, at this point, it is worth emphasizing again that the fundamental dynamics continue to be bullish.
TECHNICAL ANALYSIS
BTC/USDT
MicroStrategy, which has recently come to the fore with Bitcoin purchases every Monday, continued its purchases this week. The company made a new investment of $ 1.5 billion, paying an average of $ 100,386 for each Bitcoin. With this purchase, MicroStrategy’s average purchase cost per Bitcoin reached $ 61,725. A weekly report was also published by CoinShares. In the report, it was emphasized that there has been a total of $ 11.5 billion in Bitcoin investment products since the US elections.
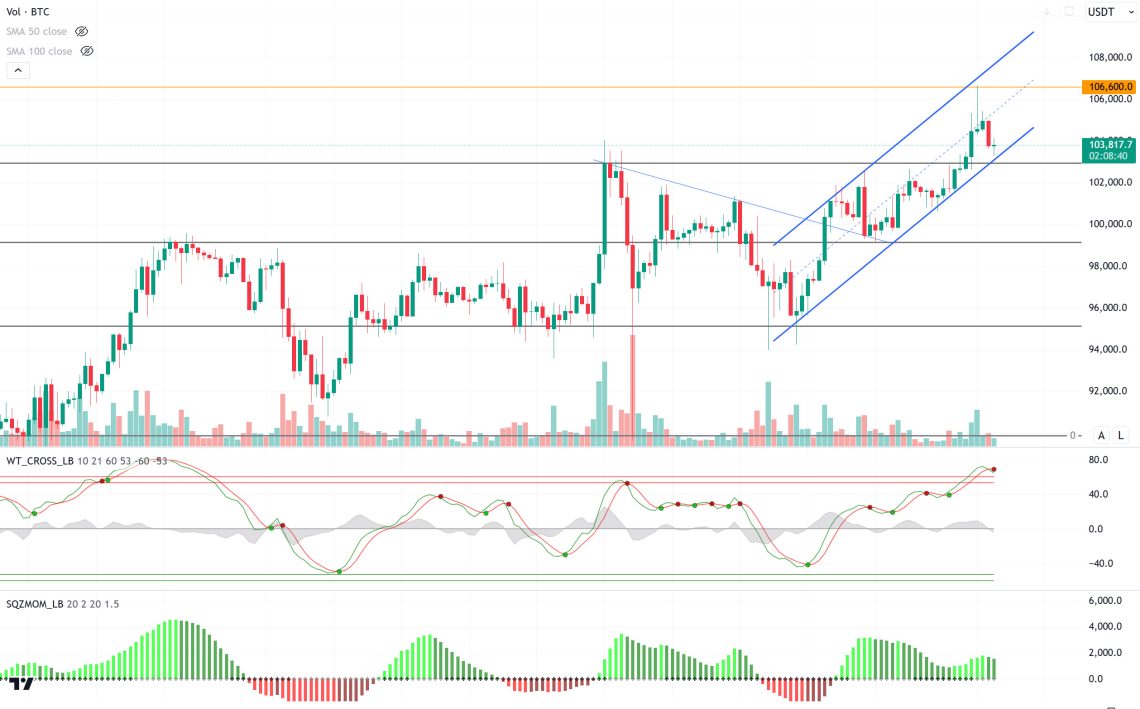
With the recent developments, BTC’s technical outlook shows that a new uptrend has started with the break of the falling minor channel. BTC, which is currently moving within the ascending parallel channel, is trading at 103,800. However, technical oscillators are giving sell signals on the hourly charts, while the momentum indicator is showing a weakening outlook. If selling pressure increases, a loss of the 102,900 support level could send BTC back to the horizontal band range. If the uptrend continues, the mid-channel line could lead to some retracement as it has been tested as resistance several times in the past. This could create short-term trading opportunities.
Supports 102,900 – 101,400 – 100,000
Resistances 106,488 – 110,000 – 115,000
ETH/USDT
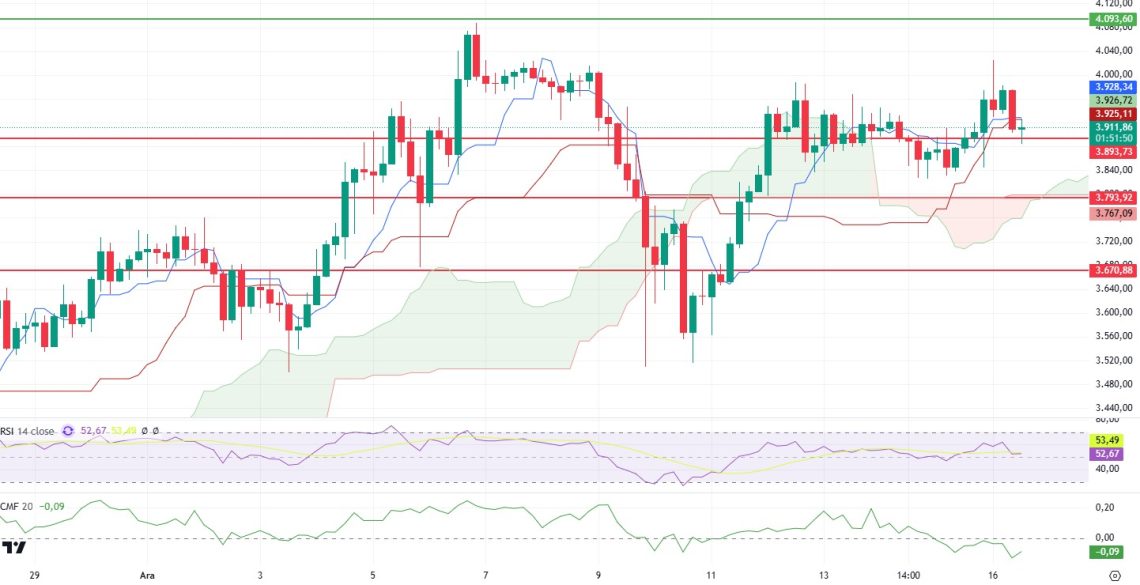
As highlighted in the morning analysis, the negative structures on Chaikin Money Flow (CMF) and Relative Strength Index (RSI) caused the price to retreat to the 3,893 support. The correction after Bitcoin’s all-time high (ATH) yesterday also put selling pressure on ETH, affecting the market.
With this pullback, the funding rate falling below 0.02 again can be considered as a positive sign. Moreover, Cumulative Volume Delta (CVD) data showed that the selling pressure mainly came from the futures market while the spot side remained more resilient. This is an important factor supporting the positive outlook.
In addition, the positive divergence on CMF and the RSI level reaching the support zone indicate that the price may react from these zones and move back to the uptrend.
However, closes below 3,893 may deepen the decline and cause the price to fall as low as 3,793. Therefore, it is important to closely monitor critical support levels.
Supports 3,893 – 3,793 – 3,670
Resistances 4,093 – 4,299 – 4,440
XRP/USDT
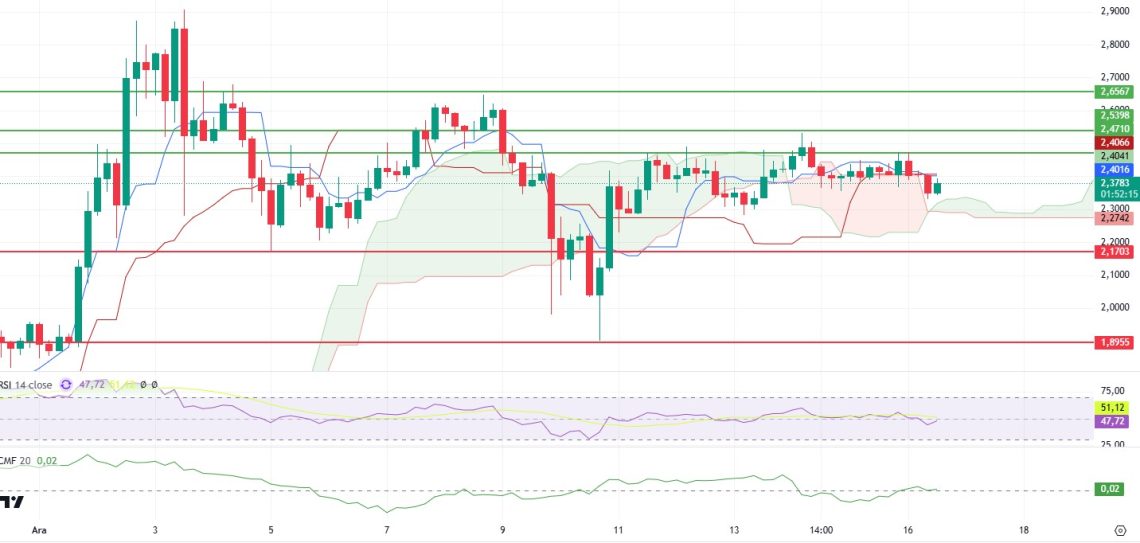
XRP recovered slightly after the decline during the day and managed to rise above the 2.37 level again. However, there is a sell signal in the ichimoku indicator after the intersection of the tenkan level and kijun level. If the intersection of these levels fails to gain the 2.4 level, it can be seen that the price retreats a little more.
Analyzing the technical indicators, the Relative Strength Index (RSI) is close to the neutral zone, indicating that there is no clear direction in the market. Also, the Chaikin Money Flow (CMF) indicator shows that the money flowing in and out of the market is in balance.
In the coming days, maintaining the $2.28 support and breaking through the $2.47 resistance could support XRP’s upward movement. However, a close below $2.28 could increase the downside risk.
Supports 2.2750 – 1.1703- 1.8955
Resistances 2.4710 – 2.5398 – 2.6567
SOL/USDT
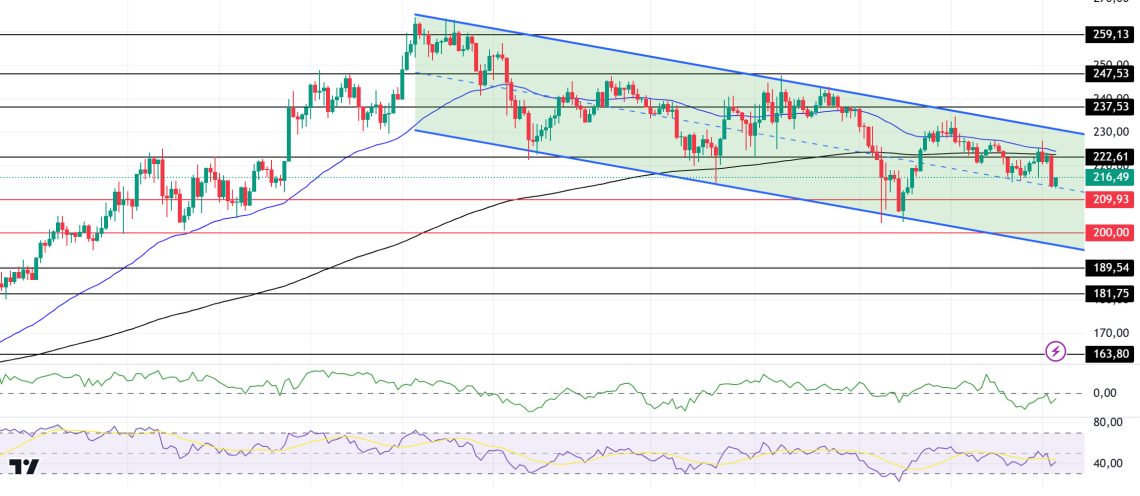
SOL lost its bullish momentum and started to decline. The asset is in the middle of a broad downtrend and volume remains low. This means that neither buyers nor sellers are ready for a sharp move. On the 4-hour timeframe, the 50 EMA (Blue Line) is above the 200 EMA (Black Line). But the moving averages are about to touch each other. Although there was an upward momentum from the support level, volume started to fall again. As a matter of fact, the asset is trying to set a direction by making the 200 EMA and 50 EMA as resistance. When we analyze the Chaikin Money Flow (CMF)20 indicator, the negative trend continues even though money inflows are increasing. However, Relative Strength Index (RSI)14 is moving from the neutral zone to the overbought zone. The 237.53 level stands out as a very strong resistance point in the rises driven by both the upcoming macroeconomic data and the news in the Solana ecosystem. If it breaks here, the rise may continue. In case of retracements for the opposite reasons or due to profit sales, the support levels of 189.54 and 181.75 can be triggered again. If the price hits these support levels, a potential bullish opportunity may arise if momentum increases.
Supports 209.93 – 200.00 – 189.54
Resistances 222.61 – 237.53 – 247.53
DOGE/USDT
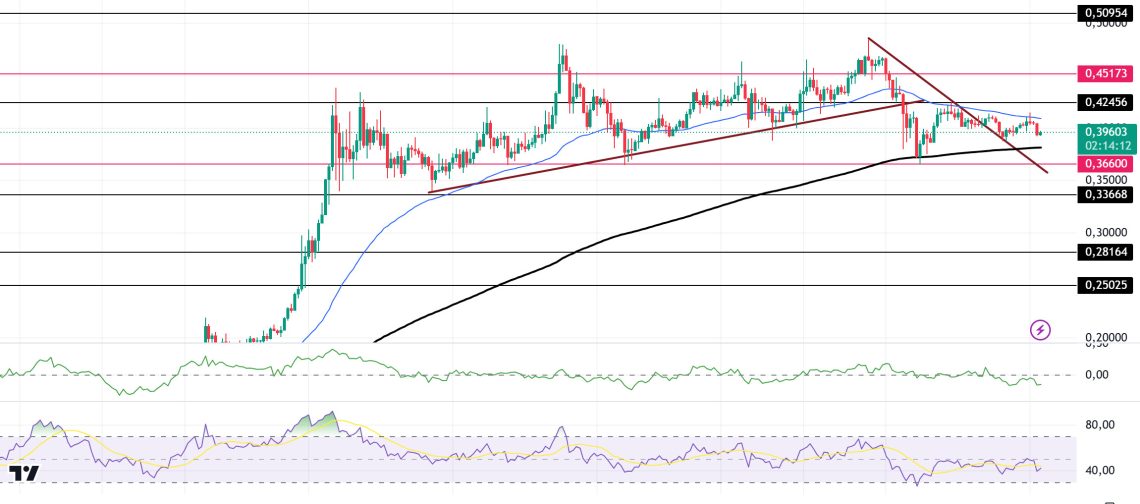
DOGE successfully unwound from overbought levels. Relative Strength Index (RSI) 14 on the chart returned to the neutral zone. This suggests that the token has relieved the overbought pressure and paved the way for another potential leg upwards. Since December 8, the asset has been in a downtrend, reversing BTC’s downtrend from the usual market rallies. Although the asset moved sideways, it failed to break the 0.42456 level to the downside and is very close to using the 200 EMA (Black Line) as support. On the 4-hour timeframe, the 50 EMA (Blue Line) is above the 200 EMA (Black Line). On the other hand, when we look at the Relative Strength Index (RSI) 14 indicator, it is deployed at a neutral level. However, when we examine the Chaikin Money Flow (CMF)20 indicator, there is a small amount of money outflows and suppresses the price. The level of 0.50954 appears to be a very strong resistance place in the rises driven by both the upcoming macroeconomic data and the innovations in the Doge coin. If DOGE maintains its momentum and rises above this level, the rise may continue strongly. In case of possible retracements due to macroeconomic reasons or negativities in the ecosystem, the 0.33668 support level is an important support level. If the price reaches these support levels, a potential bullish opportunity may arise if momentum increases.
Supports 0.36600 – 0.33668 – 0.28164
Resistances 0.42456 – 0.45173 – 0.50954
LEGAL NOTICE
The investment information, comments and recommendations contained herein do not constitute investment advice. Investment advisory services are provided individually by authorized institutions taking into account the risk and return preferences of individuals. The comments and recommendations contained herein are of a general nature. These recommendations may not be suitable for your financial situation and risk and return preferences. Therefore, making an investment decision based solely on the information contained herein may not produce results in line with your expectations.


