MARKET SUMMARY
Latest Situation in Crypto Assets
| Assets | Last Price | 24h Change | Dominance | Market Cap. |
|---|---|---|---|---|
| BTC | 101,960.72 | -2.66% | 57.23% | 2,02 T |
| ETH | 3,682.07 | -4.49% | 12.58% | 443,07 B |
| XRP | 2.370 | -6.67% | 3.84% | 135,40 B |
| SOLANA | 207.91 | -4.08% | 2.82% | 99,61 B |
| DOGE | 0.3635 | -5.37% | 1.52% | 53,50 B |
| CARDANO | 0.9619 | -6.72% | 0.96% | 33,78 B |
| TRX | 0.2637 | -3.02% | 0.64% | 22,73 B |
| AVAX | 42.44 | -8.32% | 0.49% | 17,38 B |
| LINK | 24.77 | -8.35% | 0.44% | 15,50 B |
| SHIB | 0.00002401 | -6.28% | 0.40% | 14,13 B |
| DOT | 7.578 | -7.59% | 0.33% | 11,58 B |
*Prepared on 12.19.2024 at 14:00 (UTC)
WHAT’S LEFT BEHIND
Michael Saylor: “We Will Change Our Bitcoin Strategy Once We Reach Our Target”
Michael Saylor, founder of MicroStrategy, announced that the company will change their fundraising strategy after completing their $42 billion Bitcoin acquisition target. Saylor stated that they will follow a “smarter” method in the future.
Matt Hougan: “Fed Decision Will Not Affect the Bull Season”
While the Fed’s 25-basis-point rate cut and projections of diminishing interest rate cuts for 2025 have sparked debate in the crypto market, Bitwise manager Matt Hougan argued that these developments will not affect the bull season in any way.
Hut 8 Increases Reserves by 990 BTC to $1 Billion
Bitcoin mining company Hut 8 added another 990 BTC to its reserves, bringing its total assets to 10,096 BTC. The company’s total market capitalization reached $1 billion. CEO Asher Giot announced that they will evaluate opportunities to buy more Bitcoin on the open market.
HIGHLIGHTS OF THE DAY
Important Economic Calender Data
INFORMATION
| Time | News | Expectation | Previous |
|---|---|---|---|
| 15:00 | US Existing Home Sales (Nov) | 4.09M | 3.96M |
*The calendar is based on UTC (Coordinated Universal Time) time zone.
The economic calendar content on the relevant page is obtained from reliable news and data providers. The news in the economic calendar content, the date and time of the announcement of the news, possible changes in the previous, expectations and announced figures are made by the data provider institutions. Darkex cannot be held responsible for possible changes that may arise from similar situations.
MARKET COMPASS
Following the US Federal Reserve’s (FED) final decisions of the year announced yesterday, markets are trying to digest the new changes in the dynamics of the equation. As we mentioned in our morning analysis, the post-FED decline in digital assets has managed to give way to some recovery trend. We do not expect this momentum to continue steadily for now, and we think that the pressure may continue in the short term, albeit with intermediate rebounds. However, we continue to think that the main trend is up, despite some dose changes in our variables.
Following the FED’s announcements and rate cut yesterday, data from the US today indicated that things are generally going well in the world’s largest economy. However, we had stated that the immediate impact of macro indicators on prices may be weak after the FED decisions, which is a critical bend, and so far it has been the case.
Wall Street futures are pointing to a natural positive opening today after yesterday’s sharp declines. European stock markets, on the other hand, are in negative territory with the FED effect. There is no important data flow in the rest of the day and we think that the pressure on digital assets may continue if declines follow the upward opening in the US stock markets.
From the short term to the big picture.
The victory of former President Trump on November 5, which was one of the main pillars of our bullish expectation for the long-term outlook in digital assets, produced a result in line with our predictions. Afterwards, the president-elect’s appointments and expectations of increased regulation of the crypto ecosystem in the US continued to be a positive variable in our equation. Although expected to continue at a slower pace, the continuation of the FED’s interest rate cut cycle and the volume in BTC ETFs indicating an increase in institutional investor interest (in addition to MicroStrategy’s BTC purchases, BlackRock’s BTC ETF options trading…) support our upward forecast for the big picture for now.
In the short term, given the nature of the market and pricing behavior, we think it would not be surprising to see occasional pauses or pullbacks in digital assets. However, at this point, it is worth emphasizing again that the fundamental dynamics continue to be bullish. We think that the declines that took place after the FED’s recent statements are in line with the market fabric and are necessary for healthier rises for the long term.
TECHNICAL ANALYSIS
BTC/USDT
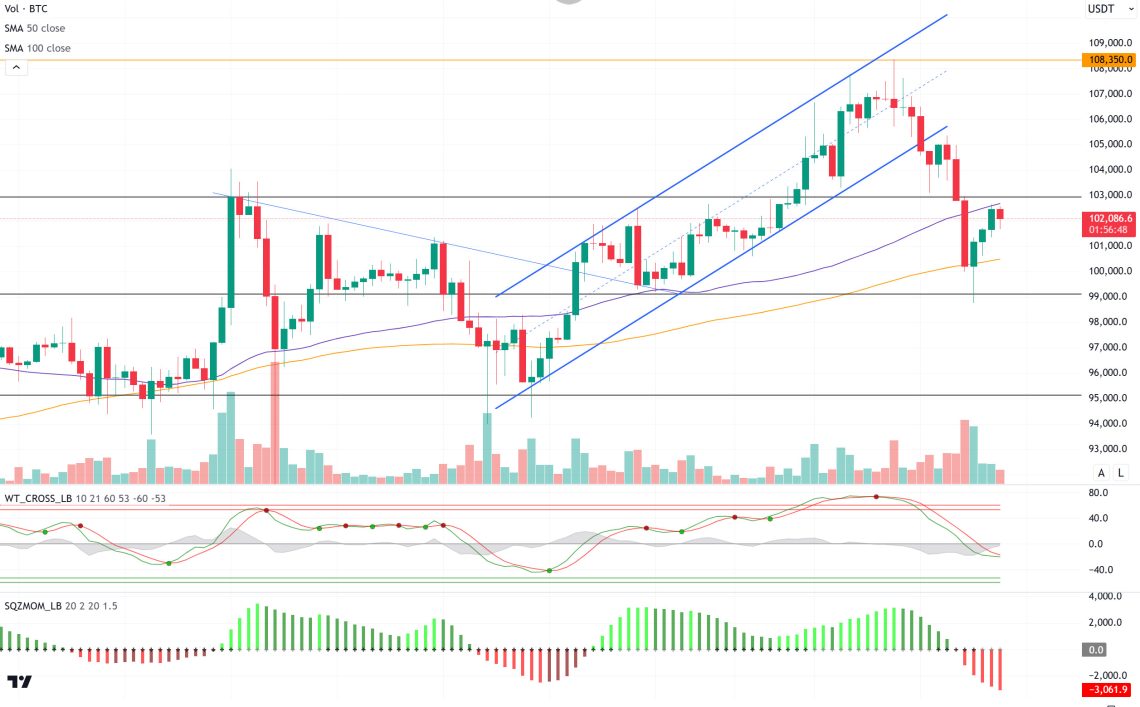
After the FED’s interest rate cut decision, Chairman Powell’s statement that they foresee limited interest rate cuts for 2025 led Bitcoin to start a correction movement. In the period following the meeting, it was observed that corporate companies considered this decline as a buying opportunity. In particular, Bitcoin mining firms Marathon Digital (MARA) and Hut 8 strengthened their positions by continuing to add new Bitcoin to their reserves.
When we look at the technical outlook with the latest developments, BTC, which received support from the 100-day SMA line, turned its direction upwards again and tested the 102,600 level during the day. Currently trading between the 50 and 100-day SMA lines at 101,900, BTC’s technical oscillators are about to signal buying, while the momentum indicator is in a weak picture. In the continuation of the rise, 102,900 is the resistance level, while exceeding this level strengthens the upward momentum, while in a possible new selling pressure, we will watch the 100-day SMA line again in the retracement.
Supports 101,400 – 100,350 – 99,100
Resistances 102,900 – 104,500 – 106,600
ETH/USDT
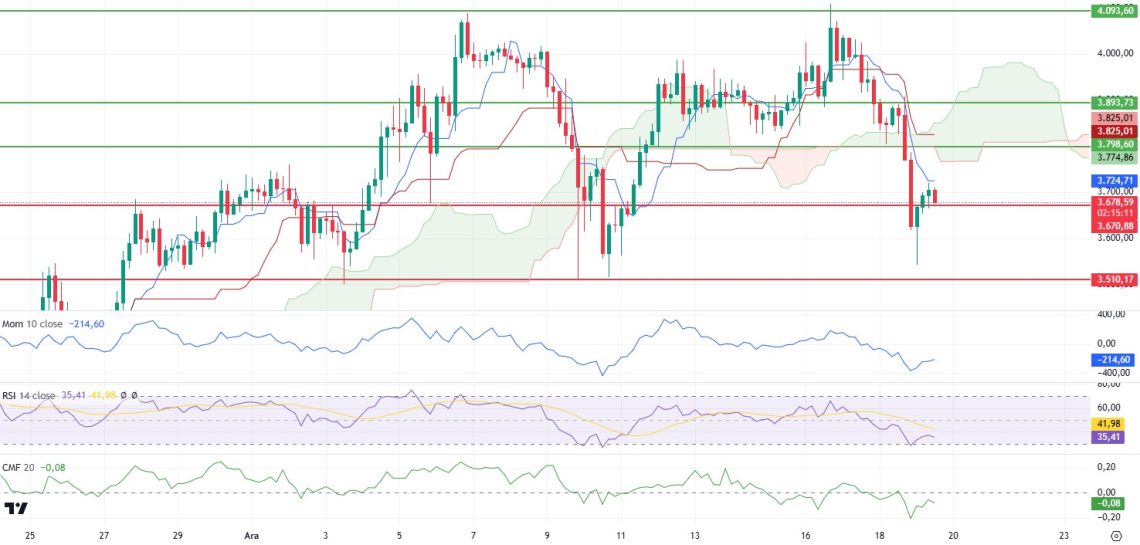
ETH, which tends to recover after yesterday’s decline, regained the critical 3,670 support level and continues to be priced above this region. This could be considered a positive signal in the short term, but market dynamics continue to present a mixed picture. Cumulative Volume Delta (CVD) data shows that selling pressure continues in the spot market, while buyers are stronger in the futures market. This divergence has the potential to have a negative impact on the price.
Analyzing the technical indicators, the momentum started to move upwards again, which is a positive development, while the Chaikin Money Flow (CMF) indicator showing a downward trend in the negative zone supports that selling pressure is still effective. In addition, the fact that the Relative Strength Index (RSI) indicator weakened its recovery trend after entering the oversold zone during the decline indicates that there is not enough strength on the buy side of the market.
In light of this data, ETH is likely to test the 3,510-support level again if the 3,670 level is lost. For a positive scenario, ETH needs to rise to the kumo cloud level on the Ichimoku indicator. If this level is breached, the negative outlook on the price could be left behind and a stronger uptrend could begin. In general, however, given both the instability in market data and the conflicting signals of technical indicators, it is important for investors to be cautious and closely monitor important support-resistance levels.
Supports 3,670 – 3,510- 3,293
Resistances 3,798 – 3,893 – 4,093
XRP/USDT
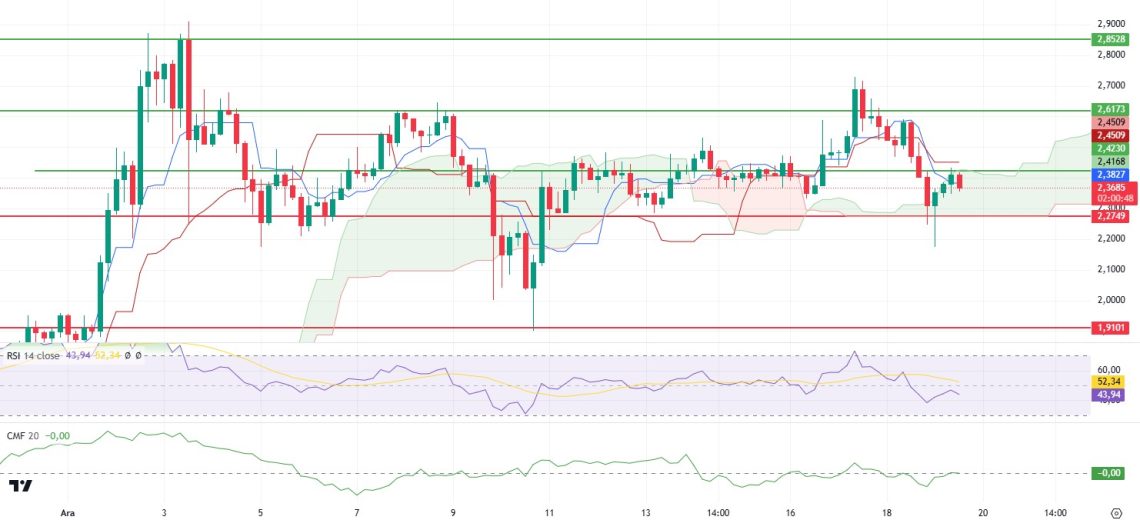
XRP, which managed to remain strong despite the general market declining after Fed Chairman Powell’s speech yesterday, recovered after retreating to 2.17 levels, regained the sand cloud level and rose above 2.27. XRP, which rose to the upper band of the sand cloud during the day, experienced a slight retreat with the selling pressure it faced at this level.
Analyzing the technical indicators, the Chaikin Money Flow (CMF) indicator rose from the negative zone to the zero level, where it moved sideways. This indicates that market liquidity has stabilized but the buy side is not strong enough. The Relative Strength Index (RSI) indicator is still slightly negative, suggesting that the current bullish move is on a weak footing.
It is critical to overcome the kumo cloud resistance at 2.42 to invalidate the previous sell signal on the Ichimoku indicator and regain a positive outlook. A sustained move above this level could allow XRP to transition to a positive structure and create a stronger upward momentum. However, if 2.27 support is lost, there is a risk of deepening the decline.
Supports 2.2749 – 1.9101- 1.6309
Resistances 2.4230 – 2.6173 – 2.8528
SOL/USDT
BNSOL, the SOL liquid staking token of a centralized exchange, reached $1 billion TVL in three months. 4.8 million SOL staked. BNSOL accounts for more than 10% of Solana’s $9 billion liquid staking market. On the other hand, research platform Syndica reported that Solana-based DApps generated $365 million in revenue in November. According to the data, Pump.fun became the first Solana DApp to exceed $100 million in monthly revenue. There has been a high outflow of SOL from exchanges. As of now, exchange net flow is largely negative and over $264 million SOL has moved out of exchanges in the last 96 hours. In the last 24 hours alone, $46.26 million worth of SOL was withdrawn, contributing to the market’s strengthening from further declines.
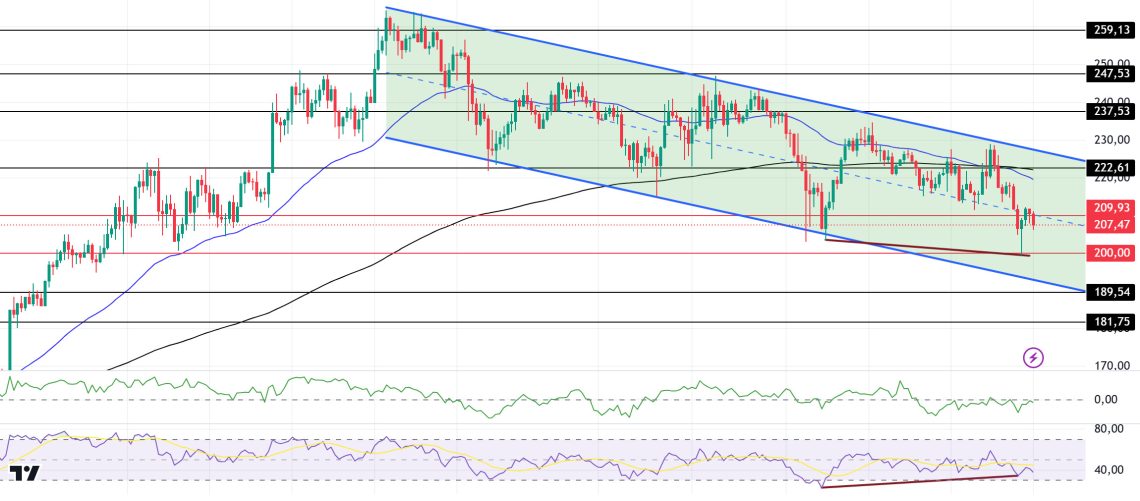
SOL kept pace with the market’s decline and the fall deepened. The asset, which has been flat since our morning analysis, is in the middle of a broad downtrend and the price is in the middle of a downtrend. On the 4-hour timeframe, the 50 EMA (Blue Line) started to trend below the 200 EMA (Black Line). Will this end the bull in the asset? Although there was downward momentum from the resistance level, the asset managed to stay within the downtrend. When we analyze the Chaikin Money Flow (CMF)20 indicator, the increase in money outflows increases selling pressure. However, Relative Strength Index (RSI)14 is moving from the neutral zone to the oversold zone. On the other hand, there is a mismatch between RSI (14) and the price. This may push the price of SOL higher. The 222.61 level stands out as a very strong resistance point in the rises driven by both the upcoming macroeconomic data and the news in the Solana ecosystem. If it breaks here, the rise may continue. In case of retracements for the opposite reasons or due to profit sales, the support levels of 189.54 and 181.75 can be triggered again. If the price hits these support levels, a potential bullish opportunity may arise if momentum increases.
Supports 200.00 – 189.54 – 181.75
Resistances 209.93 – 222.61 – 237.53
DOGE/USDT
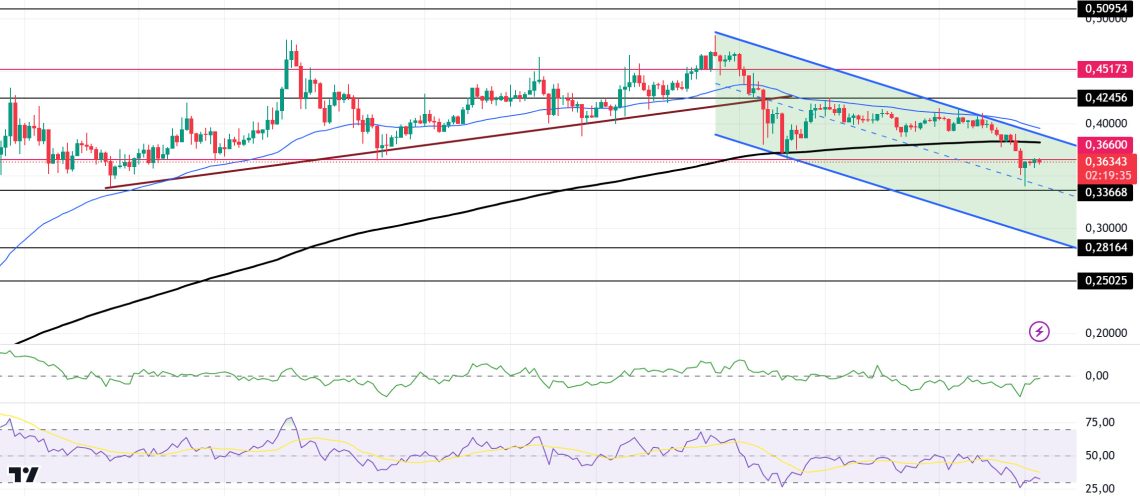
Since December 8, the asset has been in a downtrend, with the downtrend stemming from BTC’s usual declines in the market. Although it has been moving sideways for a long time, it could not prevent it from breaking the 200 EMA (Black Line) and the 0.36600 level downwards. The asset, which has been flat since our analysis in the morning, has been above the 50 EMA (Blue Line) and 200 EMA (Black Line) in the 4-hour timeframe. However, when we examine the Chaikin Money Flow (CMF)20 indicator, there are money outflows and suppress the price. However, Relative Strength Index (RSI)14 has reached the oversold zone from the neutral zone level. The 0.42456 level stands out as a very strong resistance point in the rises driven by both the upcoming macroeconomic data and the innovations in the Doge coin. If DOGE catches a new momentum and rises above this level, the rise may continue strongly. In case of possible pullbacks due to macroeconomic reasons or negativities in the ecosystem, the 0.33668 support level is an important support level. If the price reaches these support levels, a potential bullish opportunity may arise if momentum increases.
Supports 0.33668 – 0.28164 – 0.25025
Resistances 0.36600 – 0.42456 – 0.45173
LEGAL NOTICE
The investment information, comments and recommendations contained herein do not constitute investment advice. Investment advisory services are provided individually by authorized institutions taking into account the risk and return preferences of individuals. The comments and recommendations contained herein are of a general nature. These recommendations may not be suitable for your financial situation and risk and return preferences. Therefore, making an investment decision based solely on the information contained herein may not produce results in line with your expectations.
