MARKET SUMMARY
Latest Situation in Crypto Assets
| Assets | Last Price | 24h Change | Dominance | Market Cap. |
|---|---|---|---|---|
| BTC | 95,660.94 | -1.71% | 55.51% | 1,89 T |
| ETH | 3,619.59 | -2.40% | 12.80% | 435,93 B |
| XRP | 2.438 | 27.45% | 4.08% | 138,87 B |
| SOLANA | 225.16 | -5.61% | 3.14% | 107,73 B |
| DOGE | 0.4191 | -1.30% | 1.81% | 61,58 B |
| CARDANO | 1.0999 | 3.04% | 1.13% | 38,54 B |
| AVAX | 48.37 | 8.76% | 0.58% | 19,76 B |
| TRX | 0.2084 | -0.12% | 0.53% | 17,98 B |
| SHIB | 0.00002925 | -8.85% | 0.50% | 17,19 B |
| DOT | 8.824 | -3.16% | 0.39% | 13,43 B |
| LINK | 21.13 | 13.32% | 0.39% | 13,25 B |
*Prepared on 12.2.2024 at 14:00 (UTC)
WHAT’S LEFT BEHIND
Marathon Holdings Buys Another 6484 BTC
US Bitcoin mining company Marathon Holdings bought 6484 BTC between October 1 and November 30. The company paid a total of $618.3 million for these Bitcoins. It also announced $700 million in private funding through convertible bonds. If the bond sales are completed, an additional $105 million put option will be exercised and more Bitcoin will be purchased with this fund.
WisdomTree Files for XRP Spot ETF
WisdomTree has filed an official XRP spot ETF application with the US Securities and Exchange Commission (SEC). If the application is approved, the fund will begin trading on the Cboe BZX exchange. BNY Mellon bank will be responsible for custody and transfers of XRP tokens.
Spot Crypto Trading Volume Reached $2.7 Trillion in November
Crypto market spot trading volume reached $2.7 trillion in November, the highest level since May 2021. Much of this increase, which was more than double the trading volume in October, came from Binance. Binance processed more than $986 billion in transactions in November. Crypto.com, Upbit and Bybit continued to grow with more than $200 billion in trading volume.
Microstrategy Buys Another 15,400 BTC for $1.5 Billion
Microstrategy spent nearly $1.5 billion to increase its holdings of 15,400 BTC. At approximately $95,976 per Bitcoin, the purchase resulted in a quarterly total return of 38.7% and an annualized total return of 63.3%. As of December 2, 2024, Microstrategy holds 402,100 BTC, worth approximately $23.4 billion.
HIGHLIGHTS OF THE DAY
Important Economic Calender Data
| Time | News | Expectation | Previous |
|---|---|---|---|
| 14:45 | US Final Manufacturing PMI (Nov) | 48.8 | 48.8 |
| 15:00 | US ISM Manufacturing PMI (Nov) | 47.7 | 46.5 |
| 20:15 | US FOMC Member Waller Speaks | – | – |
| 21:30 | US FOMC Member Williams Speaks | – | – |
INFORMATION:
*The calendar is based on UTC (Coordinated Universal Time) time zone. The economic calendar content on the relevant page is obtained from reliable news and data providers. The news in the economic calendar content, the date and time of the announcement of the news, possible changes in the previous, expectations and announced figures are made by the data provider institutions. Darkex cannot be held responsible for possible changes that may arise from similar situations.
MARKET COMPASS
While the political instability in Europe centered on France and Trump’s threats to increase tariffs on BRICS countries weakened risk appetite, markets are also wondering what the US Federal Reserve’s (FED) interest rate decision will be in the last month of the year. In this regard, macro indicators that will shape expectations and be published on the health of the world’s largest economy will be monitored throughout the week. Today, both the indicators and the statements of FED officials will be on the radar of the markets. We anticipate that the recent pressure on digital assets will ease somewhat during the US session, but the agenda and future data and statements will be decisive for the short-term direction.
From the short term to the big picture.
The victory of former President Trump on November 5, which was one of the main pillars of our bullish expectation for the long-term outlook in digital assets, produced a result in line with our forecasts. In the aftermath, the president-elect’s appointments to Congress and the increased regulatory expectations for the crypto ecosystem in the US remained in our equation as a positive variable. Although Powell gave cautious messages in his last speech, the fact that the FED continued its interest rate cut cycle and the volume in BTC ETFs indicates an increase in institutional investor interest (in addition, MicroStrategy’s BTC purchases, Microsoft’s start to evaluate the purchase issue, BlackRock’s BTC ETF options start trading …) supports our upward forecast for the big picture for now.
For the short term, given the nature of the market and pricing behavior, we think it would not be surprising to see occasional respite or pullbacks in digital assets. However, at this point, it would be useful to underline again that the fundamental dynamics continue to be bullish.
TECHNICAL ANALYSIS
BTC/USDT
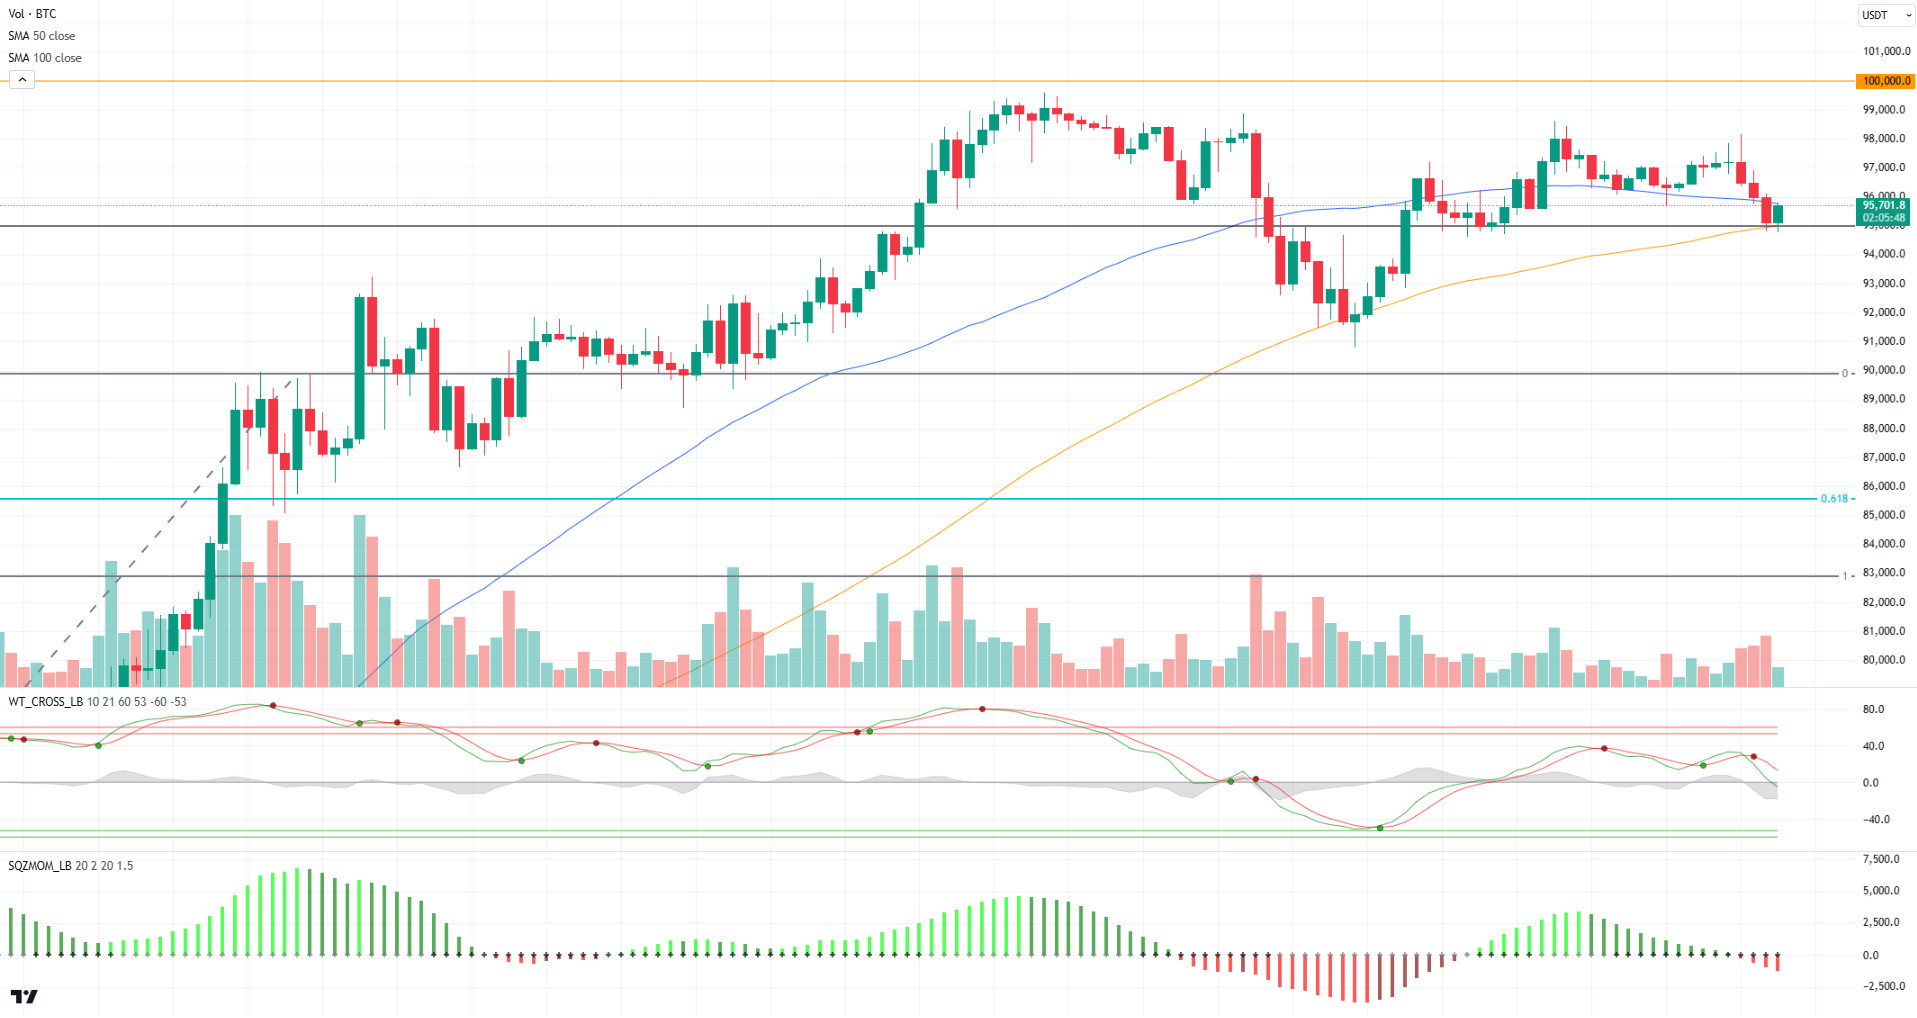
MicroStrategy continues its Bitcoin purchases unabated. According to the information shared during the day, the company announced that it purchased 15,400 BTC with a total value of $1.5 billion at an average price of $95,976. With these latest purchases, the total amount of Bitcoin owned by MicroStrategy reached 402,100, with a current value of approximately $23.4 billion.
When we look at the BTC technical outlook after the latest development, the price, which tested the 100-day SMA line once again during the day, received a reaction from this level. Currently trading at 95,700, BTC is pushing the 50-day SMA level again. With global markets starting the week positively, the opening of US indices in parallel to the US indices may turn the direction up again in BTC. However, with technical oscillators giving a sell signal on hourly charts, the momentum indicator turning negative emphasizes the critical importance of the 95,000 level. While pricing above this level is perceived positively, closures below it may increase selling pressure.
Supports 95,000 – 92,500 – 90,000
Resistances 99,655 – 100,000 – 105,000
ETH/USDT
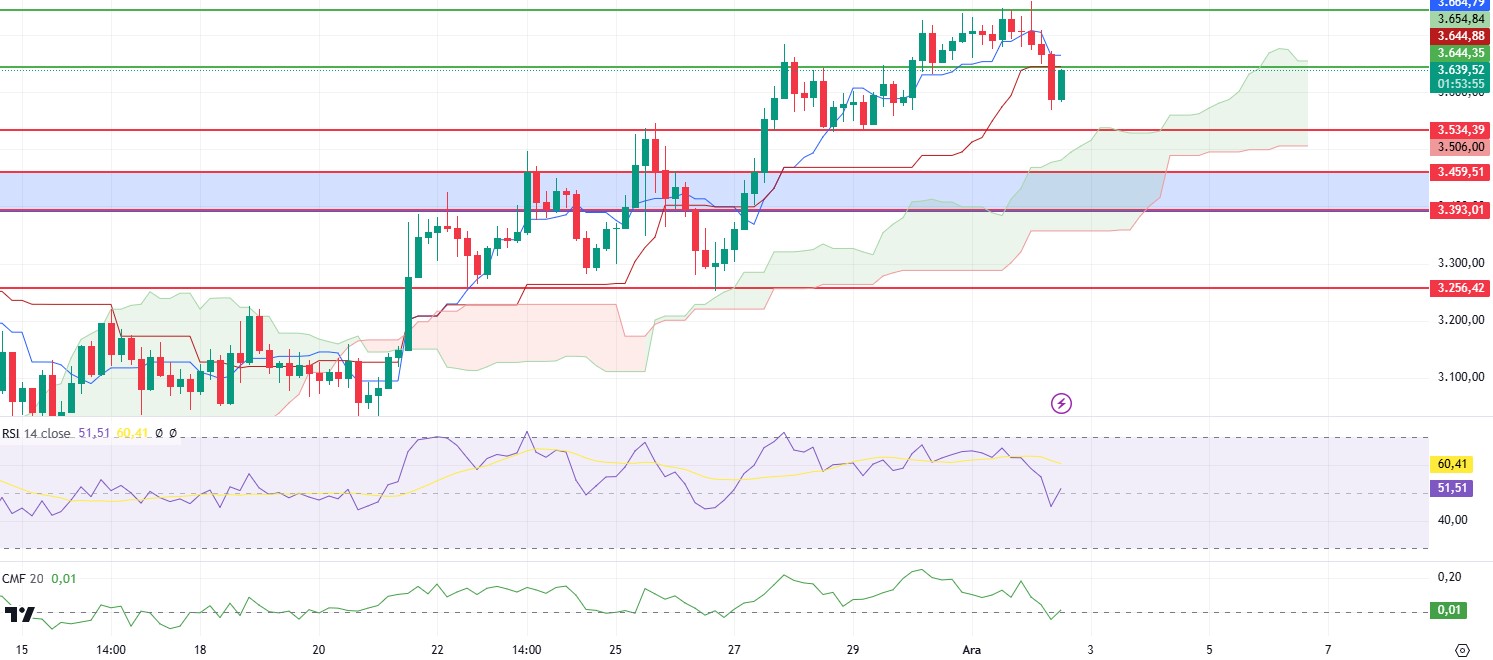
ETH could not hold at the level of 3,644 with the decline in BTC in the morning hours and fell to the intermediate support of 3,570 and managed to rise above the 3,600 level again. With this price action, we see that the Relative Strength Index (RSI), which was in a downward trend with this price action, reacted and regained the 48 level. Chaikin Money Flow (CMF), on the other hand, has recovered after falling below the zero zone and has risen to the positive area. Regaining the kijun level of 3,644 during the day can be seen as a healthy correction. In this scenario, the price may retest the 3,744 level. The 3,534 level, on the other hand, remains the main support, and if the price falls below this level, the decline may deepen and pullbacks to 3,459 levels may occur.
Supports 3,534 – 3,459 – 3,393
Resistances 3,644- 3,744 – 3,839
XRP/USDT
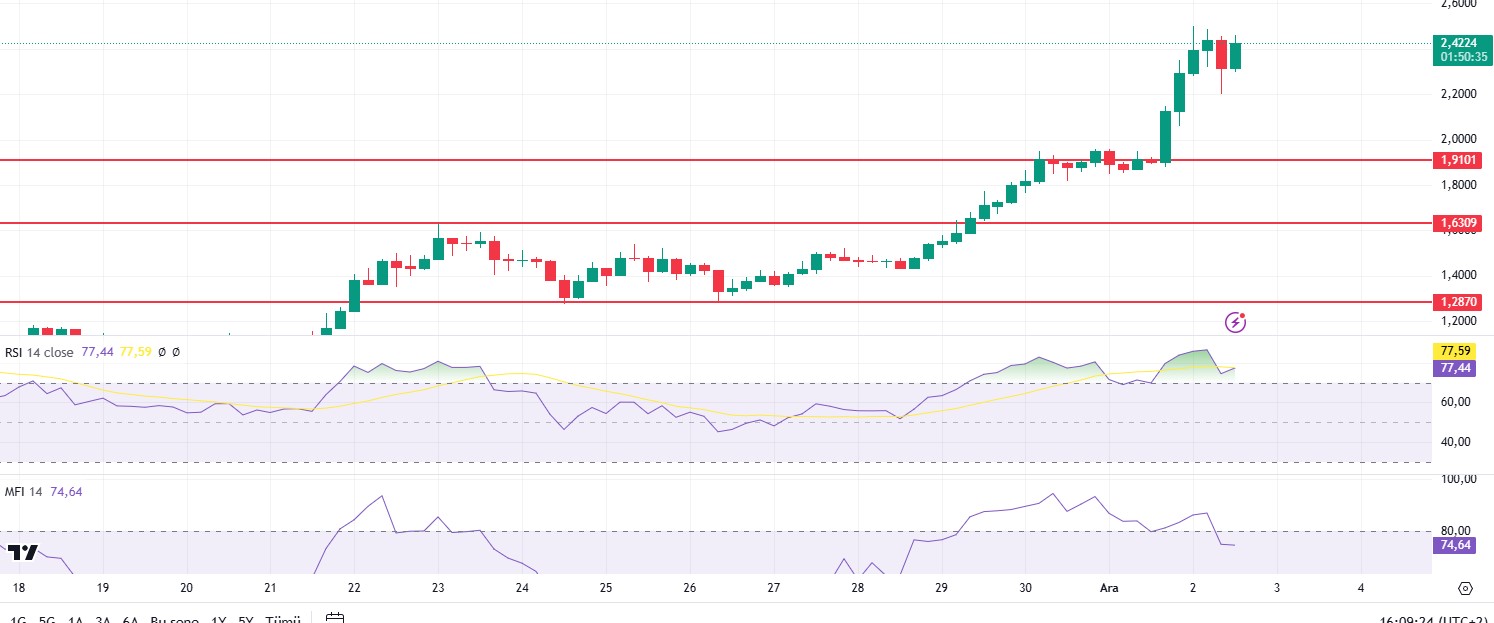
XRP corrected to 2.2 levels in the morning hours after its recent rise, but quickly reacted and rose above the 2.4 region again. With this move, the Commodity Channel Index (CCI) and Money Flow Index (MFI) divergences were eliminated and the areas needed to create higher peaks were opened. Chaikin Money Flow (CMF) has turned upwards again. However, the fact that the Relative Strength Index (RSI) is still in overbought territory and the price is close to the 2.5 psychological resistance may be signals that traders should be careful
Supports 1.9101 – 1.6309 – 1.2870
Resistances 2.500 – 3.105
SOL/USDT
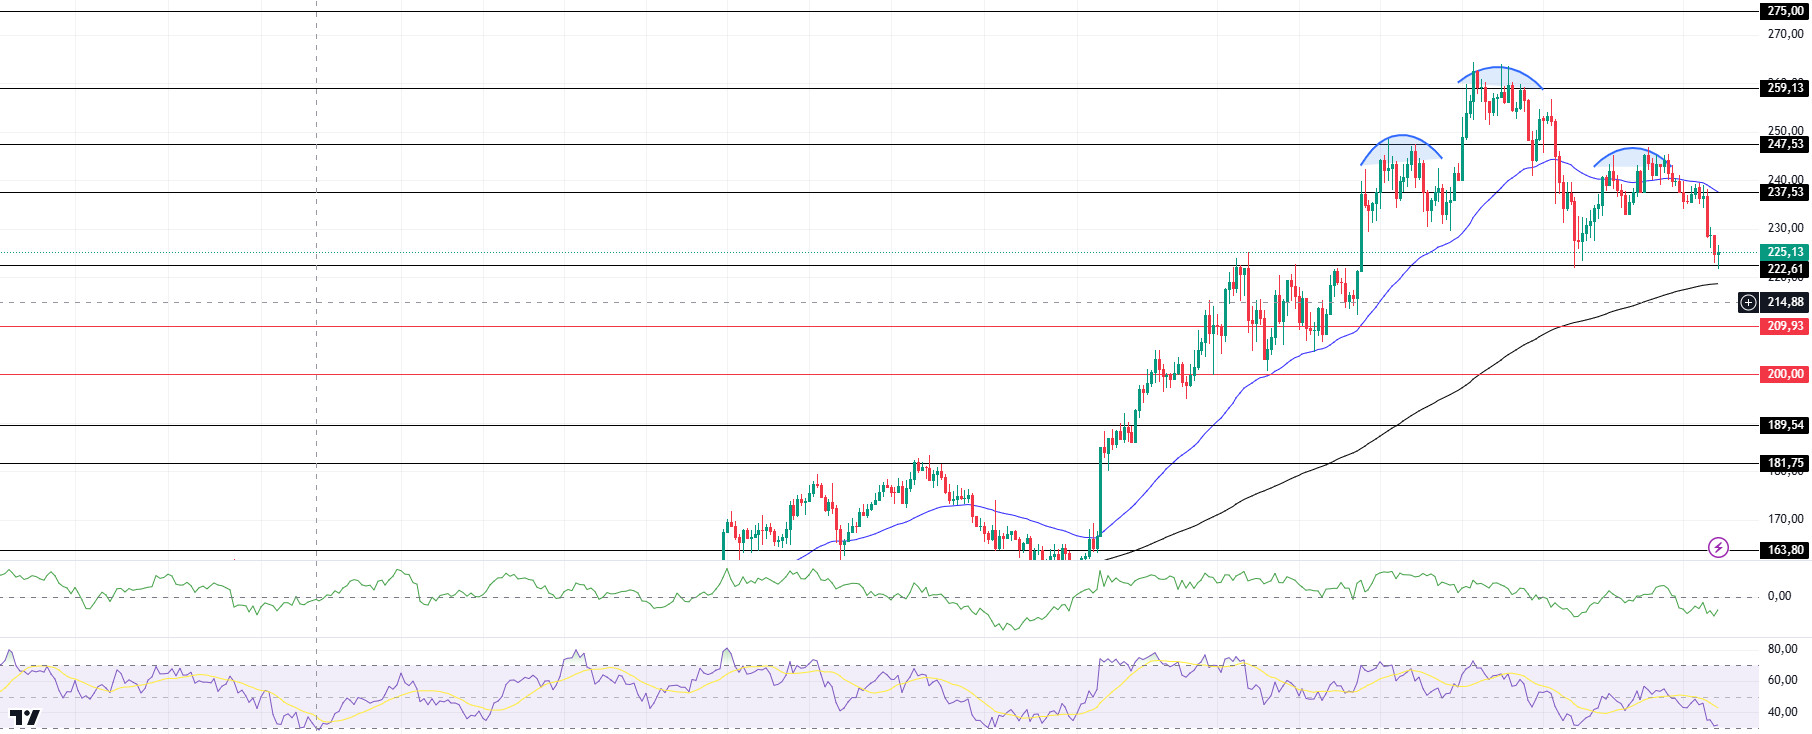
On the 4-hour timeframe, the 50 EMA (Blue Line) is above the 200 EMA (Black Line). Since November 22, SOL, which has been in a downtrend since November 22, broke the downtrend last week and moved upwards. However, this did not last long and it rejoined the downtrend. However, when we examine the Chaikin Money Flow (CMF)20 indicator, we see that there is a great decrease in money inflows. At the same time, Relative Strength Index (RSI)14 is in the oversold zone. This can be shown as a bullish signal. Another potential directional indicator on the chart is the head and shoulders pattern. If this pattern works, a decline to 189.54 may occur. On the other hand, the price tends to get support from the 200 EMA. The 247.53 level is a very strong resistance point in the uptrend driven by both macroeconomic conditions and innovations in the Solana ecosystem. If it breaks here, the rise may continue. In case of retracements due to possible macroeconomic reasons or profit sales, the support levels of 209.93 and 189.54 can be triggered again. If the price reaches these support levels, a potential bullish opportunity may arise if momentum increases.
Supports 222.61 – 209.93 – 200.00
Resistances 237.53 – 247.53 – 259.13
DOGE/USDT
Robinhood transferred 70 million Dogecoins to a centralized exchange, sparking controversy in the market. Bernie Sanders caught the attention of investors by supporting Elon Musk’s D.O.G.E initiative. Dogecoin price fell 3% after Robinhood’s transfer.
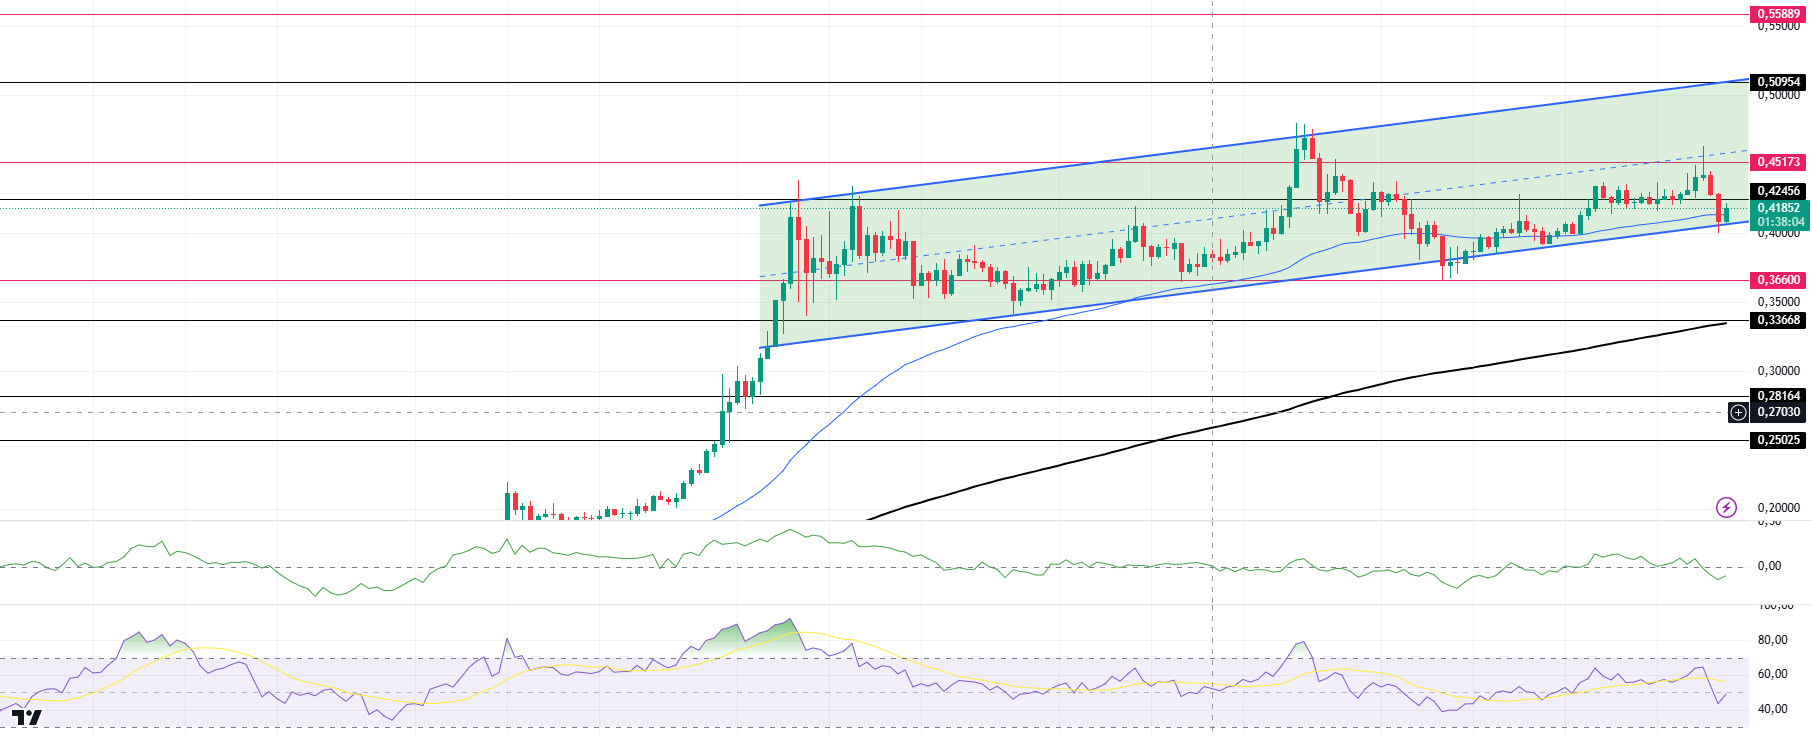
When we look at the chart, the asset, which has been in an uptrend since November 11, has started to rise with support from the base level of the trend. If the upward acceleration is strong, the 0.50954 level may be triggered. On the 4-hour timeframe, the 50 EMA (Blue Line) is above the 200 EMA (Black Line). But the gap between the two averages is still too wide. This may cause pullbacks. On the other hand, when we look at the RSI 14 indicator, it is about to come from the overbought zone to the neutral level. However, when we examine the Chaikin Money Flow (CMF)20 indicator, we see that there are money outflows. The 0.50954 level appears to be a very strong resistance point in the rises driven by both macroeconomic conditions and innovations in Doge coin. If DOGE maintains its momentum and rises above this level, the rise may continue strongly. In case of retracements due to possible macroeconomic reasons or profit sales, the 0.36600 support level can be triggered again. If the price reaches these support levels, a potential bullish opportunity may arise if momentum increases.
Supports 0.36600 – 0.33668 – 0.28164
Resistances 0.42456 – 0.45173 – 0.50954
LEGAL NOTICE
The investment information, comments and recommendations contained herein do not constitute investment advice. Investment advisory services are provided individually by authorized institutions taking into account the risk and return preferences of individuals. The comments and recommendations contained herein are of a general nature. These recommendations may not be suitable for your financial situation and risk and return preferences. Therefore, making an investment decision based solely on the information contained herein may not produce results in line with your expectations.