MARKET SUMMARY
Latest Situation in Crypto Assets
| Assets | Last Price | 24h Change | Dominance | Market Cap. |
|---|---|---|---|---|
| BTC | 95,624.06 | -6.18% | 58.00% | 1,89 T |
| ETH | 3,300.61 | -10.33% | 12.19% | 398,03 B |
| XRP | 2.178 | -8.09% | 3.84% | 125,24 B |
| SOLANA | 187.46 | -9.83% | 2.76% | 90,06 B |
| DOGE | 0.2990 | -17.67% | 1.35% | 44,06 B |
| CARDANO | 0.8601 | -10.58% | 0.92% | 30,13 B |
| TRX | 0.2389 | -9.46% | 0.63% | 20,60 B |
| AVAX | 36.73 | -13.48% | 0.46% | 15,04 B |
| LINK | 21.61 | -12.78% | 0.41% | 13,52 B |
| SHIB | 0.00002030 | -15.44% | 0.36% | 11,94 B |
| DOT | 6.665 | -12.08% | 0.31% | 10,20 B |
*Prepared on 12.20.2024 at 14:00 (UTC)
WHAT’S LEFT BEHIND
Trump’s tariff threat to EU
In a statement on social media, Trump used harsh words against the European Union, stating that it must buy oil and gas from the US to offset its “enormous trade deficit” with the US, otherwise tariffs will be imposed. US stock markets, on the other hand, were unchanged and flat after a big sell-off the previous day. Investors continue to assess the impact of the Fed’s hawkish comments and economic data.
SEC Approves First US Crypto Index ETF
The US Securities and Exchange Commission (SEC) has approved applications from Nasdaq and Cboe BZX exchanges. Crypto index ETFs offered by Hashdex and Franklin Templeton will begin listing and trading. This is considered an important milestone for the crypto market.
Bitcoin Buying Continues Despite IMF Deal
The government of El Salvador bought $1 million worth of Bitcoin following a $3.5 billion financing deal with the IMF, bringing its total Bitcoin reserve to 5,980.77 BTC. The total value of the reserve was calculated at approximately $586.5 million. This strategic move once again emphasized the country’s commitment to Bitcoin.
The Transformation of Crypto Stablecoins in Europe
To comply with the EU’s Crypto Asset Market Regulation (MiCA), many crypto exchanges have removed USDT from their lists. The use of the euro is becoming more common in crypto trading as new issuers aim to fill the stablecoin gap. This could affect Europe’s competitiveness in the crypto market.
Deutsche Bank Joins Ethereum Layer-2
Deutsche Bank has started supporting the Ethereum Layer-2 network. The move is linked to Singapore’s “Project Guardian” initiative, increasing the potential for corporate finance giants to adopt blockchain technologies.
HIGHLIGHTS OF THE DAY
Important Economic Calender Data
| Time | News | Expectation | Previous |
|---|---|---|---|
| 15:00 | US Michigan Consumer Sentiment (Dec) | 74.1 | 74 |
INFORMATION
*The calendar is based on UTC (Coordinated Universal Time) time zone.
The economic calendar content on the relevant page is obtained from reliable news and data providers. The news in the economic calendar content, the date and time of the announcement of the news, possible changes in the previous, expectations and announced figures are made by the data provider institutions. Darkex cannot be held responsible for possible changes that may arise from similar situations
MARKET COMPASS
While European stock markets and US index futures were on the negative side, the PCE Price Index, which is used by the US Federal Reserve (FED) to monitor inflation, recorded a lower-than-expected increase in November. After this macro indicator, the easing seen in the dollar index during Asian trading expanded a little more and digital assets had the opportunity to recover some of their recent losses. On the other hand, the fact that the US government may experience a partial shutdown after midnight tonight after the spending package supported by Trump failed to gain approval remains an obstacle to the increase in risk appetite.
We expect the recovery efforts in digital assets to continue, albeit in a weaker tone, later in the day and throughout the weekend, but short-term declines may continue. In the big picture, as we mentioned below, we maintain our expectation that the gains will continue.
From the short term to the big picture.
The victory of former President Trump on November 5, which was one of the main pillars of our bullish expectation for the long-term outlook in digital assets, produced a result in line with our predictions. Afterwards, the appointments made by the president-elect and the expectations of increased regulation of the crypto ecosystem in the US continued to be a positive variable in our equation. Although expected to continue at a slower pace, the continuation of the FED’s interest rate cut cycle and the volume in BTC ETFs indicating an increase in institutional investor interest (in addition to MicroStrategy’s BTC purchases, BlackRock’s BTC ETF options trading…) support our upward forecast for the big picture for now.
In the short term, given the nature of the market and pricing behavior, we think it would not be surprising to see occasional pauses or pullbacks in digital assets. However, at this point, it is worth emphasizing again that the fundamental dynamics continue to be bullish. We think that the declines that took place after the FED’s recent statements are in line with the market fabric and are necessary for healthier rises for the long term
TECHNICAL ANALYSIS
BTC/USDT
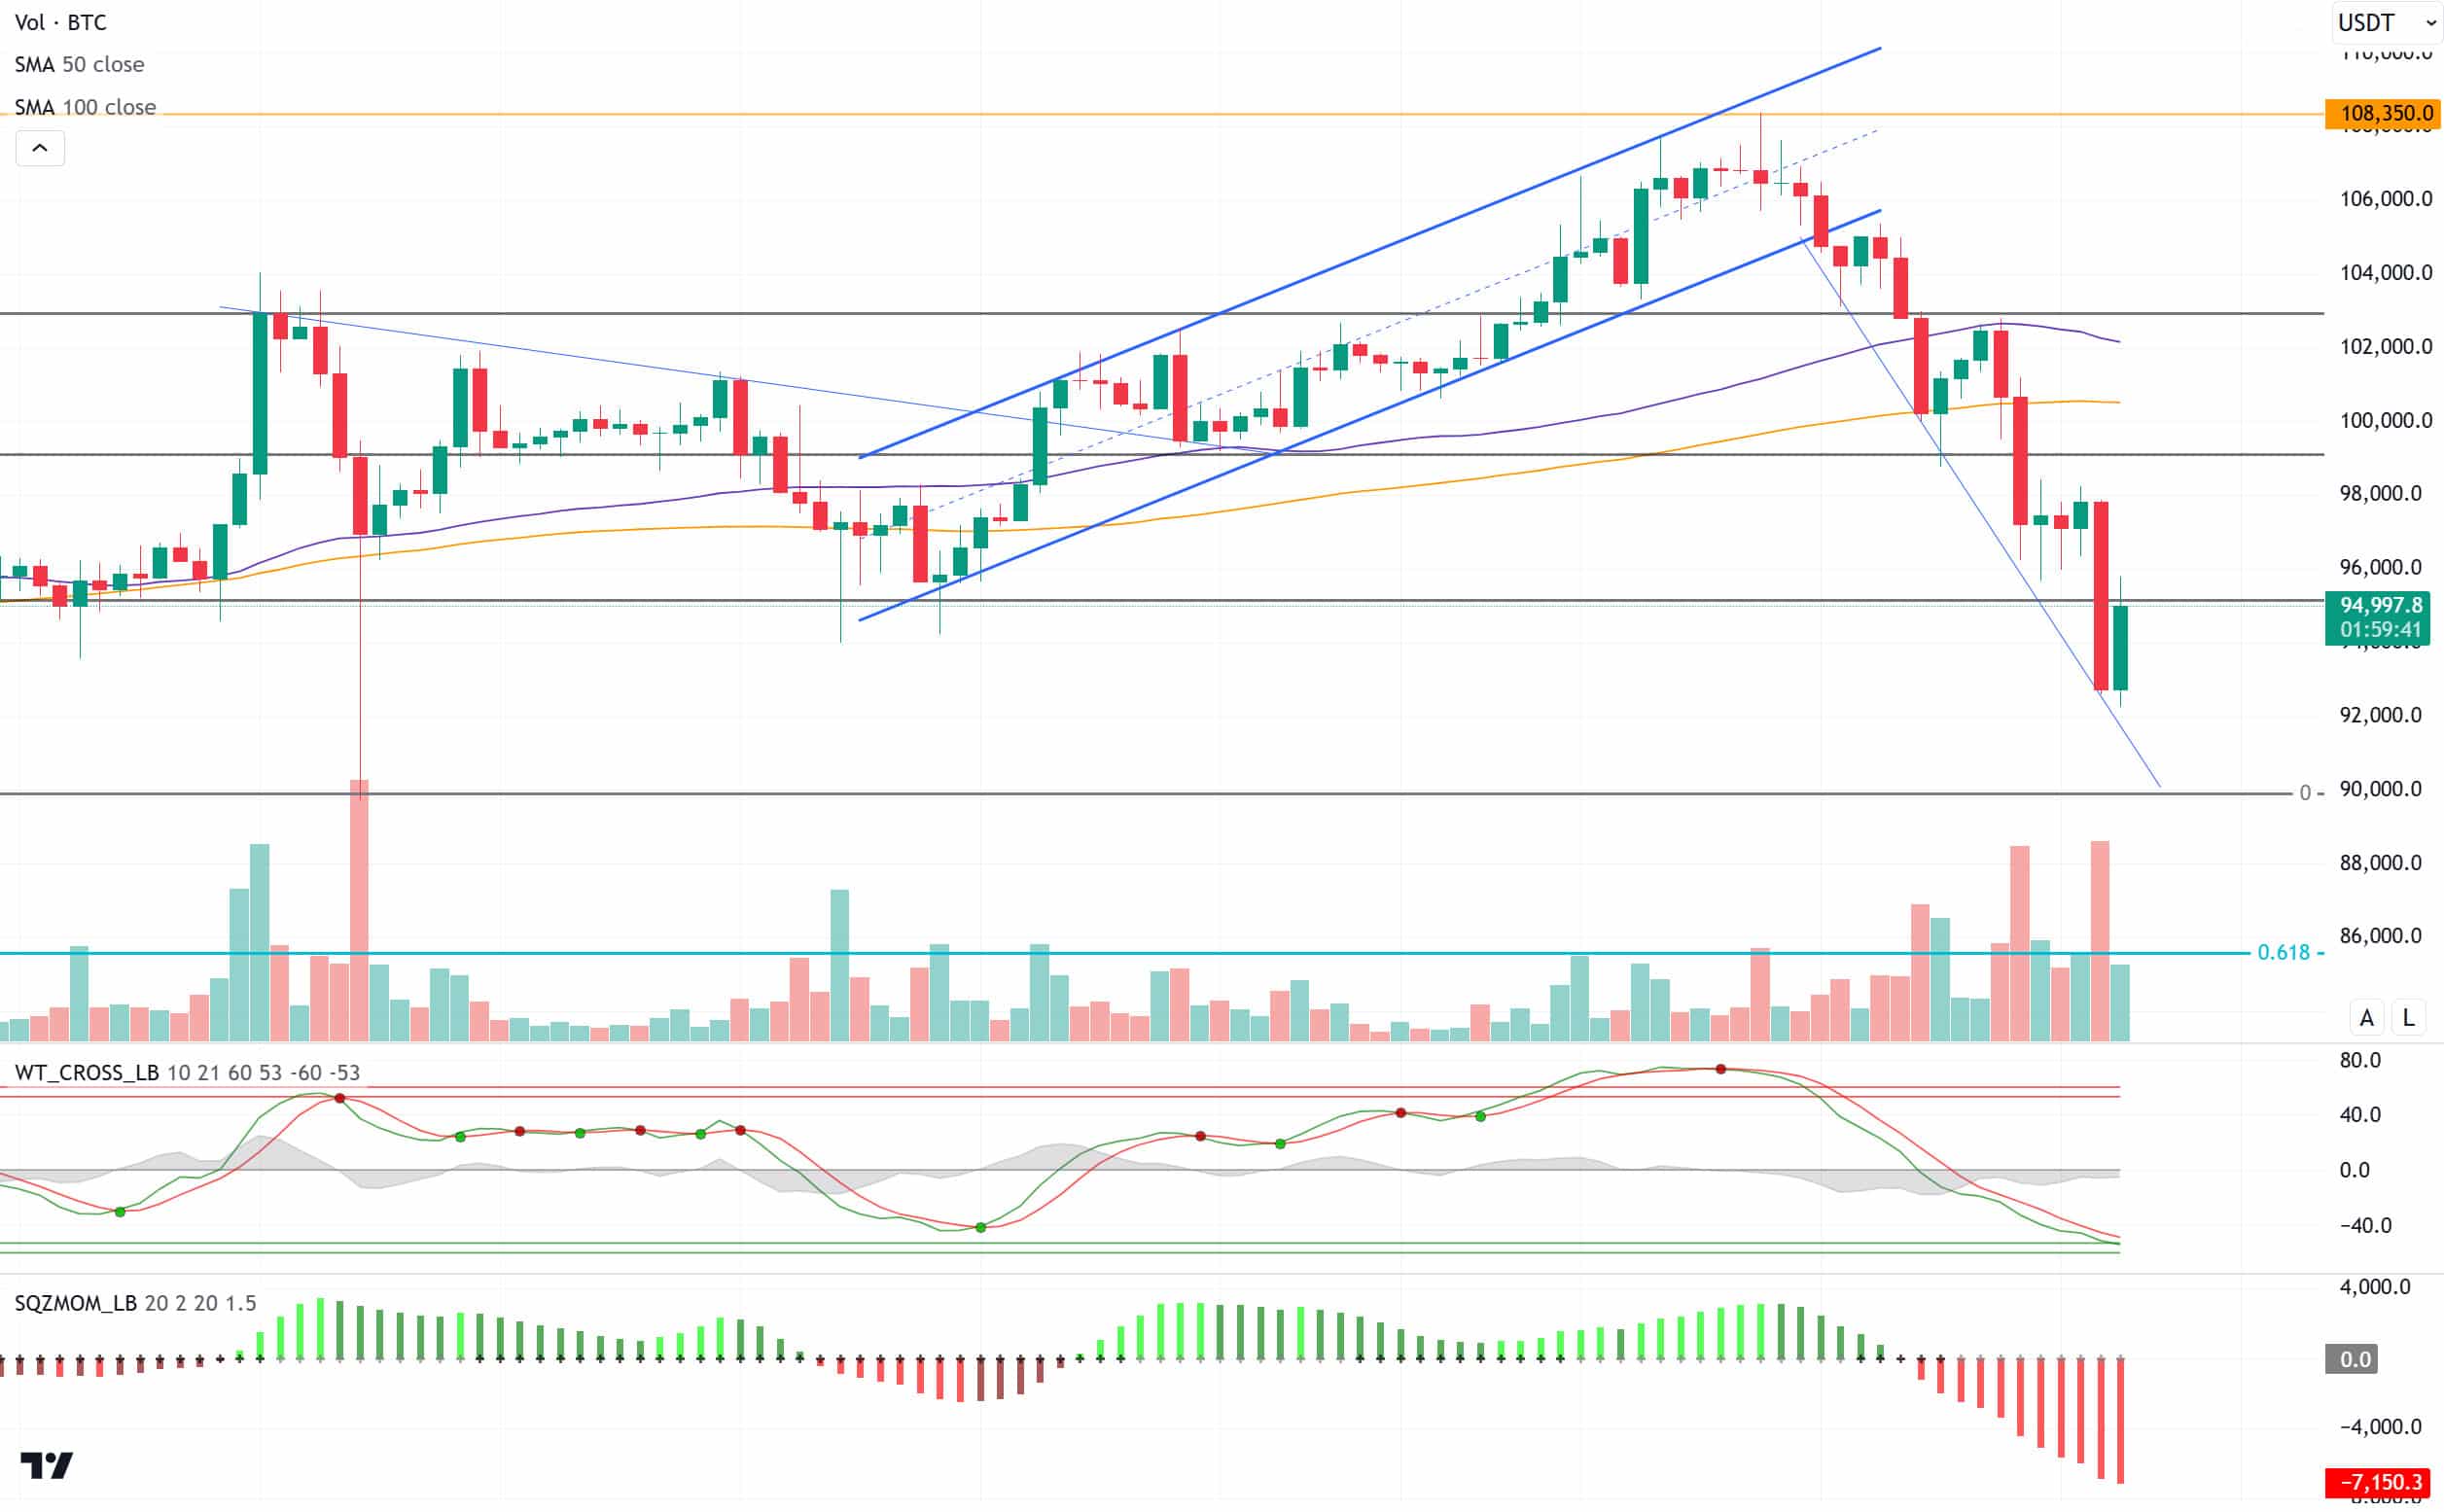
Bitcoin, which reached an all-time high of 108 thousand dollars in the past days, entered a downward trend after the FED meeting. While the decline of Bitcoin, which fell as low as $ 92,000 today, continued, the total value of positions liquidated in futures transactions exceeded $ 1.3 billion. This decline is thought to be due to the uncertainty created by FED Chairman Powell’s statements on Bitcoin reserve expectations.
When we look at the technical outlook, we stated in the previous analysis that the 95,000 point, which is the support level, is critical. As a matter of fact, BTC, which reached 98,000 levels during the day, turned its direction down once again with the increase in selling pressure and fell as low as 92,300. BTC, which is currently correcting the decline and trading at 95,000, may be likely to generate a buy signal in the coming hours while technical oscillators are in the oversold zone. When we look at the momentum indicator, it continues to gain strength in the negative zone. If the price recovers, closures above the 95,000 level are seen as a demand collection zone for the resumption of the upward trend, while closures below this level may indicate continued selling pressure.
Supports 92,550 – 91,450 – 90,000
Resistances 95,150 -98,000 – 99,100
ETH/USDT
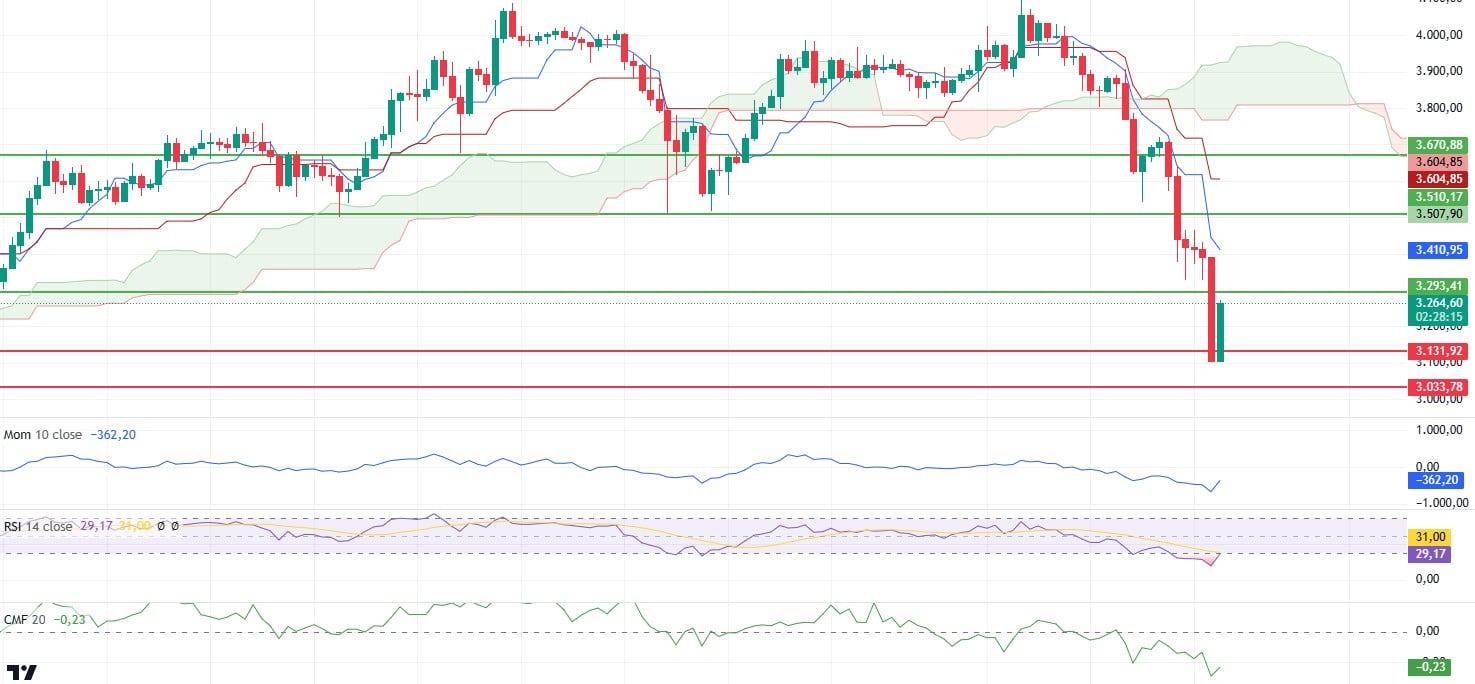
Ethereum price continues to remain under pressure with the general decline in the market after Fed Chairman Powell’s statements. In this process, it was observed that the price fell to USD 3,131 after closing below the USD 3,293 support.
According to the Ichimoku analysis, the sell signal formed by the intersection of Tenkan-sen and Kijun-sen levels persists and the Kumo cloud indicates that prices may fall as low as USD 3,500. Cumulative Volume Delta (CVD) data, on the other hand, suggest that selling pressure is gradually easing in spot and futures markets. While momentum indicators are weakening, the price’s effort to move up by reacting from the support of 3,131 USD is considered as a positive signal. Relative Strength Index (RSI) signals a recovery by turning up after entering oversold territory, while Chaikin Money Flow (CMF) indicator shows positive mismatches despite remaining in negative territory. However, this does not mean that the downtrend is completely over. Maintaining the USD 3.131 support may increase the probability of the price breaking the USD 3.293 level on the upside again in the evening hours. On the other hand, a break of the USD 3,131 – USD 3,033 support band could lead to deeper corrections and the price is likely to retreat to lower levels. Overall, Ethereum’s short-term outlook may offer opportunities for a rebound, subject to the maintenance of critical support levels.
Supports 3,293 – 3,131- 3,033
Resistances 3,510 – 3,670 – 3,798
XRP/USDT
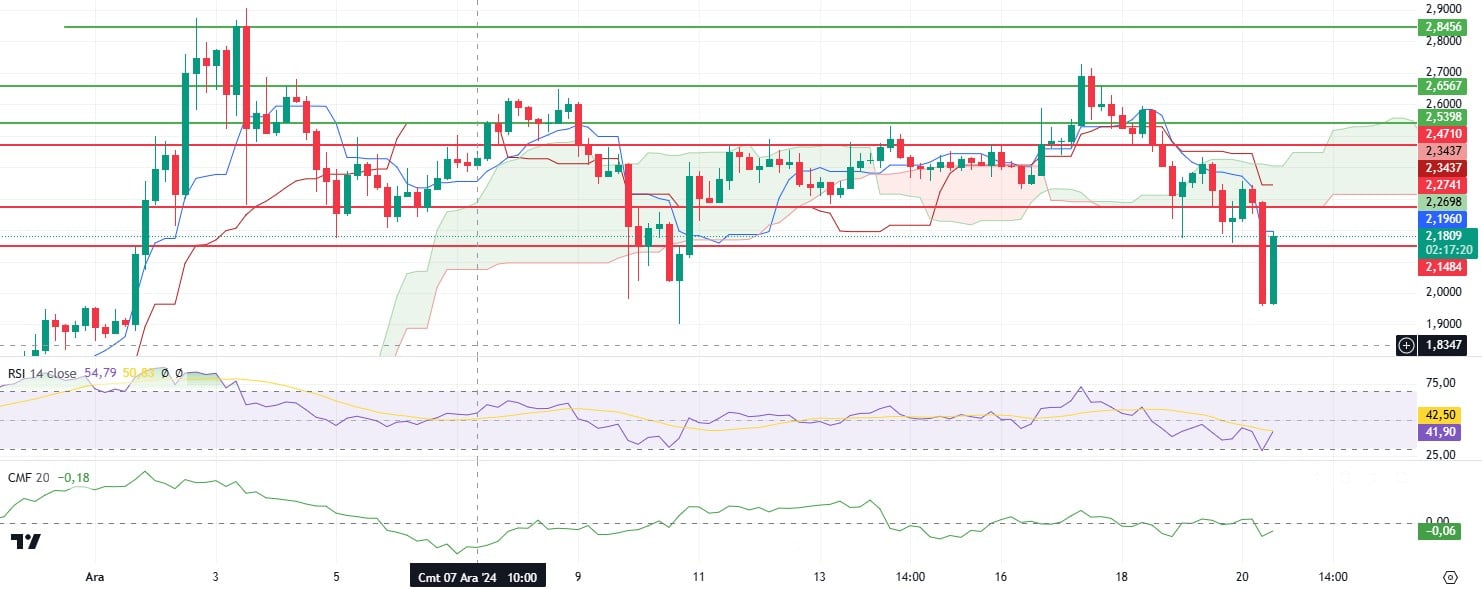
XRP retreated to the 1.96 support level in parallel with Bitcoin’s decline during the day, but regained the 2.18 level with the reaction it received from this level.
When technical indicators are analyzed, the Chaikin Money Flow (CMF) indicator rose to -0.08, indicating that buyers are active in the market again. Relative Strength Index (RSI), on the other hand, displays a positive outlook by turning from the oversold zone.
If the price stays above the 2.18 level, it is likely to rise to 2.27, which is the kumo resistance level according to the Ichimoku indicator. The increase in momentum also stands out as one of the important factors supporting this bullish possibility. However, if the price fails to persist above the 2.18 level, there may be a retracement back towards the 1.96 support level.
Supports 2.2749 – 1.9638- 1.6309
Resistances 2.4230 – 2.6173 – 2.8528
SOL/USDT
This latest decline led to a total liquidation of $38 million, more than $33 million of which came from long positions. Such liquidations may create fear, uncertainty and doubt among SOL investors, increasing selling pressure and leading to a further decline in its price. On the other hand, according to defiLing data, SOL TVL fell by more than 7% in one day, from $11.22 billion to $10.35 billion.
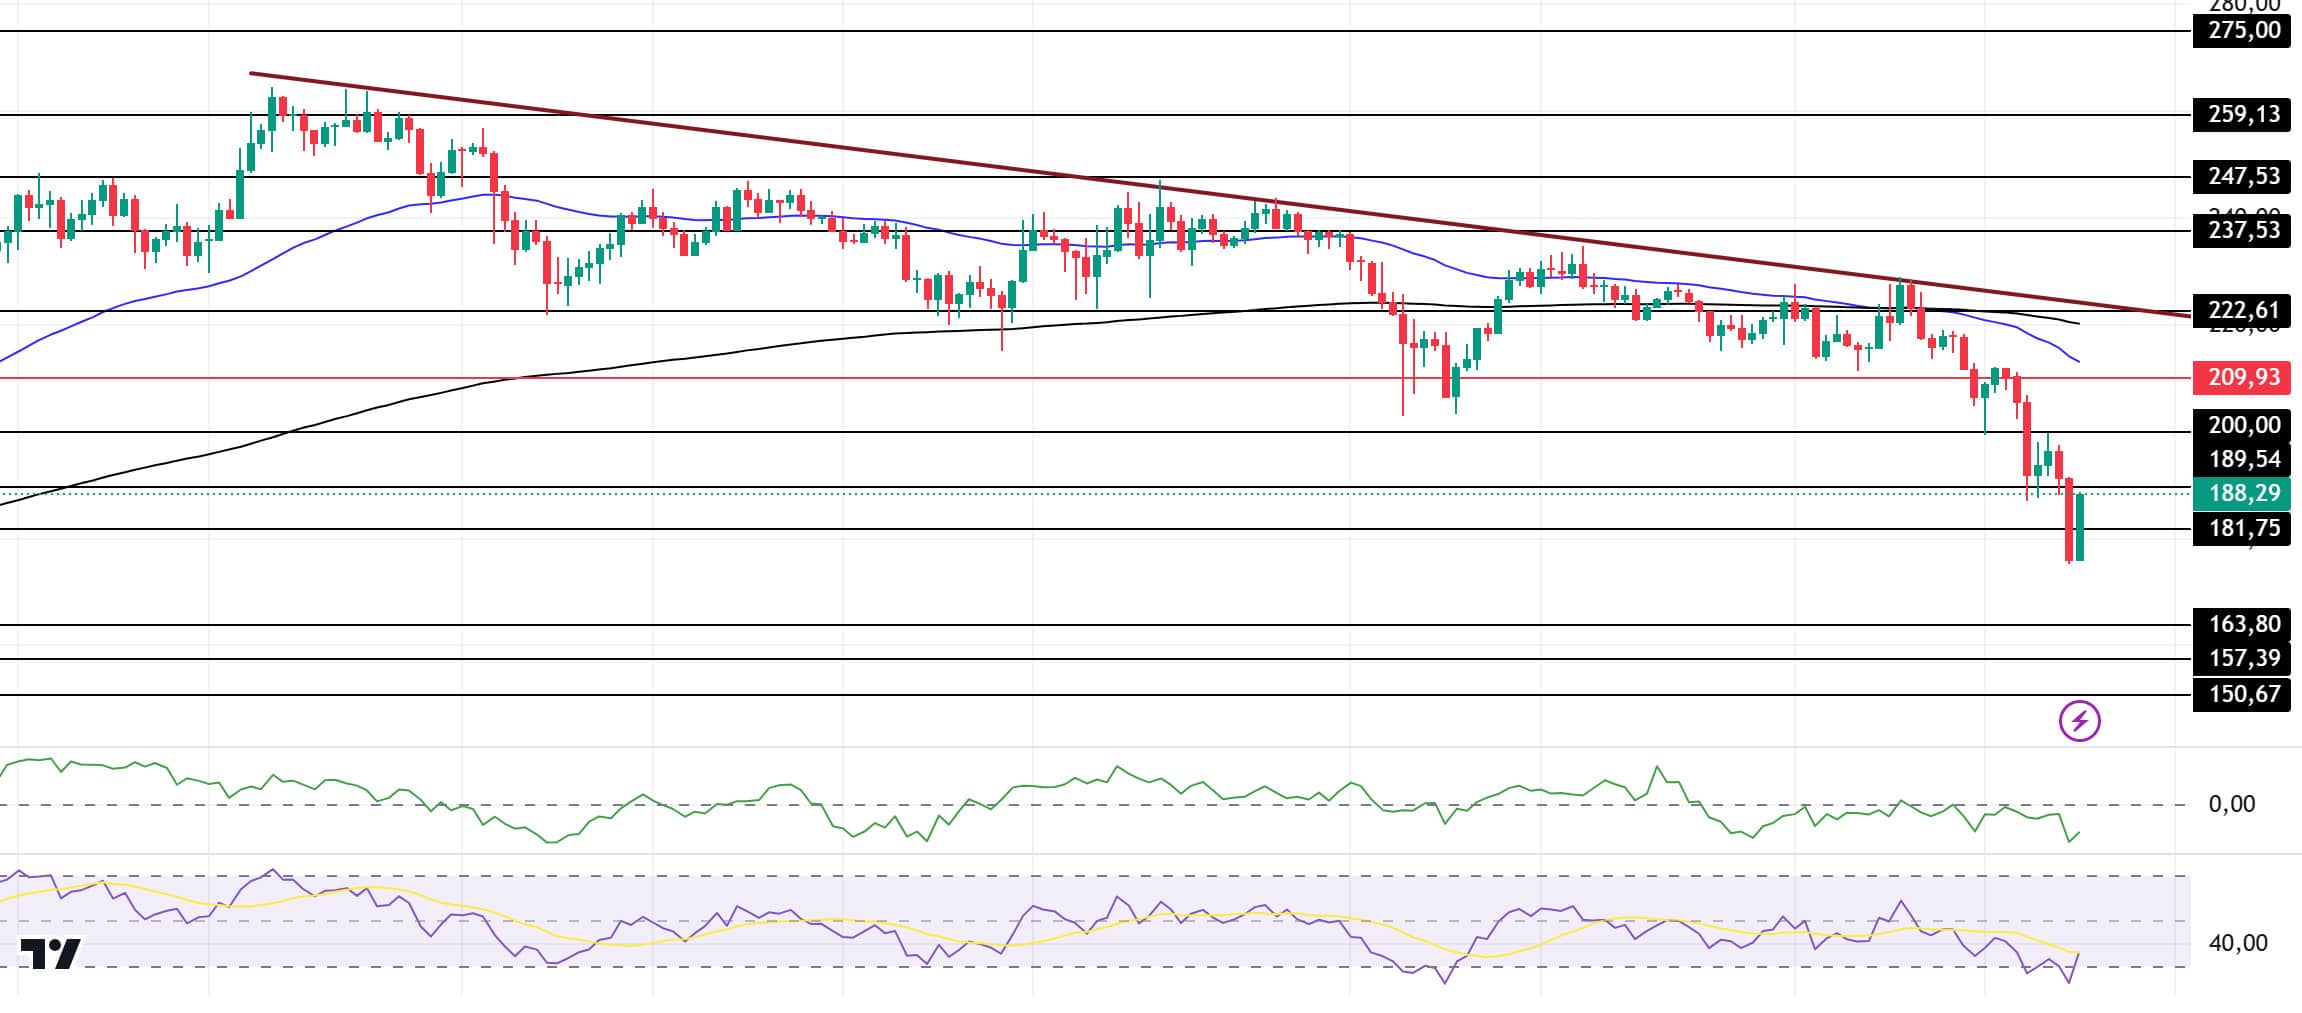
SOL has continued its decline since our morning analysis. The asset, which moved with slight pullbacks for a long time, could not withstand the selling pressure. The downward movement of cryptocurrency leader BTC further shook the asset. The price of the asset, which is in a wide downtrend, also broke the support point of the trend. In the 4-hour timeframe, the 50 EMA (Blue Line) started to hover below the 200 EMA (Black Line). When we examine the Chaikin Money Flow (CMF)20 indicator, the increase in money outflows increases selling pressure. However, Relative Strength Index (RSI)14 has moved from the neutral zone to the oversold zone. The 200.00 level appears to be a very strong resistance point in the rises driven by both the upcoming macroeconomic data and the news in the Solana ecosystem. If it breaks here, the rise may continue. In case of retracements for the opposite reasons or due to profit sales, the 163.80 support level can be triggered. If the price comes to these support levels, a potential bullish opportunity may arise if momentum increases.
Supports 163.80 – 157.39 – 150.67
Resistances 181.75 – 189.54 – 200.00
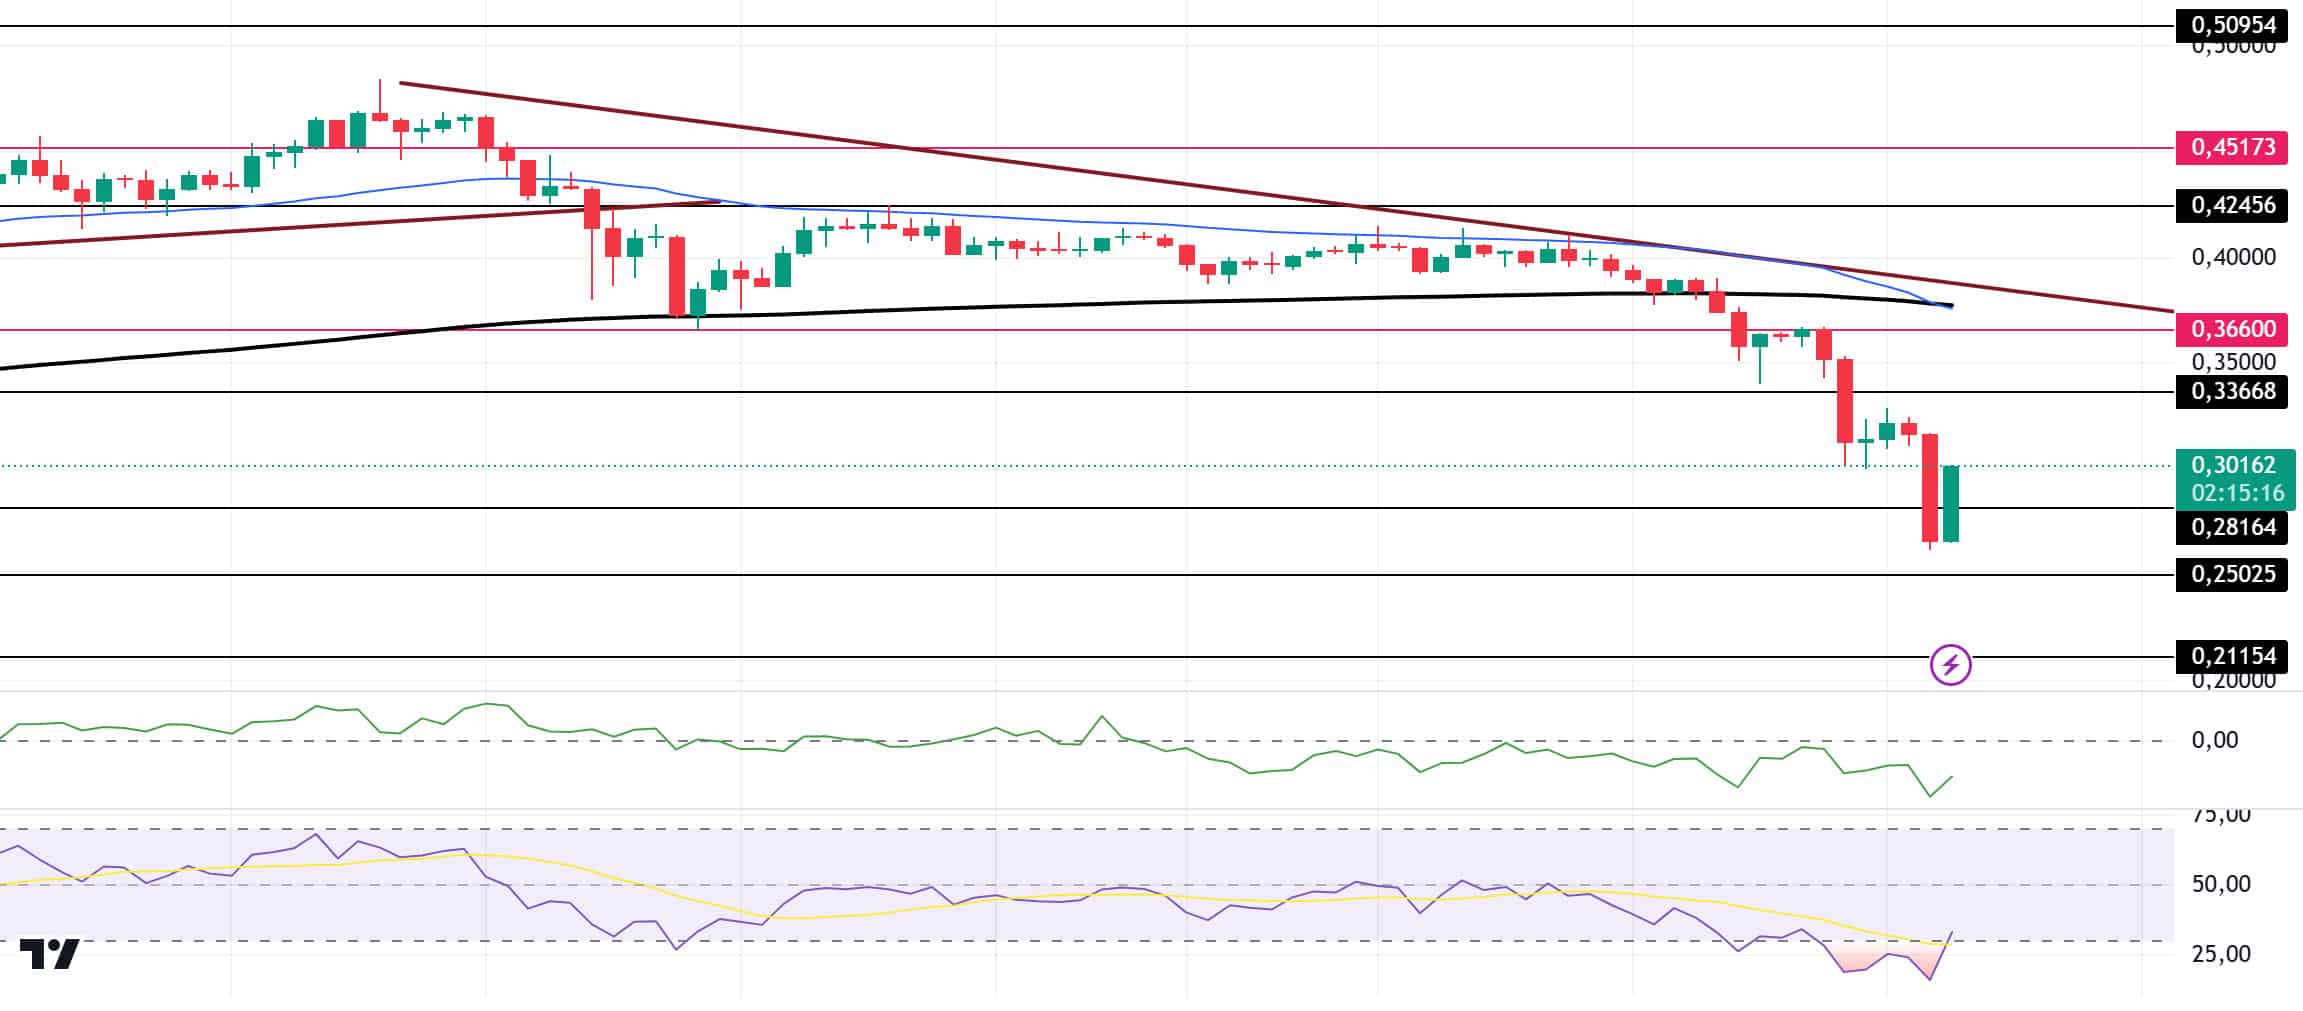
DOGE/USDT
DOGE traders are waiting for potential reversal signals, focusing on key levels amid a bearish trend. Dogecoin price has fallen sharply, declining by over 28.90% in the last two days amid ongoing crypto market corrections.
When we look at the chart, DOGE, which has been in a downtrend since December 8, broke the support of this trend and deepened the decline and started to recover by finding support from the 0.2800 and 0.2600 band. In the 4-hour timeframe, the 50 EMA (Blue Line) started to hover below the 200 EMA (Black Line). When we examine the Chaikin Money Flow (CMF)20 indicator, although it is negative, money inflows have started. However, Relative Strength Index (RSI)14 is in oversold territory from the neutral zone level. The 0.36600 level stands out as a very strong resistance point in the rises driven by both the upcoming macroeconomic data and the innovations in the Doge coin. If DOGE catches a new momentum and rises above this level, the rise may continue strongly. In case of possible pullbacks due to macroeconomic reasons or negativity in the ecosystem, the 0.25025 level is an important support. If the price reaches these support levels, a potential bullish opportunity may arise if momentum increases.
Supports 0.28164 – 0.25025 – 0.21154
Resistances 0.33668 – 0.36600 – 0.42456
LEGAL NOTICE
The investment information, comments and recommendations contained herein do not constitute investment advice. Investment advisory services are provided individually by authorized institutions taking into account the risk and return preferences of individuals. The comments and recommendations contained herein are of a general nature. These recommendations may not be suitable for your financial situation and risk and return preferences. Therefore, making an investment decision based solely on the information contained herein may not produce results in line with your expectations.


