MARKET SUMMARY
Latest Situation in Crypto Assets
| Assets | Last Price | 24h Change | Dominance | Market Cap |
|---|---|---|---|---|
| BTC | 98,453.39 | 3.22% | 56.85% | 1,95 T |
| ETH | 3,481.67 | 1.27% | 12.24% | 419,40 B |
| XRP | 2.282 | -0.46% | 3.81% | 130,57 B |
| SOLANA | 196.69 | 1.13% | 2.75% | 94,26 B |
| DOGE | 0.3312 | 1.14% | 1.42% | 48,80 B |
| CARDANO | 0.9145 | -0.70% | 0.94% | 32,11 B |
| TRX | 0.2567 | 0.70% | 0.65% | 22,13 B |
| AVAX | 40.69 | 1.98% | 0.49% | 16,68 B |
| LINK | 24.63 | 0.38% | 0.46% | 15,70 B |
| SHIB | 0.00002299 | 0.42% | 0.39% | 13,54 B |
| DOT | 7.457 | -0.05% | 0.33% | 11,42 B |
*Prepared on 12.25.2024 at 14:00 (UTC)
WHAT’S LEFT BEHIND
Israel Launches a New Era with Bitcoin Investment Funds
The Israel Securities Authority (ISA) has approved the simultaneous launch of six different Bitcoin mutual funds as of December 31, 2024. These funds, which will be managed by Migdal Capital Markets, More, Ayalon, Phoenix Investment, Meitav and IBI, are designed to track the Bitcoin price. Fund management fees will range from 0.25% to 1.5%, with a fund actively seeking to outperform Bitcoin. These funds, which will initially be available for daily trading, are planned to be made available for continuous trading in the future.
Turkey Tightens Measures Against Money Laundering
Turkey is making identity verification mandatory for crypto transactions over $425, with new anti-money laundering (AML) regulations set to take effect on February 25, 2025. This step aims to prevent illegal money laundering and terrorist financing. Users will be required to declare their identity to crypto service providers.
The Trump Family and the Wind Rose in the Crypto World
With Donald Trump’s presidential victory, Bitcoin surpassed the $100,000 mark, leading a new bull market. World Liberty Financial (WLFI), known to be close to the Trump family, attracted attention with its investments in crypto assets such as Ethereum (ETH), Chainlink (LINK), Aave (AAVE) and Enjin (ENA). This trend has created significant movement in the crypto investment market, opening the door to new opportunities.
HIGHLIGHTS OF THE DAY
Important Economic Calender Data
All Day Holiday United States – Christmas
INFORMATION
*The calendar is based on UTC (Coordinated Universal Time) time zone.
The economic calendar content on the relevant page is obtained from reliable news and data providers. The news in the economic calendar content, the date and time of the announcement of the news, possible changes in the previous, expectations and announced figures are made by the data provider institutions. Darkex cannot be held responsible for possible changes that may arise from similar situations
MARKET COMPASS
Today, many of the world’s major stock markets are closed for the Christmas holiday. Before that, we saw that the rise in Wall Street continued with technology companies. While major digital assets held on to yesterday’s gains, we see that volumes remain low today. We expect the pressure following the US Federal Reserve’s (FED) hawkish statement last week to give way to a more horizontal course and price transitions to soften.
From the short term to the big picture.
The victory of former President Trump on November 5, which was one of the main pillars of our bullish expectation for the long-term outlook in digital assets, produced a result in line with our predictions. Afterwards, the appointments made by the president-elect and the expectations of increased regulation of the crypto ecosystem in the US continued to be a positive variable in our equation. Although it is expected to continue at a slower pace, the FED’s signal that it will continue its interest rate cut cycle and the volume in crypto asset ETFs indicating an increase in institutional investor interest (in addition to MicroStrategy’s BTC purchases, BlackRock’s BTC ETF options start trading…) support our upward forecast for the big picture for now.
In the short term, given the nature of the market and pricing behavior, we think it would not be surprising to see occasional pauses or pullbacks in digital assets. However, at this point, it is worth emphasizing again that the fundamental dynamics continue to be bullish.
TECHNICAL ANALYSIS
BTC/USDT
Global preparations for the Bitcoin and cryptocurrency ecosystem continue apace. Turkey, where cryptocurrency use is widespread, announced changes in crypto regulations by strengthening AML regulations. Israel approved the launch of six different Bitcoin mutual funds at the same time, while the Russian Finance Minister announced the use of Bitcoin and cryptocurrencies in foreign trade.
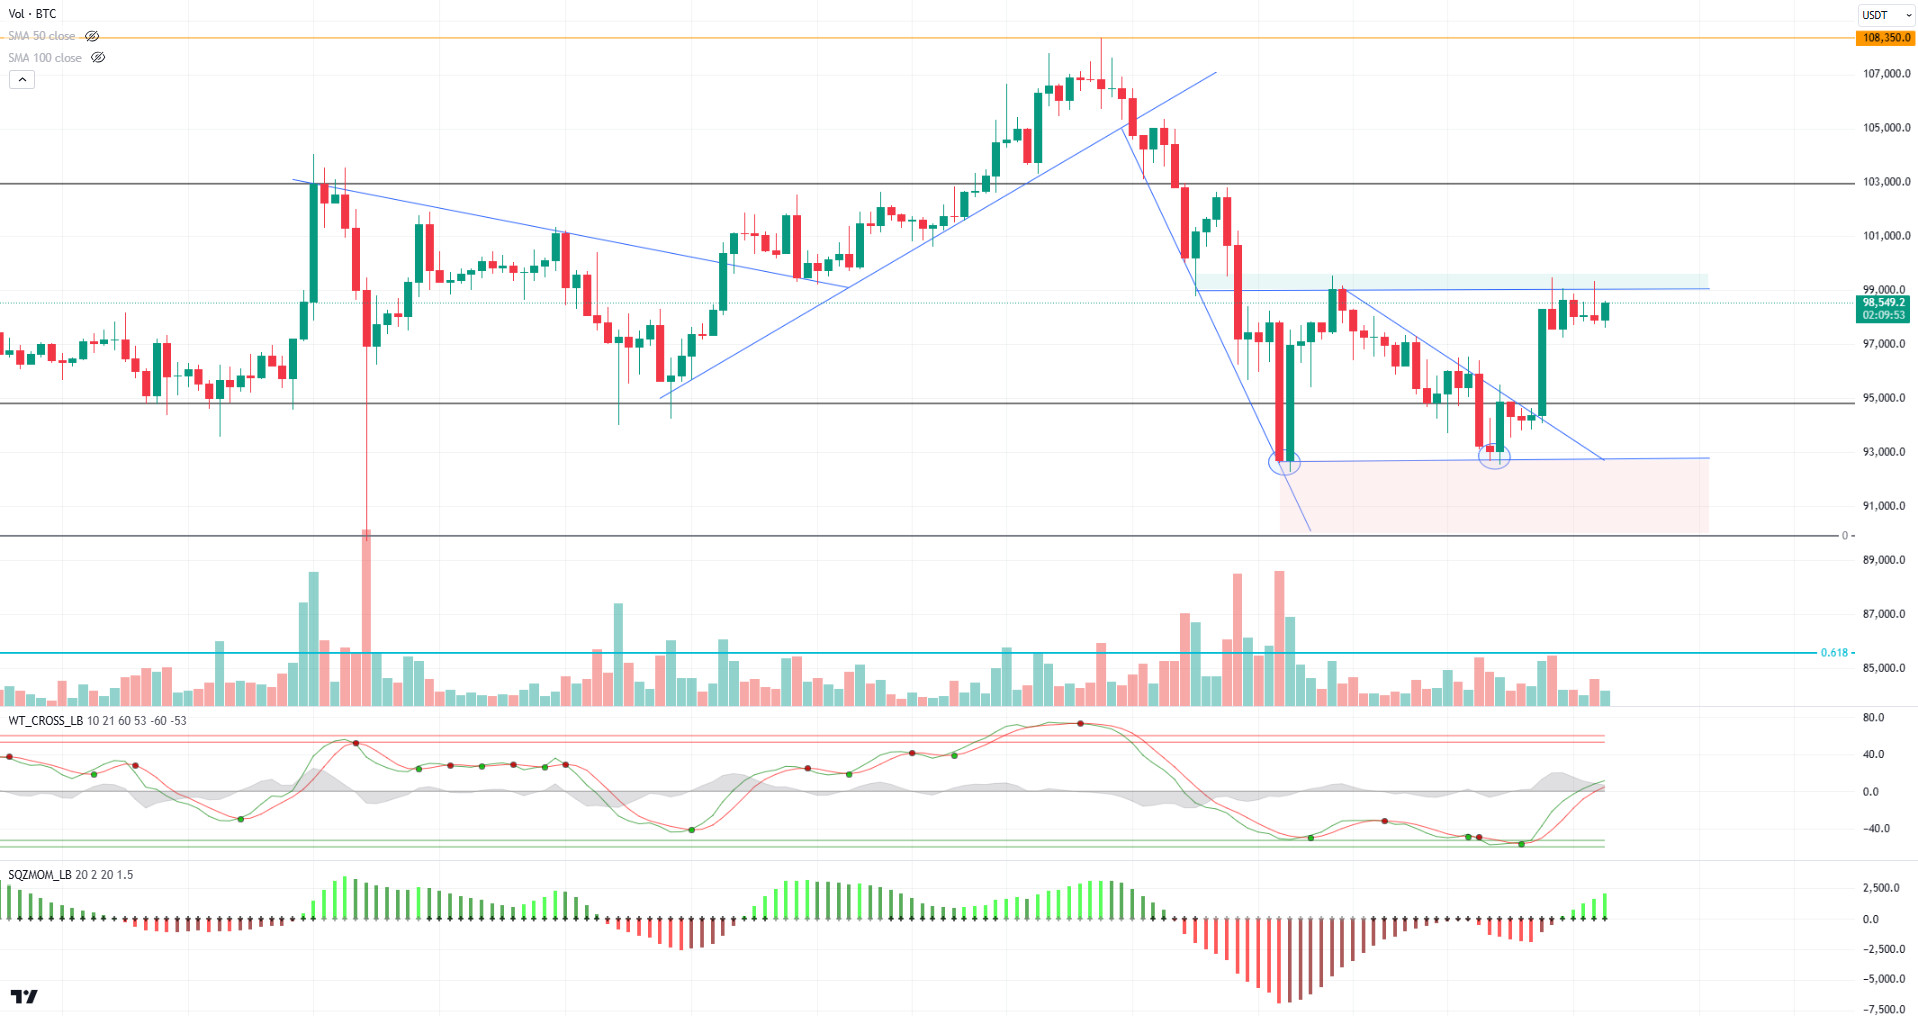
When we look at the technical outlook with the latest developments, we see that after the double bottom formation was seen in the price, there was no upward movement confirming the pattern. The price, which tested above the 99,000 level during the day, failed to break here. BTC, which was trading at 98,450 at the time of writing the technical analysis, continues to search for direction, while technical oscillators continue to maintain the buy signal. Our momentum indicator is gaining strength with the transition to positive territory. In the upward movement of the price, crossing the 99,100 level will carry the upward movement to the next resistance point at 102,500, while we will follow the support level of 97,200 in the retracement.
Supports 97,200 – 95,000 – 92,550
Resistances 99,100 – 102,500- 104,450
ETH/USDT
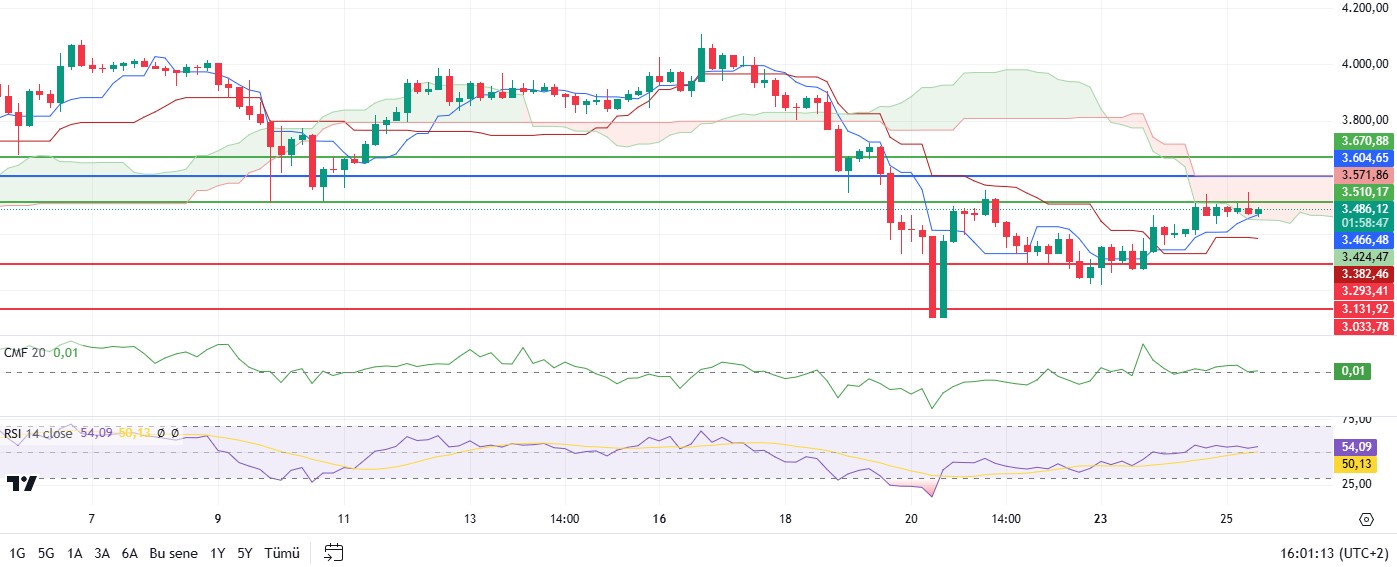
Ethereum, which moved horizontally in a narrow price range after yesterday’s rise, tested the 3,510 level again during the day, but retreated with intensified selling pressure in this region. Momentarily, the price is observed to move in the kumo cloud, indicating that Ethereum is in an important decision zone and needs volume transactions from market participants to determine its direction.
The Relative Strength Index (RSI) indicator is trending sideways in line with the price action. However, the negative divergence on RSI indicates that the upside in the price action is limited and selling pressure continues. Chaikin Money Flow (CMF), on the other hand, is flat near zero, indicating that capital inflows and outflows are in balance and investors have not yet made a clear directional decision. This suggests that Ethereum needs an increase in volume to determine its short-term direction. Looking at the Ichimoku indicator, the price is still moving healthily within the kumo cloud and the current “buy” signal remains valid. However, as the price approaches the cloud boundaries, the possibility of a breakout to the upside or downside in the short term increases. A strong selling pressure is likely to be triggered if the lower boundary of the Kumo cloud is broken, while a voluminous break of the upper boundary may support the uptrend.
It is critical for Ethereum to break the 3,510 level with a strong volume in order for Ethereum to gain upward momentum. Persistence above this level may make it possible for the price to leave the negative divergence behind and start a new bullish wave. Otherwise, if the lower boundary of the kumo cloud breaks, the selling pressure is likely to deepen and the price is likely to test lower support levels.
Supports 3,293 – 3,131- 3,033
Resistances 3,510 – 3,670 – 3,798
XRP/USDT
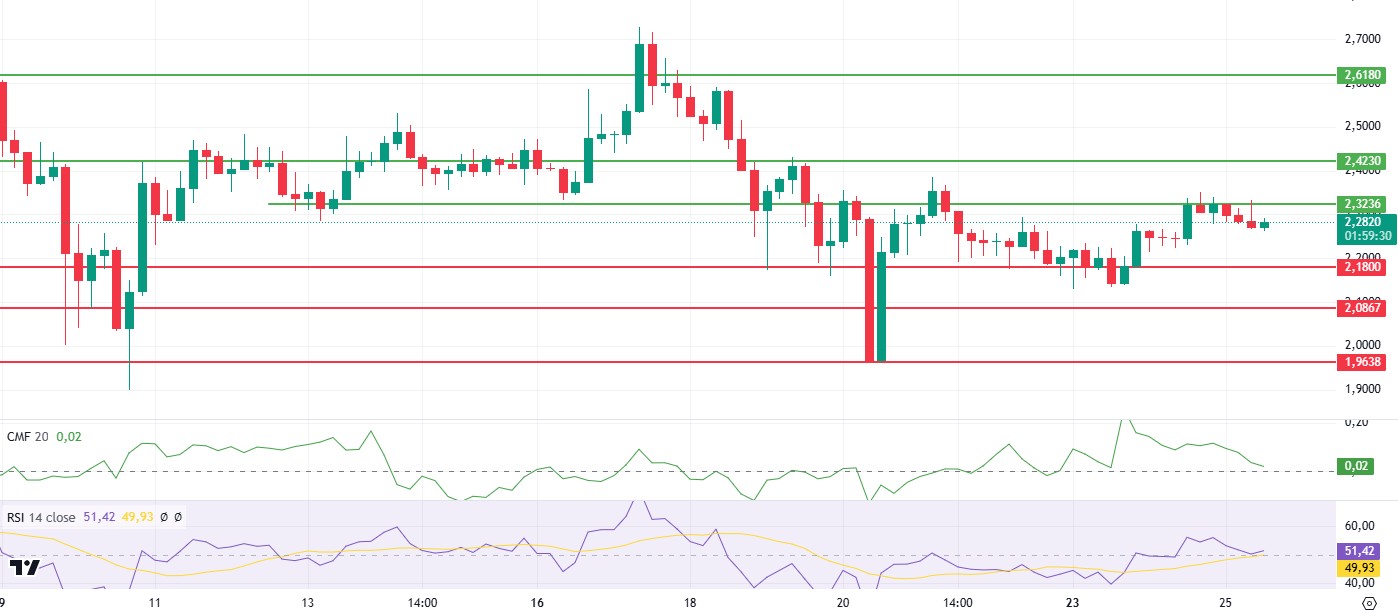
As highlighted in the morning analysis, XRP has experienced a slight pullback with selling pressure from this area after rising to the critical resistance at 2.32. Technical indicators offer important clues about the direction of the price.
It is seen that the Chaikin Money Flow (CMF) indicator continues its downward movement. This indicates that the capital entering the market is limited and buyers have not yet been able to exert enough pressure. However, the Relative Strength Index (RSI) is moving upwards again, supported by the simple moving average. This can be considered as a positive signal that momentum may pick up again. The “buy” signal on the Ichimoku indicator indicates that the negative outlook has eased somewhat and the price may exhibit slight increases. However, in order for these rises to become sustainable, the price needs to remain above the 2.32 level. Breaching this level could strengthen the market momentum and pave the way for bigger rises.
In downside possibilities, the 2.18 level stands out as an important support zone. This region is considered as a critical level where the price can react to possible pullbacks. If this support is maintained, the possibility of a rebound in the short term seems high. However, a move below this level could lead to increased selling pressure.
Supports 2.1800 – 2.0867- 1.9638
Resistances 2.3268 – 2.4230 – 2.6173
SOL/USDT
Noting that the historic peak in Solana day trading was reached at Christmas, Gokal chose an iconic line from the movie “Home Alone”. The reaction of Raj Gokal, one of the founders of Solana, was just as interesting; Gokal addressed the milestone with a special post on the X social network. Given the resurgence of “Solana is dead” chants in the crypto space, the latest success seems to silence the critics. At least the Silicon Valley blockchain doesn’t look so “dead” after breaking records in most key metrics. He shared as follows.
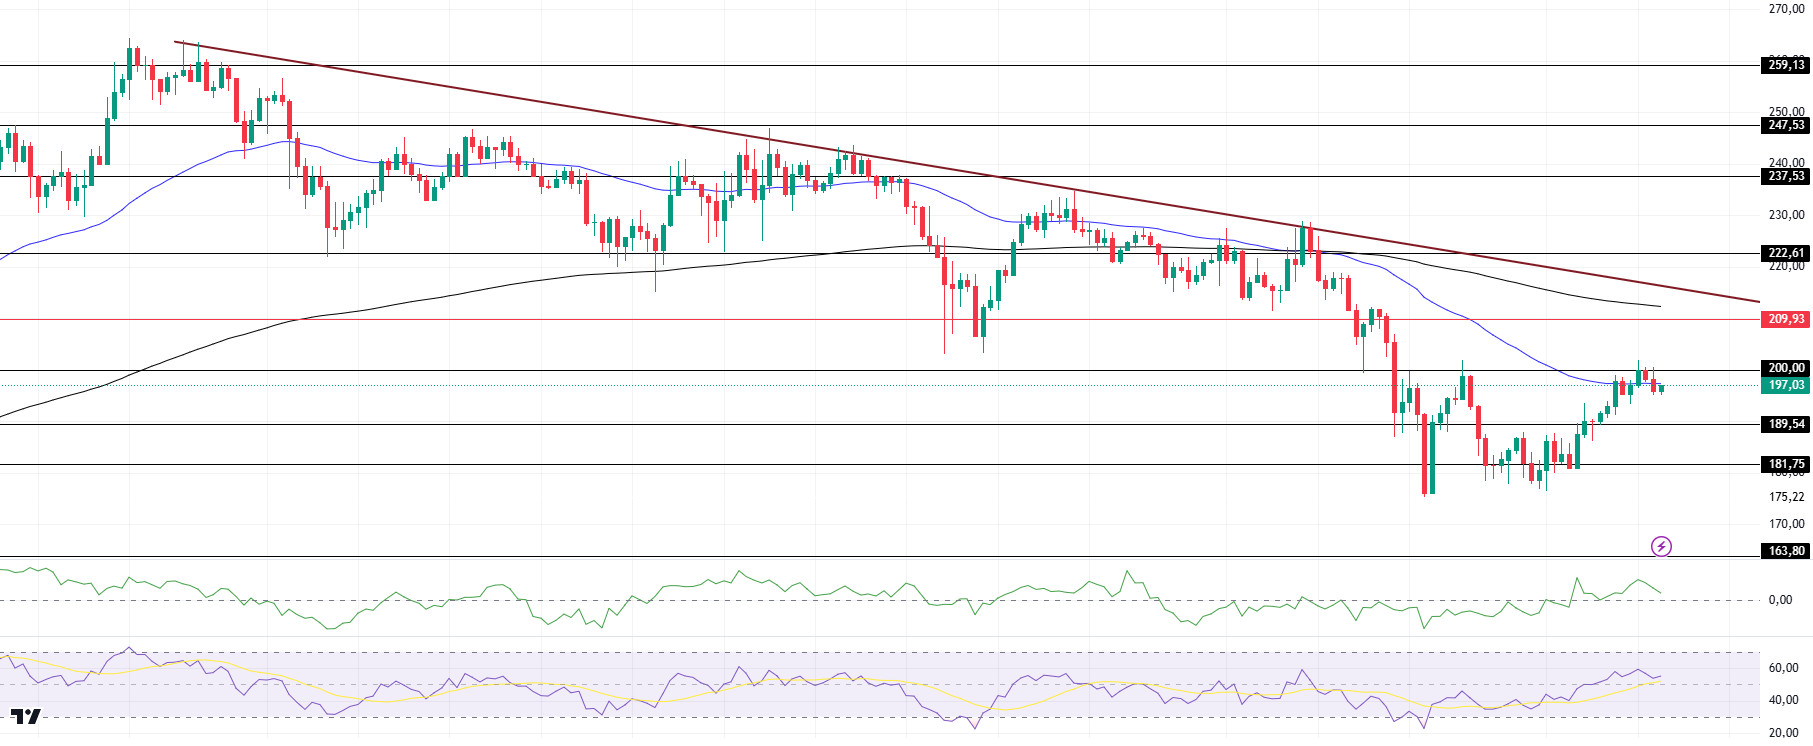
On the 4-hour timeframe, the 50 EMA (Blue Line) is below the 200 EMA (Black Line). The asset is close to testing the 200.00 level, which is a strong resistance. If it breaks here, the uptrend may continue. When we analyze the Chaikin Money Flow (CMF)20 indicator, money inflows started to decrease again. This seems to have increased the selling pressure again. However, Relative Strength Index (RSI)14 has accelerated from the neutral zone to the overbought zone. The 209.93 level stands out as a very strong resistance point in the uptrend driven by both the upcoming macroeconomic data and the news in the Solana ecosystem. If it breaks here, the rise may continue. In case of retracements for the opposite reasons or due to profit sales, the 163.80 support level can be triggered. If the price comes to these support levels, a potential bullish opportunity may arise if momentum increases.
Supports 189.54 – 181.75 – 163.80
Resistances 200.00 – 209.93 – 222.61
DOGE/USDT
According to the recent Dogecoin ecosystem report 2024, the Dogecoin Foundation hinted that the open-source software is now approaching the point where it is ready for adoption, presenting an opportunity for numerous for-profit businesses to take these tools and commercialize them in a way that will help bring Dogecoin payment solutions to the wider, non-technical audience. Dogecoin price, on the other hand, surged 7.5% on ETF optimism and rising whale accumulation. The thought of a potential DOGE ETF launch under Trump’s presidency and the new US SEC Chairman triggered this. Dogecoin whales recently raised 270 million coins, leading to speculation of further rallies ahead.
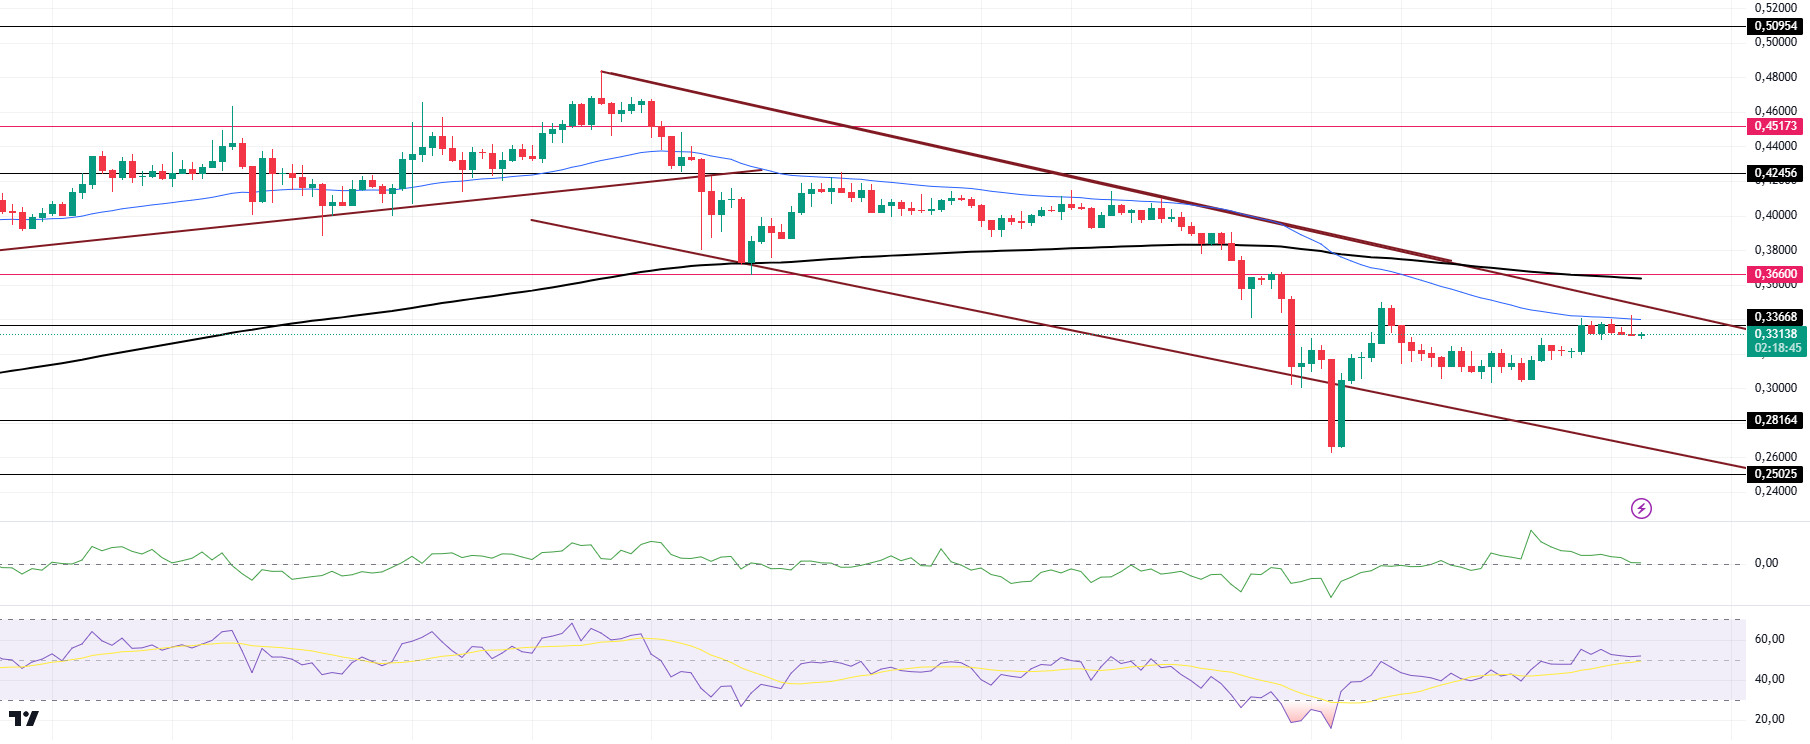
When we look at the chart, DOGE, which has been in a downtrend since December 8, is currently testing the 50 EMA as resistance after gaining momentum from the support of this trend and consolidating in the middle of the trend and may accelerate towards the ceiling level of the trend. On the 4-hour timeframe, the 50 EMA (Blue Line) continues to be below the 200 EMA (Black Line). When we examine the Chaikin Money Flow (CMF)20 indicator, although it is positive, money outflows have started to increase. However, Relative Strength Index (RSI)14 continues to move at the neutral zone level. The 0.36600 level stands out as a very strong resistance point in the rises driven by both the upcoming macroeconomic data and the innovations in the Doge coin. If DOGE catches a new momentum and rises above this level, the rise may continue strongly. In case of possible pullbacks due to macroeconomic reasons or negativity in the ecosystem, the 0.25025 level is an important support. If the price reaches these support levels, a potential bullish opportunity may arise if momentum increases.
Supports 0.28164 – 0.25025 – 0.21154
Resistances 0.33668 – 0.36600 – 0.42456
LEGAL NOTICE
The investment information, comments and recommendations contained herein do not constitute investment advice. Investment advisory services are provided individually by authorized institutions taking into account the risk and return preferences of individuals. The comments and recommendations contained herein are of a general nature. These recommendations may not be suitable for your financial situation and risk and return preferences. Therefore, making an investment decision based solely on the information contained herein may not produce results in line with your expectations.


