MARKET SUMMARY
Latest Situation in Crypto Assets
| Assets | Last Price | 24h Change | Dominance | Market Cap |
|---|---|---|---|---|
| BTC | 96,228.10 | 1.02% | 57.22% | 1,91 T |
| ETH | 3,383.24 | 1.30% | 12.14% | 407,25 B |
| XRP | 2.183 | 0.97% | 3.74% | 125,35 B |
| SOLANA | 189.44 | 0.64% | 2.70% | 90,69 B |
| DOGE | 0.3174 | 1.04% | 1.39% | 46,73 B |
| CARDANO | 0.8934 | 3.13% | 0.94% | 31,36 B |
| TRX | 0.2623 | 4.64% | 0.67% | 22,62 B |
| AVAX | 38.01 | 1.43% | 0.46% | 15,57 B |
| LINK | 23.10 | 1.58% | 0.44% | 14,74 B |
| SHIB | 0.00002202 | 2.17% | 0.39% | 12,99 B |
| DOT | 7.071 | 1.54% | 0.32% | 10,83 B |
*Prepared on 12.27.2024 at 14:00 (UTC)
WHAT’S LEFT BEHIND
Cambodia’s central bank approves compliant stablecoin services, but still bans Bitcoin
The Phnom Penh Post reports that the National Bank of Cambodia (NBC) has issued new regulations allowing commercial banks and payment institutions to offer services related to stablecoins and asset-backed cryptocurrencies for the first time, but unsupported assets such as Bitcoin are still prohibited.
5 Billion Dollars Worth of BGB Tokens to Destroy
Cryptocurrency exchange Bitget has released an updated version of its BGB whitepaper, announcing the launch of its buyback and destruction mechanism. In the first phase, 800 million BGB tokens held by the core team will be destroyed. This represents 40% of the total supply and aims to significantly reduce the circulating supply of BGB and increase its value.
HIGHLIGHTS OF THE DAY
Important Economic Calender Data
*There is no important calendar data for the rest of the day.
INFORMATION
*The calendar is based on UTC (Coordinated Universal Time) time zone.
The economic calendar content on the relevant page is obtained from reliable news and data providers. The news in the economic calendar content, the date and time of the announcement of the news, possible changes in the previous, expectations and announced figures are made by the data provider institutions. Darkex cannot be held responsible for possible changes that may arise from similar situations
MARKET COMPASS
Trading volumes remain classically low as we are experiencing holiday-shortened weeks at the end of the year. European stock markets are generally on the positive side and Wall Street index futures point to an opening in the negative territory. The dollar index eased slightly.
Major digital assets are trying to hold on to their morning gains. In the short term, we think that the horizontal movement, where wavelengths may increase relatively, may continue. In addition, we maintain our bullish expectation for the long term with the dynamics listed below.
From the short term to the big picture.
The victory of former President Trump on November 5, which was one of the main pillars of our bullish expectation for the long-term outlook in digital assets, produced a result in line with our predictions. Afterwards, the appointments made by the president-elect and the increasing regulatory expectations for the crypto ecosystem in the US and the emergence of BTC as a reserve continued to take place in our equation as positive variables. Although it is expected to continue at a slower pace, the FED’s signal that it will continue its interest rate cut cycle and the volume in crypto-asset based ETFs indicating an increase in institutional investor interest (in addition to MicroStrategy’s BTC purchases, BlackRock’s BTC ETF options starting to trade…) support our upward forecast for the big picture for now.
In the short term, given the nature of the market and pricing behavior, we think it would not be surprising to see occasional pauses or pullbacks in digital assets. However, at this point, it is worth emphasizing again that the fundamental dynamics continue to be bullish.
TECHNICAL ANALYSIS
BTC/USDT
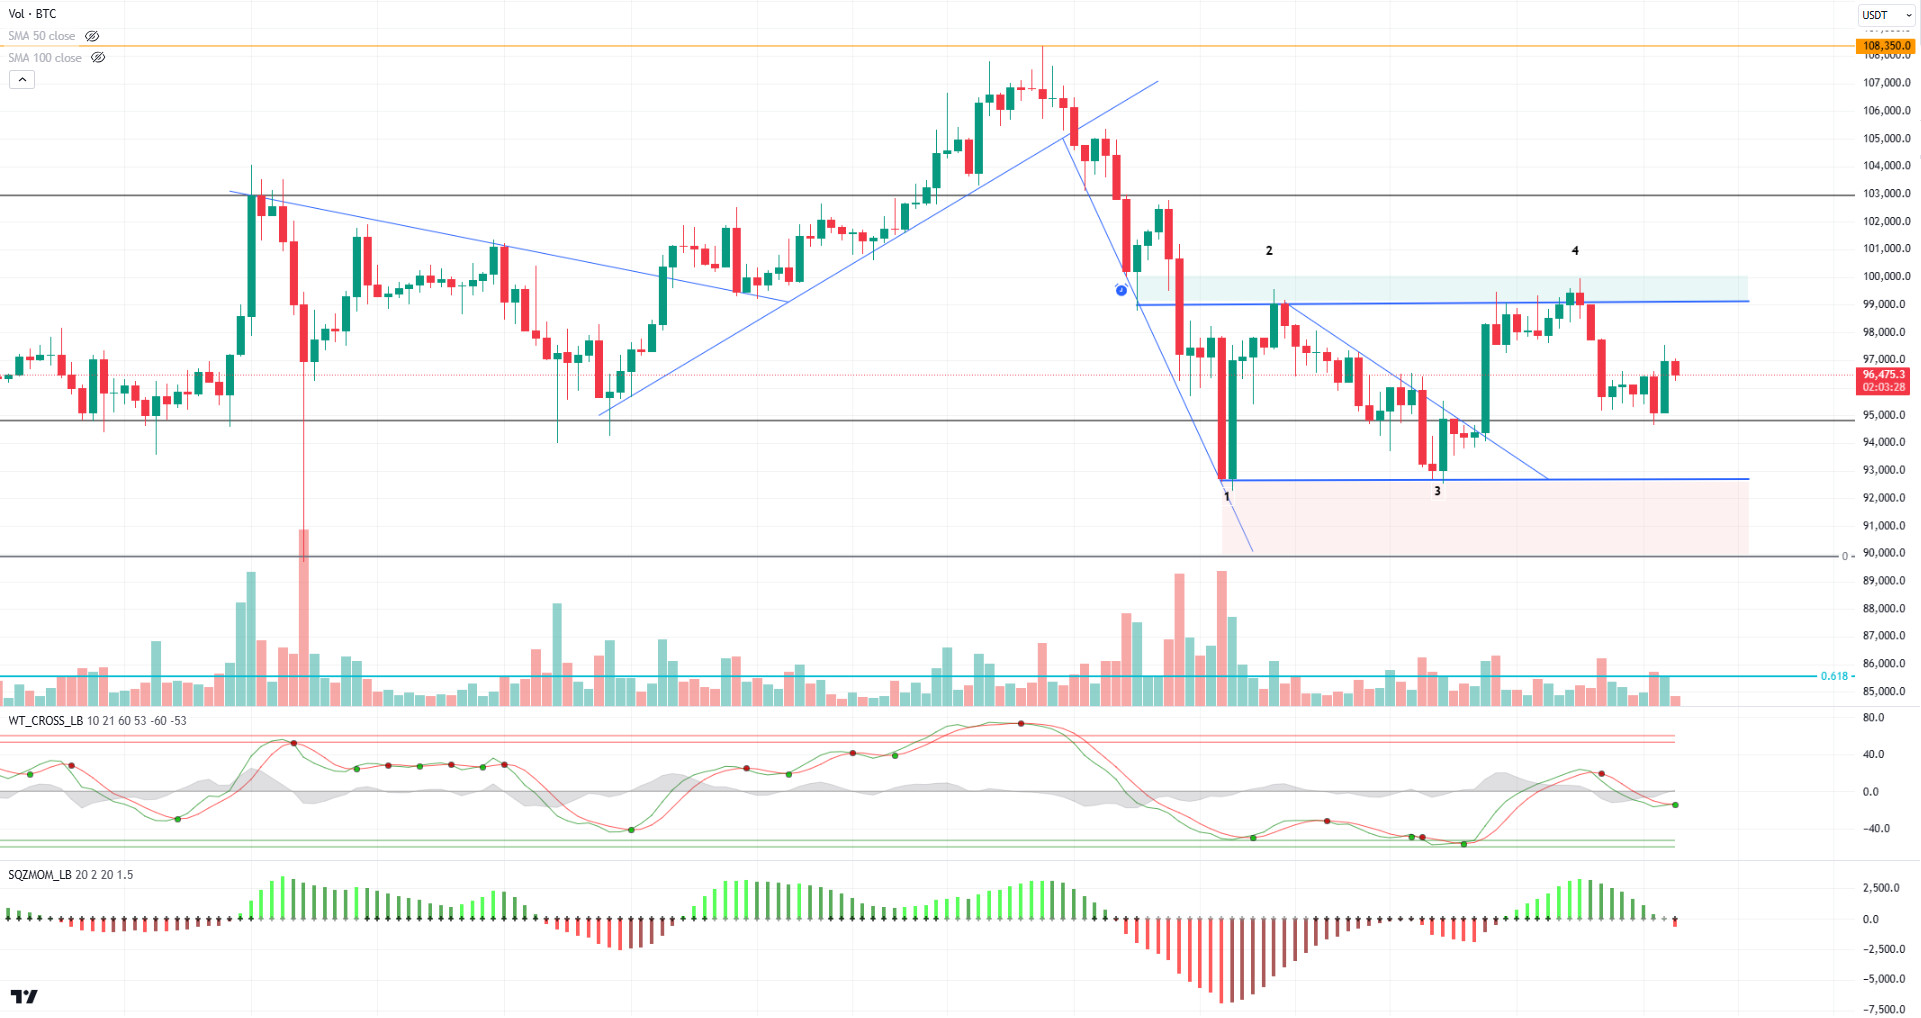
While a quiet agenda welcomed us towards the end of the year, the month closed in options data. With the last option delivery of the year, a total of 150,000 BTC options expired. The Put Call Ratio was set at 0.69, while the maximum pain point was $85,000 and the notional value was $14.7 billion.
When we look at the technical outlook with the option data, low volatility continues in the horizontal band range within the rectangle pattern. The price, which tested the minor resistance level of 97,200 during the day, could not stay here. In BTC, which is currently trading at 96,500, the weakening sales signal in the morning hours was replaced by a buy signal. In the momentum indicator, there is a transition to the negative zone. In case the price in search of direction catches an upward momentum, the crossing of resistance levels 2 and 4 accelerates the upward movement, while the breakout can target the 102,500 level, while the breakdown of support levels 1 and 3 can allow us to test the 92,500 level.
Supports 95,000 – 92,550 – 90,000
Resistances 97,200 – 99,100 – 102,500
ETH/USDT
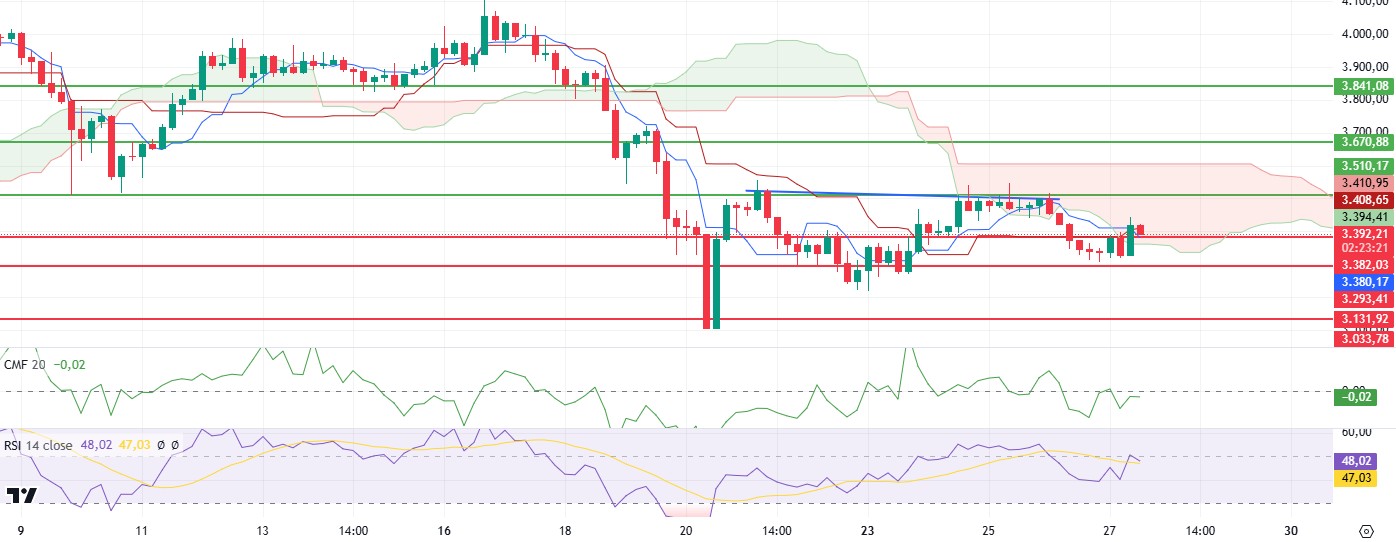
Ethereum gained an upward momentum in the morning hours, reaching 3,382. Then, although it accelerated its rise and reached the 3,440 region, the price, which could not hold at this level, retreated to 3,400 levels again due to indecision and weak volume in the market.
When technical indicators are analyzed, it is seen that the current price movement is complex and unstable, which is supported by some important signals. On the Ichimoku indicator, the Tenkan level crossing the Kijun level to the downside is a sell signal. This intersection usually signals that the market will move down. However, the price’s re-entry into the Kumo cloud prevented the signal from gaining clarity. The Chaikin Money Flow (CMF) indicator reveals another noteworthy signal. CMF has risen to the zero line, indicating that the money flow in the market has a positive outlook. However, this rise was realized with a negative divergence, indicating that the underlying strength of price movements is limited. This suggests that the capital flow into the market is not strong enough to support the rise and that the price has not found enough support for a sustainable upward movement. The Relative Strength Index (RSI) indicator presents a similar picture. The RSI shows weakness in momentum as the price rises, suggesting that the rise is not sustainable. Cumulative Volume Delta (CVD) data shows that the recent bullish move was mainly driven by the futures market, while the spot market failed to provide sufficient buying pressure. This suggests that the bullish move is based on a weak foundation and the risk of a pullback increases in the short term.
In the light of all these technical data, the price is likely to retreat towards the 3,382 region, which is an important support level. The reaction from this level will give a clearer signal about the direction of the market. If the price falls below 3,382 and closes in this area, the risk of Ethereum entering a new bearish wave will increase. However, a strong reaction from this level could allow momentum to regain strength and allow the price to start an upward movement . In particular, a volume-supported bullish move may pave the way for the price to retest the 3,440 level and create a permanent move above this level. Therefore, the 3,382 level is a critical threshold for both short-term movements and the future of the overall trend.
Supports 3,382 – 3,293- 3,131
Resistances 3,510 – 3,670 – 3,841
XRP/USDT
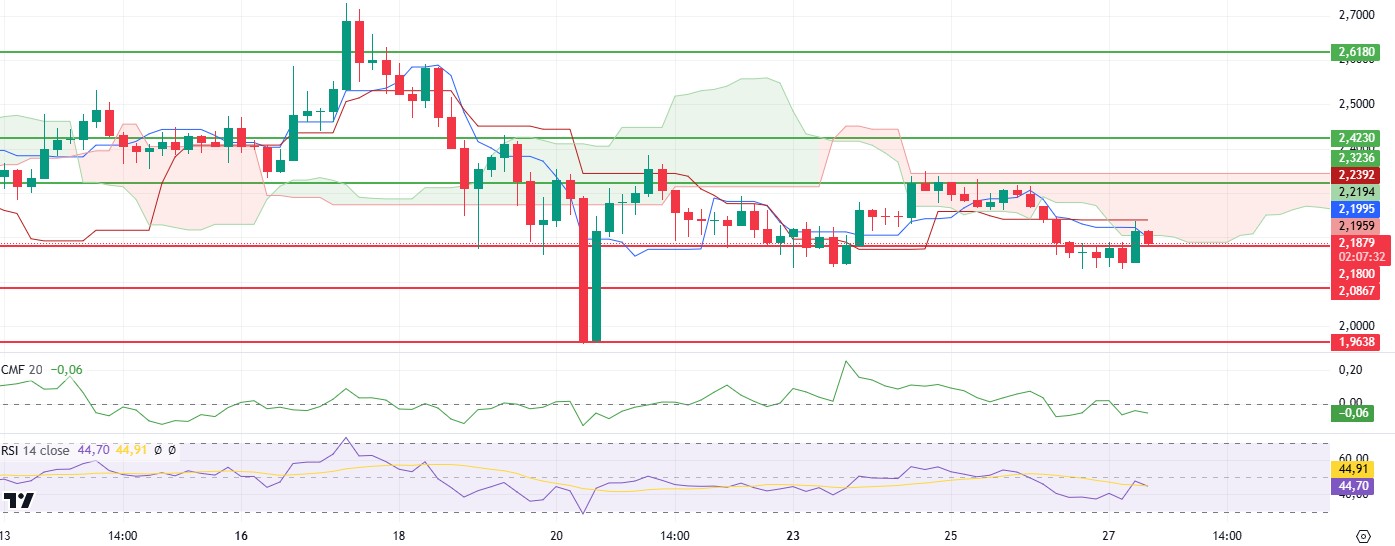
XRP rose as high as the Kijun level after managing to rise above the 2.18 level. However, the selling pressure at this point pulled the price back to 2.18 support.
With this move, Chaikin Money Flow (CMF) and Relative Strength Index (RSI) indicators also started to move downwards. The loss of momentum, especially in the RSI, suggests that the price’s bullish efforts remain weak. At the same time, the price broke below the Kumo cloud, creating a more negative picture in the market. The loss of the Kumo cloud usually signals a weakening of the trend and this has increased the bearish pressure
The fact that the price is now at a critical support level of 2.18 suggests that we are in the decision phase. If this level is broken to the downside, there is a possibility of a pullback to lower support levels. However, if the price manages to hold above 2.18 and gets a reaction from there, this move may support a re-test structure and the price may start rising again. Therefore, the 2.18 level is very important for the short-term direction of XRP. A reaction or downside breakout from this level could clarify the future movement of the price.
Supports 2.1800 – 2.0867- 1.9638
Resistances 2.3236 – 2.4230 – 2.6180
SOL/USDT
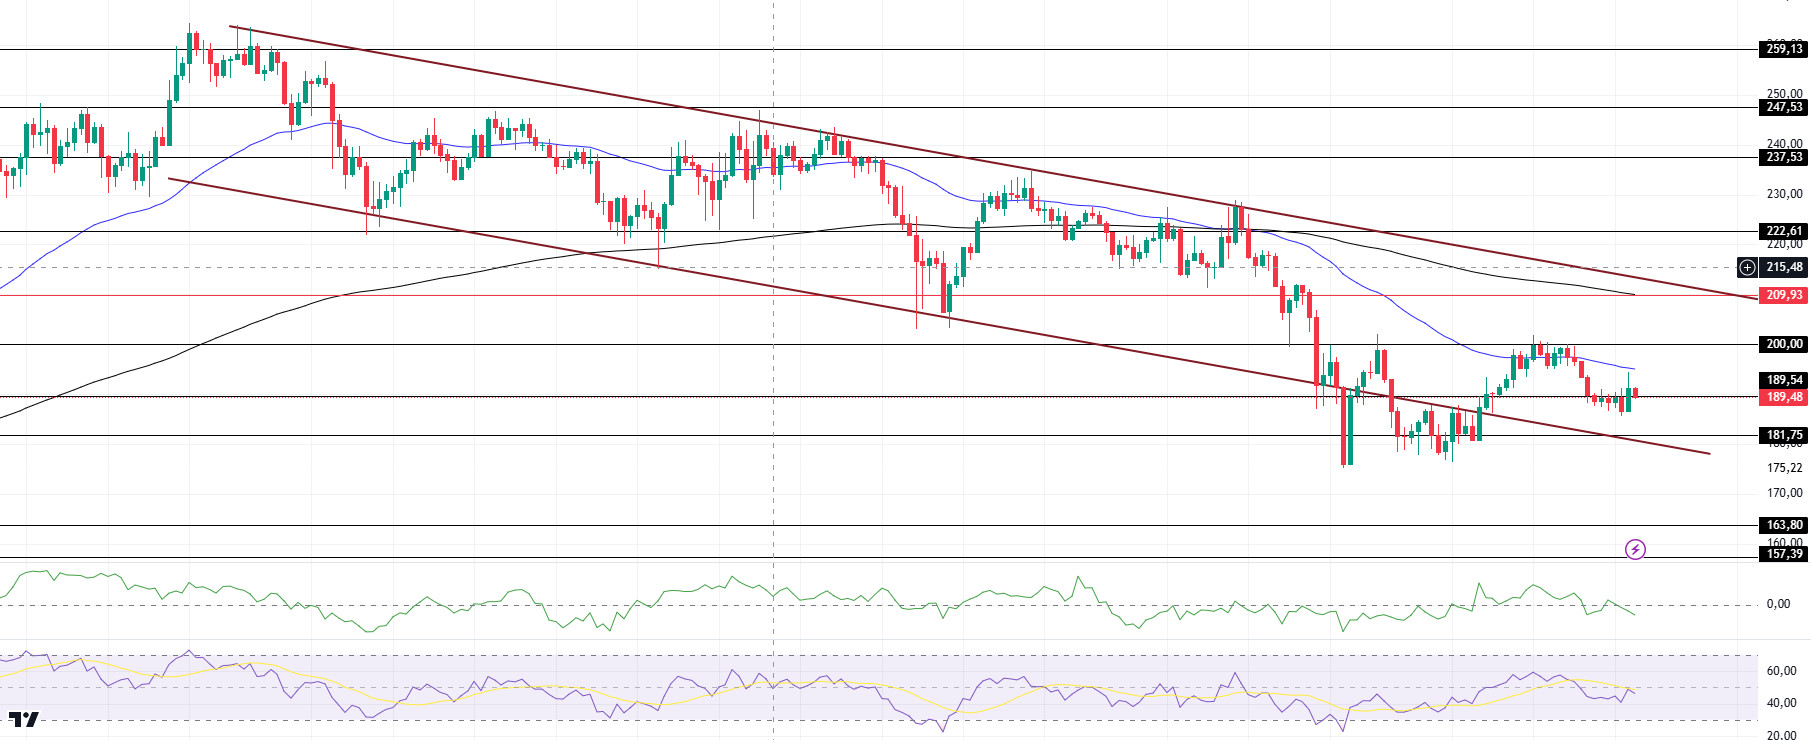
Solana continued its bearish move horizontally. On the 4-hour timeframe, the 50 EMA (Blue Line) is below the 200 EMA (Black Line). As a matter of fact, the asset tested but failed to break the 50 EMA resistance and the strong resistance at 200.00. If it retests and breaks here again, the rise may continue. When we analyze the Chaikin Money Flow (CMF)20 indicator, it is in negative territory and inflows are gradually decreasing. However, Relative Strength Index (RSI)14 is at a negative level. The 209.93 level is a very strong resistance point in the uptrend driven by both the upcoming macroeconomic data and the news in the Solana ecosystem. If it breaks here, the rise may continue. In case of retracements for the opposite reasons or due to profit sales, the 163.80 support level can be triggered. If the price comes to these support levels, a potential bullish opportunity may arise if momentum increases.
Supports 189.54 – 181.75 – 163.80
Resistances 200.00 – 209.93 – 222.61
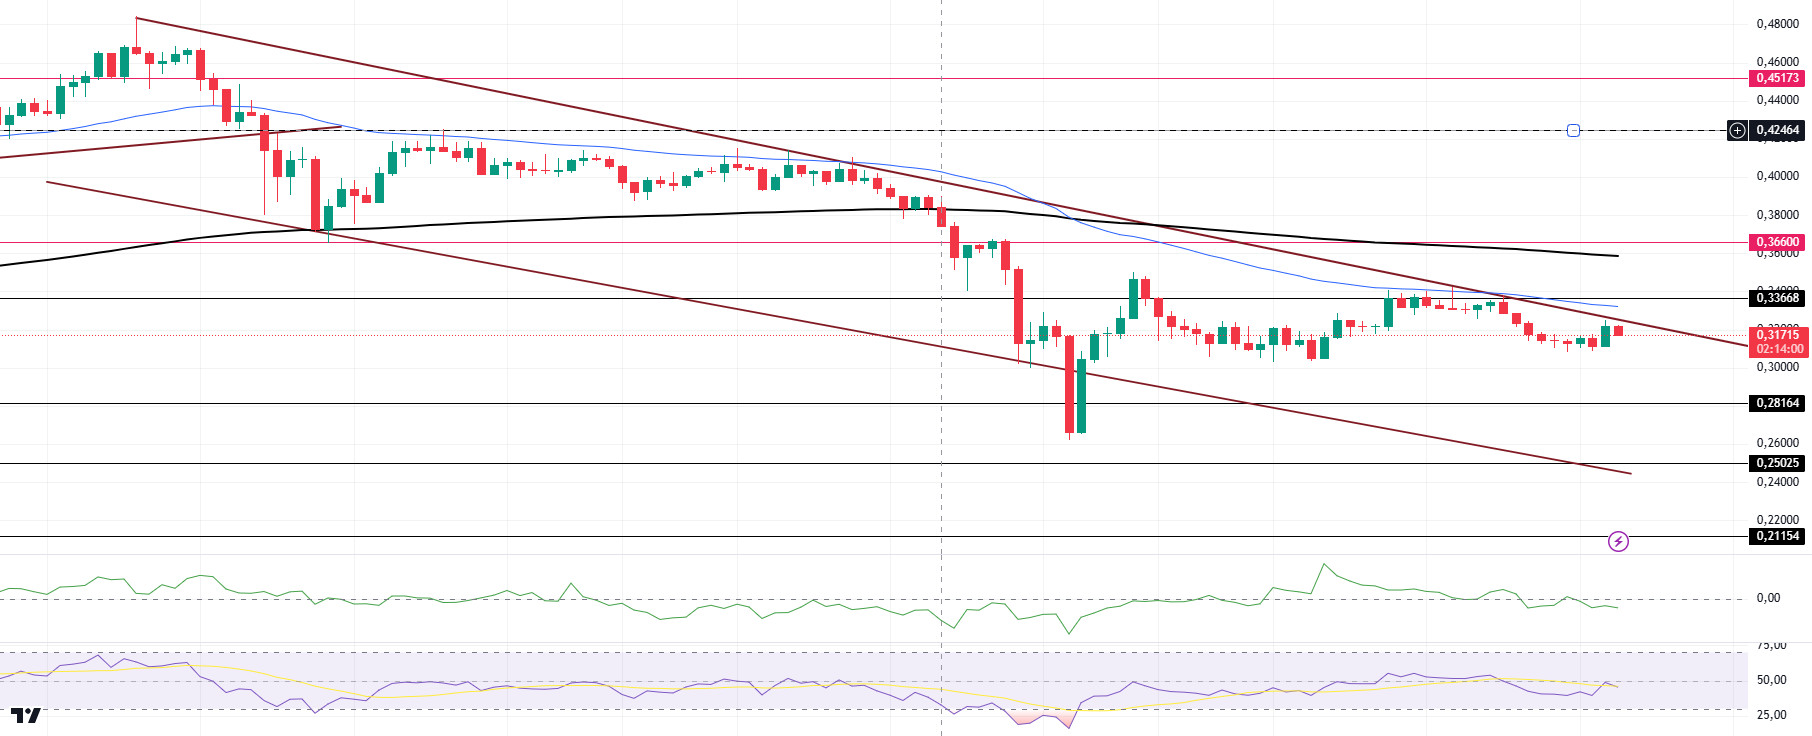
DOGE/USDT
When we look at the chart, DOGE, which has been in a downtrend since December 8, is testing the resistance level of the trend after gaining momentum from the support of this trend and consolidating in the middle of the trend. In the 4-hour timeframe, the 50 EMA (Blue Line) continues to be below the 200 EMA (Black Line). When we examine the Chaikin Money Flow (CMF)20 indicator, it moved into the negative zone. As a matter of fact, money outflows started to increase. However, Relative Strength Index (RSI)14 continues to move from the neutral zone to the oversold zone. The 0.36600 level stands out as a very strong resistance level in the rises driven by both the upcoming macroeconomic data and the innovations in the Doge coin. If DOGE catches a new momentum and rises above this level, the rise may continue strongly. In case of possible pullbacks due to macroeconomic reasons or negativity in the ecosystem, the 0.25025 level, which is the base level of the trend, is an important support. If the price reaches these support levels, a potential bullish opportunity may arise if momentum increases.
Supports 0.28164 – 0.25025 – 0.21154
Resistances 0.33668 – 0.36600 – 0.42456
LEGAL NOTICE
The investment information, comments and recommendations contained herein do not constitute investment advice. Investment advisory services are provided individually by authorized institutions taking into account the risk and return preferences of individuals. The comments and recommendations contained herein are of a general nature. These recommendations may not be suitable for your financial situation and risk and return preferences. Therefore, making an investment decision based solely on the information contained herein may not produce results in line with your expectations.


