
MARKET SUMMARY
Latest Situation in Crypto Assets
| Assets | Last Price | 24h Change | Dominance | Market Cap. |
|---|---|---|---|---|
| BTC | 94,298.05 | -1.51% | 54.54% | 1,87 T |
| ETH | 3,566.84 | -1.47% | 12.56% | 430,42 B |
| XRP | 2.539 | 3.88% | 4.28% | 146,75 B |
| SOLANA | 221.44 | -1.82% | 3.08% | 105,46 B |
| DOGE | 0.4023 | -4.26% | 1.73% | 59,17 B |
| CARDANO | 1.193 | 8.19% | 1.24% | 42,43 B |
| AVAX | 49.70 | 1.72% | 0.61% | 20,69 B |
| TRX | 0.2322 | 11.71% | 0.59% | 20,16 B |
| SHIB | 0.00002763 | -5.34% | 0.48% | 16,51 B |
| LINK | 23.33 | 10.02% | 0.44% | 14,86 B |
| DOT | 9.479 | 7.16% | 0.43% | 14,71 B |
*Prepared on 12.3.2024 at 14:00 (UTC)
WHAT’S LEFT BEHIND
BlackRock’s IBIT Spot Bitcoin ETF Exceeds 500,000 BTC
BlackRock’s IBIT Spot Bitcoin ETF has reached a total of 500,380 BTC less than a year since its launch. This represents 2.38% of the total Bitcoin supply and is worth around $48 billion. As of November 29, the fund held 496,854 BTC, surpassing the milestone with a net inflow of 3,526 BTC on Monday alone.
Trump’s Customs Policies Could Support Crypto and Gold
According to Saxo Bank executives, the protectionist customs policies that Donald Trump will adopt if he is re-elected president could have a positive impact on asset classes such as Bitcoin and gold. In addition to Trump’s moves that strengthened the dollar index in his previous term, it is evaluated that these assets may increase their attractiveness as alternative investment instruments.
European Central Bank (ECB) Publishes Progress Report on Digital Euro Project
In the second progress report of the digital euro project, the ECB shared its work on the integration of digital payment systems in the euro area. The report focuses on minimum user experience standards, a risk management framework and research to understand user preferences. The Digital Euro Initiative Rulebook has also been updated. The project continues to take important steps towards the development of digital payment infrastructure.
HIGHLIGHTS OF THE DAY
Important Economic Calender Data
| Time | News | Expectation | Previous |
|---|---|---|---|
| 15:00 | US JOLTS Job Openings (Oct) | 7.51M | 7.44M |
| 17:35 | US FOMC Member Kugler Speaks | – | – |
| 20:45 | US FOMC Member Goolsbee Speaks | – | – |
INFORMATION
*The calendar is based on UTC (Coordinated Universal Time) time zone.
The economic calendar content on the relevant page is obtained from reliable news and data providers. The news in the economic calendar content, the date and time of the announcement of the news, possible changes in the previous, expectations and announced figures are made by the data provider institutions. Darkex cannot be held responsible for possible changes that may arise from similar situations.
MARKET COMPASS
In global markets, the geopolitical agenda was influential in the pricing behavior before the opening of the US session. Following the declaration of martial law in South Korea and the announcement that the Russian navy was conducting exercises in the Mediterranean, we saw an increase in demand for assets that are considered safe havens. Swiss Franc, Yen and gold appreciated, while US bond yields declined. This also put pressure on digital assets.
In the rest of the day, it should be monitored whether the hot news flow will continue. In addition, JOLTS data from the US and statements from the Federal Reserve officials will be under scrutiny. However, as the focus of the markets has shifted a bit more towards geopolitical risks and political agenda after the recent news flow, the possible effects of the data and statement calendar may remain limited.
From the short term to the big picture.
The victory of former President Trump on November 5, which was one of the main pillars of our bullish expectation for the long-term outlook in digital assets, produced a result in line with our forecasts. In the aftermath, the president-elect’s appointments to Congress and the increased regulatory expectations for the crypto ecosystem in the US remained in our equation as a positive variable. Although Powell gave cautious messages in his last speech, the fact that the FED continued its interest rate cut cycle and the volume in BTC ETFs indicates an increase in institutional investor interest (in addition, MicroStrategy’s BTC purchases, Microsoft’s start to evaluate the purchase issue, BlackRock’s BTC ETF options start trading…) supports our upward forecast for the big picture for now.
In the short term, given the nature of the market and pricing behavior, we think it would not be surprising to see occasional respite or pullbacks in digital assets. However, at this point, it would be useful to underline again that the fundamental dynamics continue to be bullish. We continue to evaluate the pullbacks following today’s news flow, which increased concerns that geopolitical tensions may increase.
TECHNICAL ANALYSIS
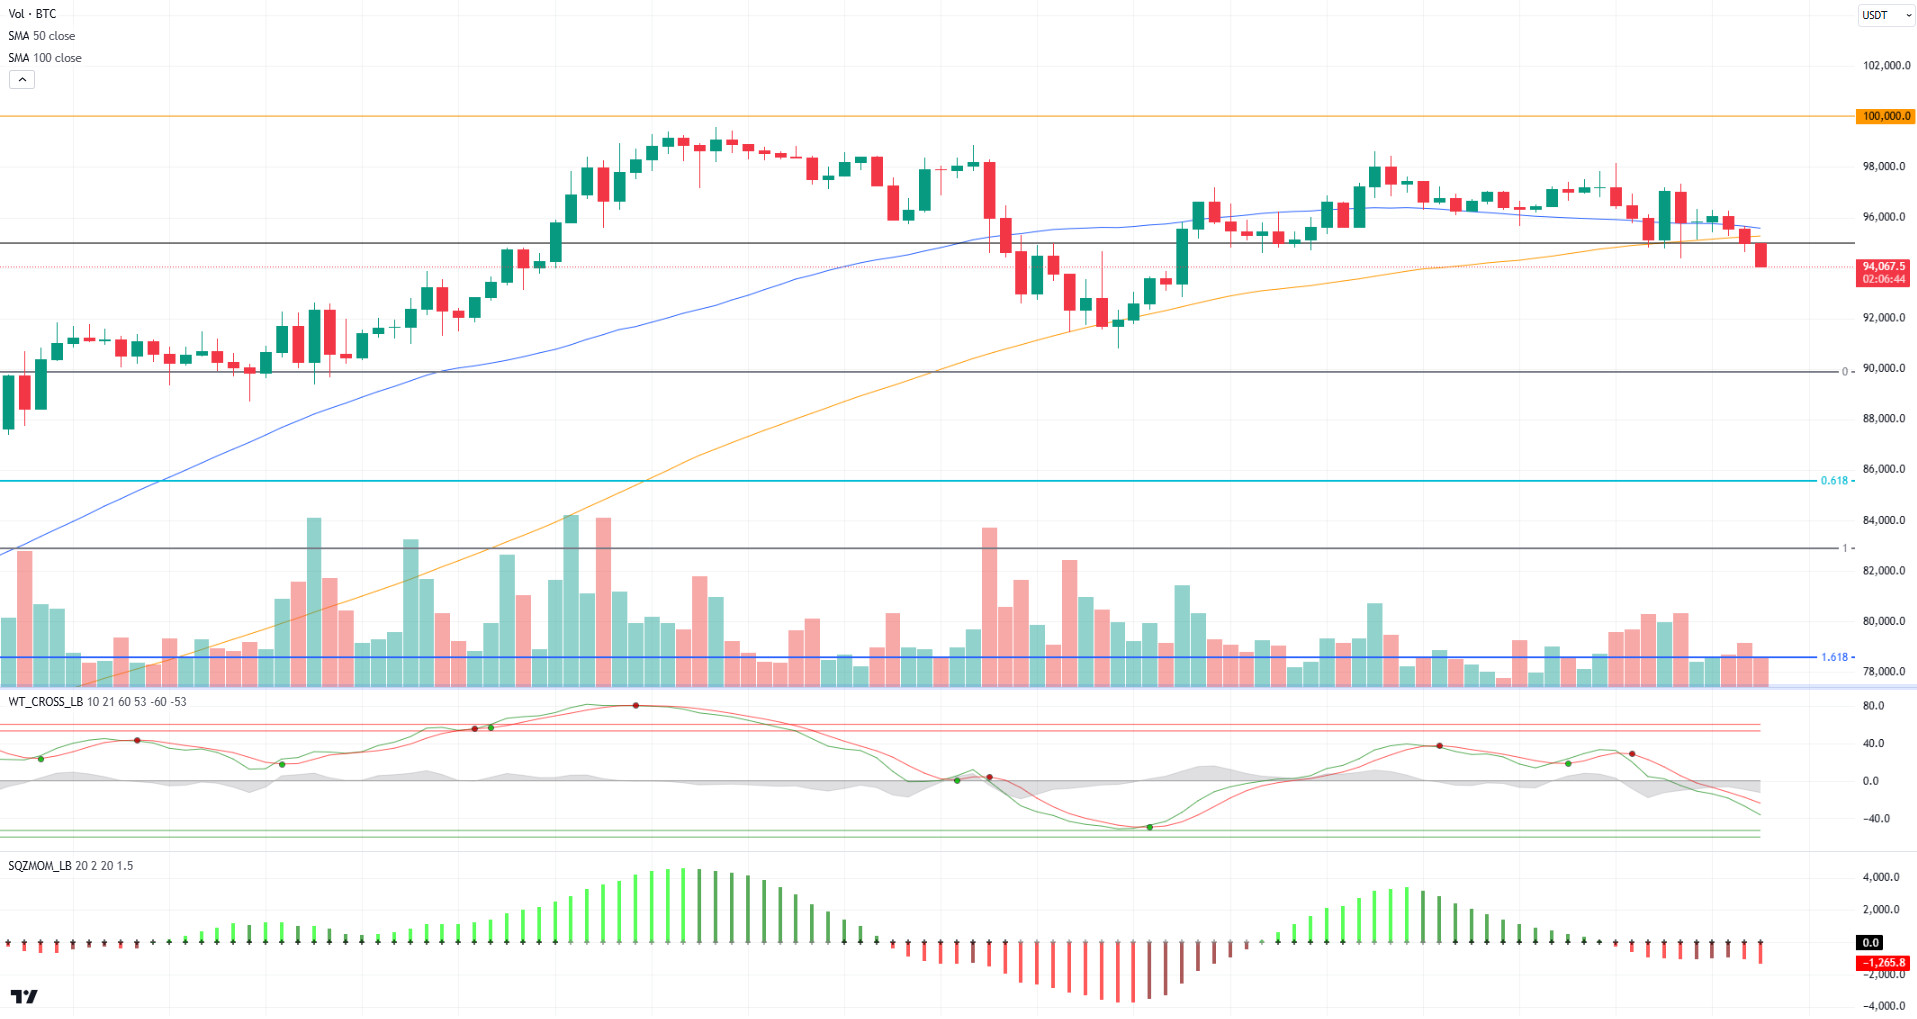
BTC/USDT
Although there is no new development on the agenda for BTC, when we look at the technical outlook, we see that the price has fallen below the support level of 95,000. The weakening of the upside momentum during the day allowed the price to fall below the 50 and 100-day SMA lines. BTC, which is currently trading at 94,000, may deepen the selling pressure with hourly closes below the support level and pull the price to the minor support level of 91,400. Indeed, technical oscillators continue to signal a sell signal, while the momentum indicator is weakening again. In case BTC rebounds as positive pricing in global markets affects the US market, we will watch for closes above the 95,000 level.
Supports 95,000 – 92,500 – 90,000
Resistances 99,655 – 100,000 – 105,000
ETH/USDT
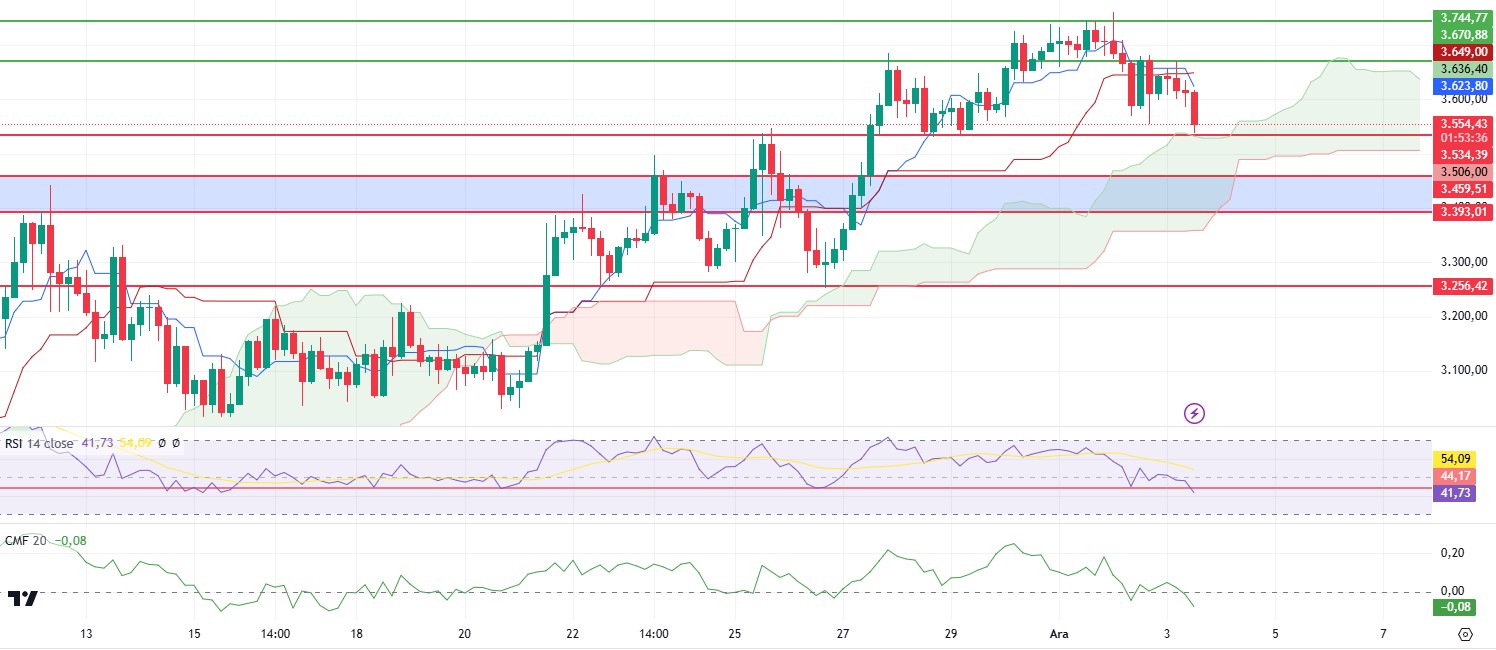
ETH started its downward movement by exceeding the 3,670 level after the rise it experienced in the night hours. With this bearish movement, sell signals have started to form on indicators and oscillators. First of all, when we look at the ichimoku indicator, we see that a clear sell signal is formed with the downward cut of the tenkan level to the kijun level and the fall of the kumo cloud. Chaikin Money Flow (CMF), on the other hand, has fallen to the negative zone and strengthened its downward outlook. Relative Strength Index (RSI) has broken its important support point. With this decline, we see that the Cumulative Volume Delta (CVD) continues to rise on the spot side and sales are predominant on the futures side. For these reasons, although it can be inferred that the decline may continue when analyzed technically, sharp rises can be seen with the reaction to be taken from 3.534 resistance. The loss of the 3.534 level may deepen the decline and cause retracements to 3.459 levels.
Supports 3,534 – 3,459 – 3,393
Resistances 3,670- 3,744 – 3,839
XRP/USDT
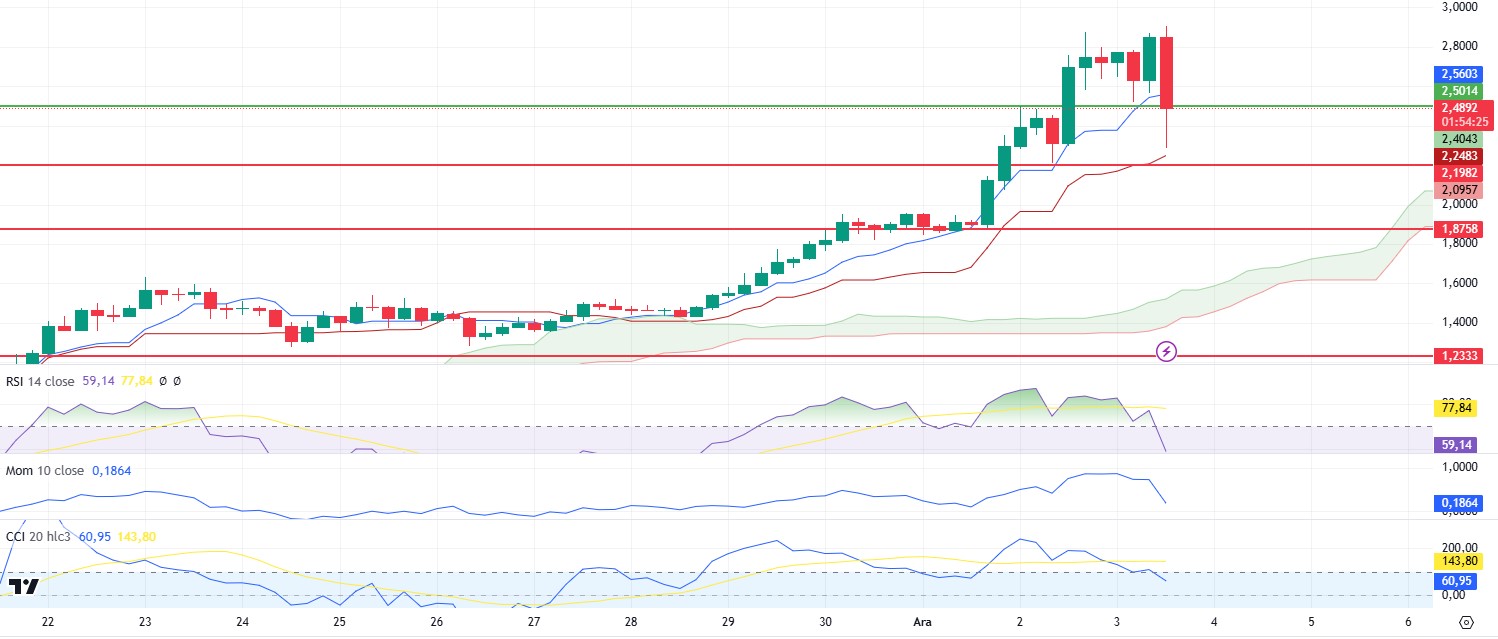
As mentioned in the morning analysis, XRP continues its correction with the Relative Strength Index (RSI) breaking out of the overbought zone. Chaikin Money Flow (CMF), on the other hand, continued to decline, falling as low as 0.22. With the sharp decline in momentum, the Commodity Channel Index (CCI) is generating a clear sell signal. In the light of this data, it can be said that the decline may continue with the break of 2.24 kijun support. The regain of the 2.5 level may bring new highs.
Supports 2.1982 – 1.8758- 1.2333
Resistances 2.5014 – 3.105
SOL/USDT
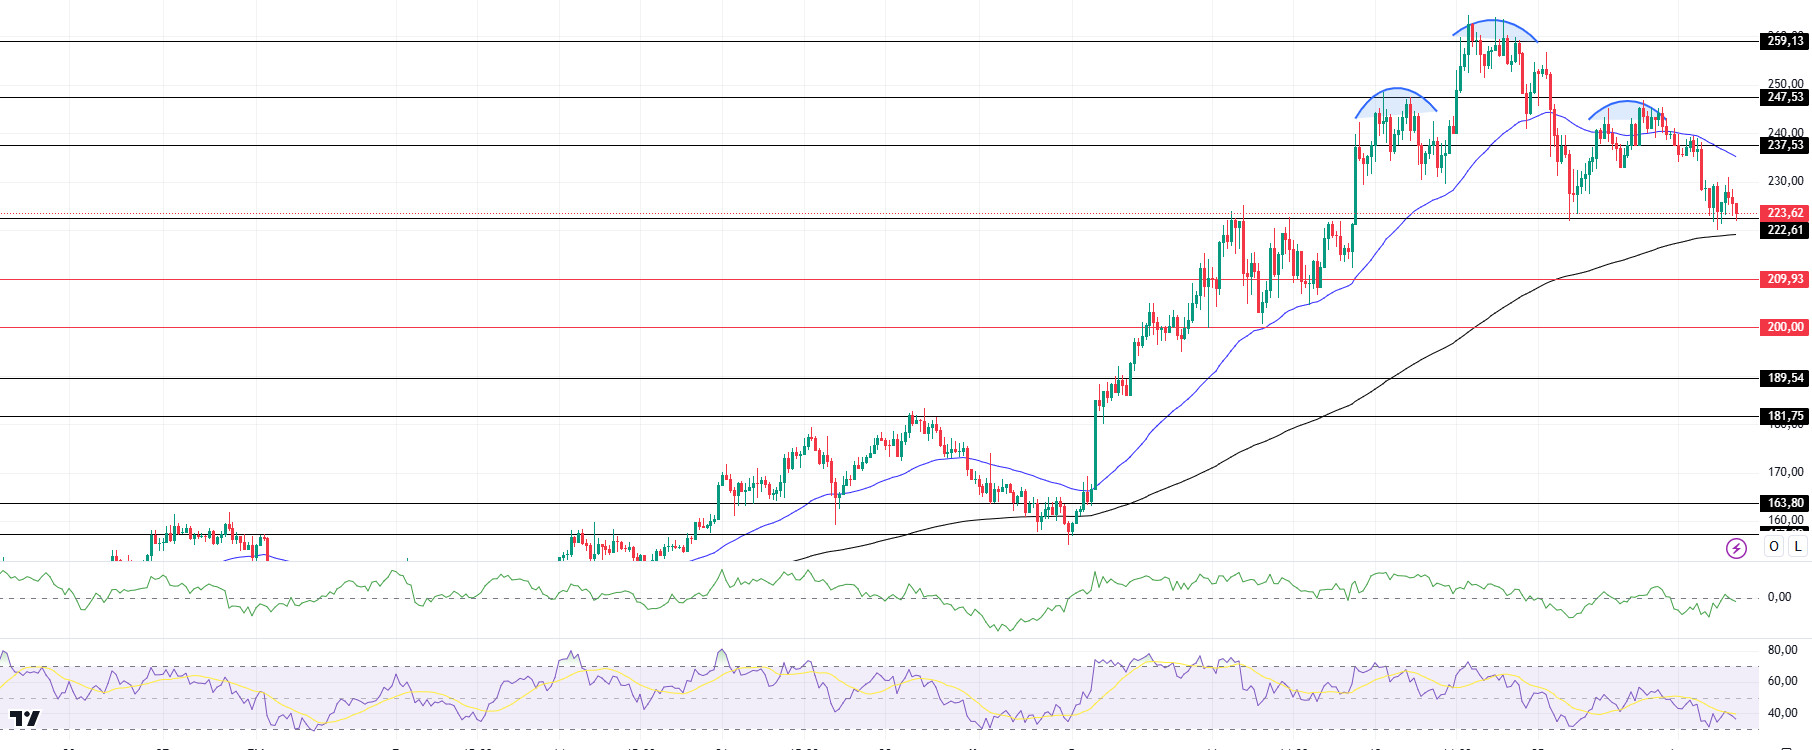
The cryptocurrency market remains uncertain. On Solana, the latest data reveals a significant increase in exits from exchanges. In the 4-hour timeframe, the 50 EMA (Blue Line) is above the 200 EMA (Black Line). Since November 22, SOL, which has been in a downtrend since November 22, broke the downtrend last week and moved upwards. However, this did not last long and it rejoined the downtrend. However, when we examine the Chaikin Money Flow (CMF)20 indicator, it is seen that there is a decrease in money inflows. This can be shown as a bearish signal. However, Relative Strength Index (RSI)14 is approaching the oversold zone. Another potential directional indicator on the chart, the shoulder head and shoulders pattern, has started to work. This could lead to a decline to 189.54 if the pattern continues to work. On the other hand, the price received support from the 200 EMA. If it breaks it, the declines may deepen. The 247.53 level is a very strong resistance point in the uptrend driven by both macroeconomic conditions and innovations in the Solana ecosystem. If it breaks here, the rise may continue. In case of retracements due to possible macroeconomic reasons or profit sales, the support levels of 209.93 and 189.54 may be triggered again. If the price reaches these support levels, a potential bullish opportunity may arise if momentum increases.
Supports 222.61 – 209.93 – 200.00
Resistances 237.53 – 247.53 – 259.13
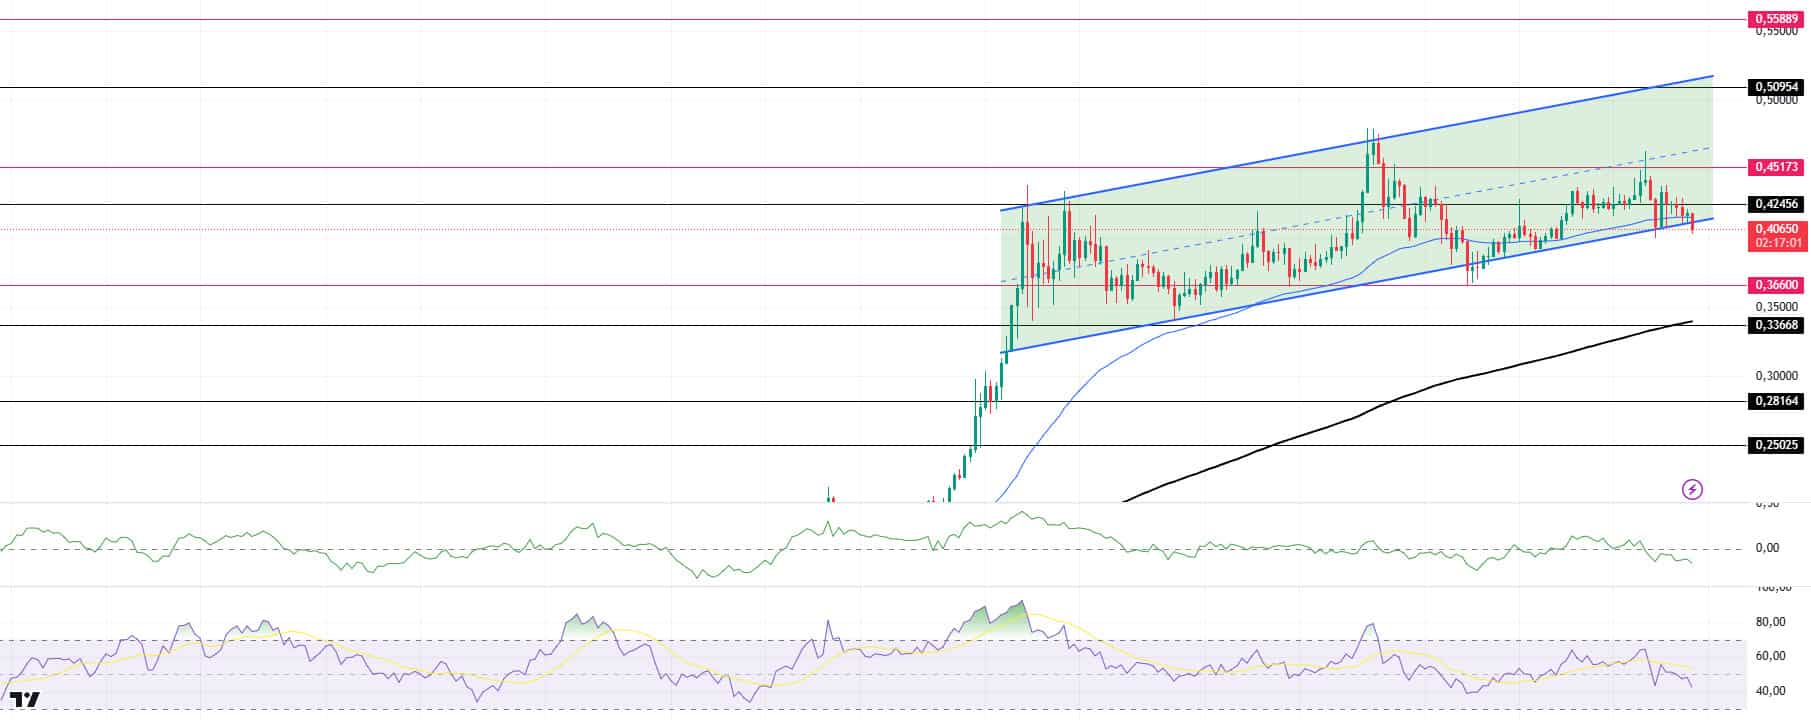
DOGE/USDT
When we look at the chart, the asset, which has been in an uptrend since November 11, is testing the base level of the trend once again by entering a downward trend, although it has been rising with support from both the base level of the trend and the 50 EMA. If the upward momentum is strong, the 0.50954 level may be triggered. On the 4-hour timeframe, the 50 EMA (Blue Line) is above the 200 EMA (Black Line). But the gap between the two averages is still too wide. This may cause pullbacks. On the other hand, when we look at the RSI 14 indicator, we see that it is accelerating towards the oversold zone. However, when we examine the Chaikin Money Flow (CMF)20 indicator, we see that there are money outflows. The 0.50954 level is a very strong resistance point in the rises driven by both macroeconomic conditions and innovations in Doge coin. If DOGE maintains its momentum and rises above this level, the rise may continue strongly. In case of retracements due to possible macroeconomic reasons or profit sales, the 0.36600 support level can be triggered again. If the price reaches these support levels, a potential bullish opportunity may arise if momentum increases.
Supports 0.36600 – 0.33668 – 0.28164
Resistances 0.42456 – 0.45173 – 0.50954
LEGAL NOTICE
The investment information, comments and recommendations contained herein do not constitute investment advice. Investment advisory services are provided individually by authorized institutions taking into account the risk and return preferences of individuals. The comments and recommendations contained herein are of a general nature. These recommendations may not be suitable for your financial situation and risk and return preferences. Therefore, making an investment decision based solely on the information contained herein may not produce results in line with your expectations.
