
MARKET SUMMARY
Latest Situation in Crypto Assets
| Assets | Last Price | 24h Change | Dominance | Market Cap. |
|---|---|---|---|---|
| BTC | 97,080.47$ | -0.87% | 60.04% | 1,92 T |
| ETH | 2,649.65$ | -0.76% | 9.98% | 319,79 B |
| XRP | 2.455$ | 0.13% | 4.43% | 141,86 B |
| SOLANA | 199.38$ | -3.89% | 3.04% | 97,30 B |
| DOGE | 0.2575$ | 1.66% | 1.19% | 38,16 B |
| CARDANO | 0.7940$ | 12.32% | 0.88% | 28,22 B |
| TRX | 0.2454$ | 3.27% | 0.66% | 21,15 B |
| LINK | 18.98$ | 0.22% | 0.38% | 12,15 B |
| AVAX | 26.05$ | 0.83% | 0.34% | 10,76 B |
| SHIB | 0.00001577$ | -1.85% | 0.29% | 9,32 B |
| DOT | 4.908$ | 0.09% | 0.24% | 7,62 B |
*Prepared on 2.11.2025 at 14:00 (UTC)
WHAT’S LEFT BEHIND
Governor of the Bank of England: High Regulatory Standards Needed for Stablecoins
Andrew Bailey, Governor of the Bank of England, pointed to the potential impact of stablecoins on financial stability and called for higher regulatory standards for these assets.
FTX to Pay Back $6.5 – $7 Billion in First Phase
FTX will start repaying $16 billions of creditor debt as of February 18, 2025. An initial payment of between $6.5 and $7 billion is planned. The reparations will be calculated based on November 2022 prices.
Stablecoin Circulating Supply Increases by $16.97 Billion Since the Beginning of 2025
Since the beginning of 2025, the circulating supply of stablecoins has increased from approximately $194.2 billion to $211.2 billion, according to Glassnode data. This increase accelerated in February, signaling a strong growth trend.
HIGHLIGHTS OF THE DAY
Important Economic Calender Data
| Time | News | Expectation | Previous |
|---|---|---|---|
| 15:00 | FED Chair Powell Testifies | ||
| 20:30 | FOMC Member Williams Speaks | ||
| 20:30 | FOMC Member Bowman Speaks |
INFORMATION
*The calendar is based on UTC (Coordinated Universal Time) time zone.
The economic calendar content on the relevant page is obtained from reliable news and data providers. The news in the economic calendar content, the date and time of the announcement of the news, possible changes in the previous, expectations and announced figures are made by the data provider institutions. Darkex cannot be held responsible for possible changes that may arise from similar situations
MARKET COMPASS
The US agenda continues to dominate the global markets with Trump’s tariffs and expectations regarding the Federal Reserve’s interest rate cut path. Finally, President Trump signed an executive order imposing 25% tariffs on steel and aluminium imports with no exceptions or exemptions. Also today, European Commission President Ursula von der Leyen announced that the EU will take counter measures. Wall Street futures point to a negative open and digital assets are under pressure.
Fed Chair Powell’s remarks may be important later in the day. Earlier, Cleveland Fed President Beth Hammack said that it is appropriate to keep interest rates steady “for a while”. Powell’s statements, especially during the Q&A session, may have an impact on the markets.
Powell’s Defenses
FED Chair Powell will make two defenses this week. The first one will be today in Washington DC before the Senate Banking Committee on the Semiannual Monetary Policy Report. The other will be tomorrow to the House of Representatives Financial Services Committee and as usual, the text of the speech will remain unchanged.
Markets will be looking for clues from the Fed’s top official about the timing and path of the Bank’s rate cuts in 2025. The Chairman’s test against questions from members of the relevant Committees about the tight labor market and the recent rise in inflation will be as important as it is twice a year.
We do not expect Powell to provide any major new information on the rate cut path, but he may feel the need to update his rhetoric in the wake of recent macro indicators. Accordingly, if the chairman hints at a relatively faster or earlier-than-priced rate cut (25 basis points in June, according to CME FedWatch), there could be an opportunity for a rally in digital assets. In the opposite scenario, cryptocurrencies could come under pressure. Our expectation is that we will not see a major change of stance, as we have underlined before, but the surprise could be a stronger speech that there will be no rush to cut rates.
From the short term to the big picture.
Trump’s victory on November 5, one of the main pillars of our bullish expectation for the long-term outlook in digital assets, produced a result in line with our predictions. In the process that followed, the appointments made by the president-elect and the increasing regulatory expectations for the crypto ecosystem in the US, as well as the emergence of BTC as a reserve, continued to take place in our equation as positive variables. Then, 4 days after the new President took over the White House, he signed the “Cryptocurrency Working Unit” decree, which was among his election promises, and we think that the positive reflection of the outputs it will produce in the coming days on digital assets may continue.
On the other hand, the expectations that the FED will continue its interest rate cut cycle, albeit on hiatus for now, and the fact that the volume in crypto-asset ETFs indicates an increase in institutional investor interest, support our upside forecast for the big picture. In the short term, given the nature of the market and pricing behavior, we think it would not be surprising to see occasional pause or pullbacks in digital assets. However, at this point, it is worth underlining again that we think the fundamental dynamics continue to be bullish.
TECHNICAL ANALYSIS
BTC/USDT
Bank of England Governor Andrew Bailey emphasized the need for stricter regulations, stating that stablecoins could pose a risk to financial stability. FTX plans to repay $6.5 – 7 billion in debt in the first stage of the bankruptcy process. According to Bitwise data, 69.4% of the Bitcoin supply is held by individual investors, while governments and companies hold only 5.8% of the total supply.
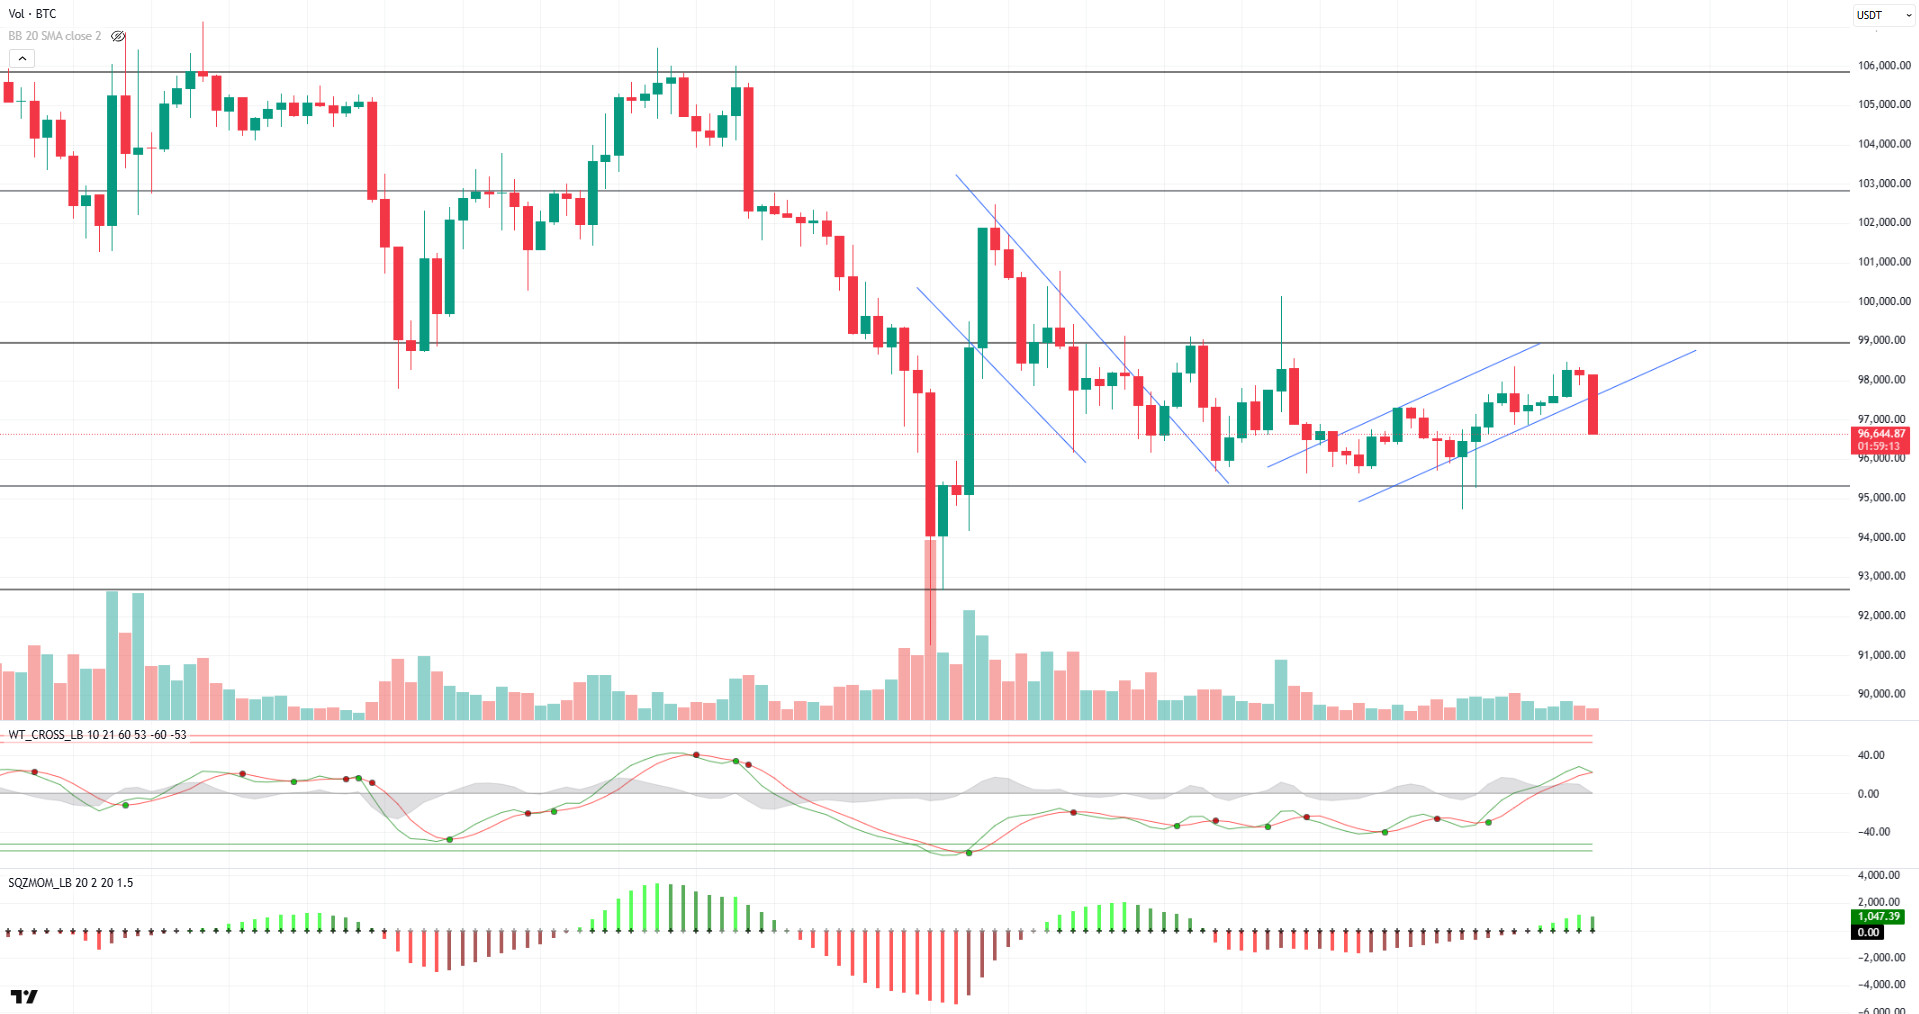
BTC, which tested the 98.500 level during the day, has turned its direction down again as of the moment of our analysis. In our previous analysis, we talked about the uptrend structure observed on hourly charts; however, a downward breakout has now occurred in BTC price and this uptrend structure has been broken. Analyzing the technical oscillators, it is possible to say that a sell signal is close to forming on the hourly charts. Also, the momentum indicator has started to lose strength again. If the decline deepens, the 95,000 level stands out as an important major support zone. On the other hand, if this decline is limited to a momentary correction and the price rebounds, the 98,000 level will be followed as intermediate resistance
Supports 97,000 – 95,000 – 92,800
Resistances 99,100 -101,400 – 102,800
ETH/USDT
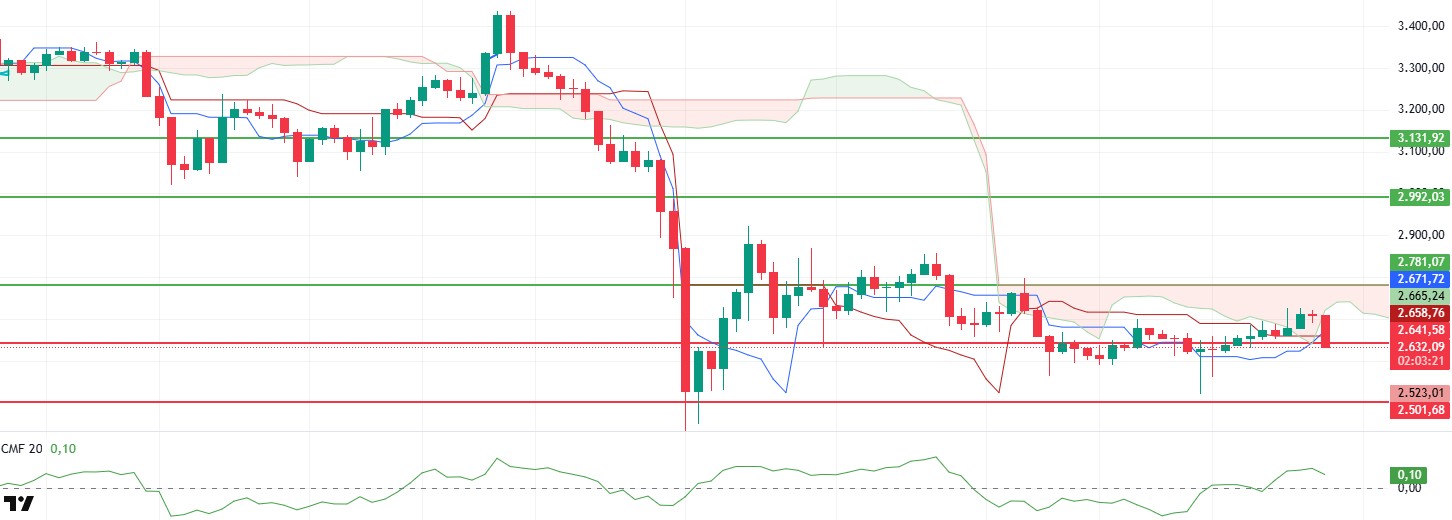
Although ETH managed to gain the $ 2,700 level with slight increases as of last night, it retreated to $ 2,630 with the selling pressure during the day. With this price movement, no significant change was observed in technical indicators, while a relatively horizontal outlook prevails in the market. However, it seems likely that volatility will increase, and sharp price movements will be experienced during the speech to be delivered by US Securities and Exchange Commission (SEC) Chairman Powell today.
According to the technical indicators, the Ichimoku indicator shows that the price has again dipped below the Kumo cloud level. Although this indicates that the price has lost short-term momentum, the intersections between tenkan and kijun are still positive, indicating that the uptrend is not completely over. However, Chaikin Money Flow (CMF) data shows that liquidity outflows have increased, and capital inflows have decreased. Looking at the data in the derivatives markets, it is noteworthy that there has been a significant amount of position closures at Open Interest (OI) levels in recent hours, indicating that investors are closing their positions or making profit realizations by avoiding risk in an uncertain environment. Cumulative Volume Delta (CVD) reveals that spot buying remained weak, while selling pressure was more dominant in futures. Although this sales-weighted structure in the futures market indicates that the short-term downward pressure may continue, the possibility of a recovery towards the $ 2,700 level remains on the table if the $ 2,641 support is maintained.
While Ethereum price action is volatile in the short term, maintaining the $2,641 level is critical for the continuation of upward movements. If this support level is not broken, it may be possible for the price to rise above $2,700 again. However, if it sags below this level, the possibility of deepening selling pressure and a retreat towards the $2,600 level will increase.
Supports 2,641 – 2,501 – 2,368
Resistances 2,781 – 2,881 – 2,992
XRP/USDT
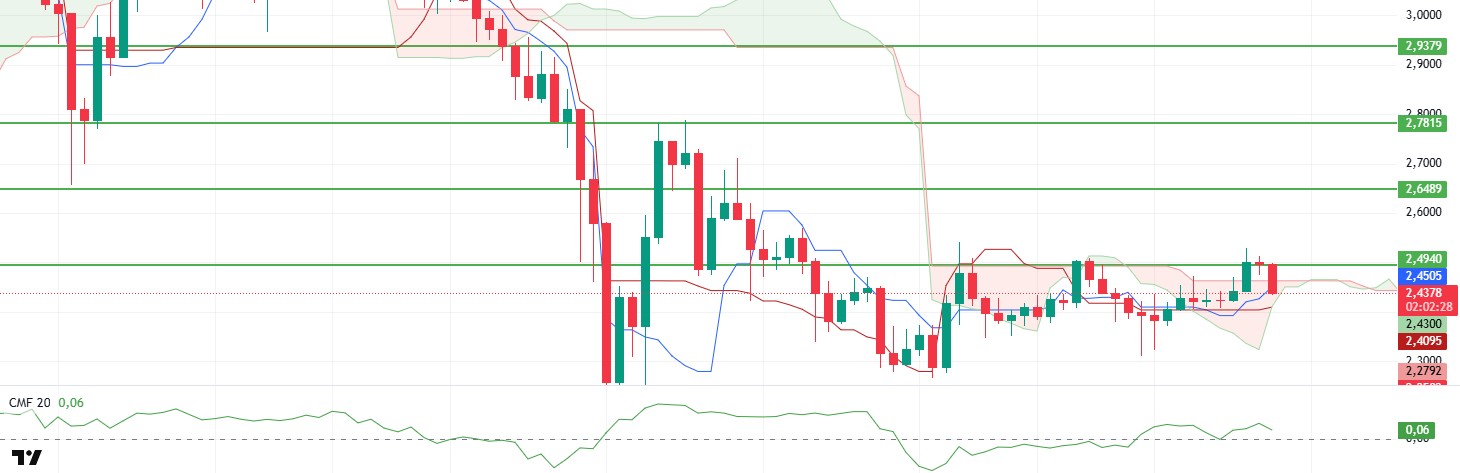
Although XRP managed to break through the important resistance zone at the $ 2.49 level during the day, it could not maintain this level and retreated again and experienced a decline to the upper support of the Kumo cloud.
Analysing the technical indicators, the Chaikin Money Flow (CMF) metric is showing a pullback, indicating that liquidity outflows from the market are increasing. However, according to the Ichimoku indicator, the price is still holding the upper support of the Kumo cloud and the tenkan level remains above the kijun level, indicating that the structure maintains its positive outlook. This can be considered as an important indicator that the current pullback may remain limited and the price’s recovery potential continues. In this context, a renewed loss of the $2.49 level could be considered as a short-term signal of weakness and could cause the price to enter a slight downtrend. However, as technical indicators show that the efforts to hold above this level continue, it is possible that upward movements may accelerate if the price breaks the $2.49 level again. On the other hand, if the price breaks the $2.25 level, this could be perceived as a clearer turn signal in the market structure and pave the way for sharp pullbacks.
As a result, although XRP price movements exhibit a volatile outlook in the short term, technical indicators suggest that staying above the $2.49 level supports bullish potential.
Supports 2.4940 – 2.2502 – 2.0201
Resistances 2.6489 – 2.7815 – 2.9379
SOL/USDT
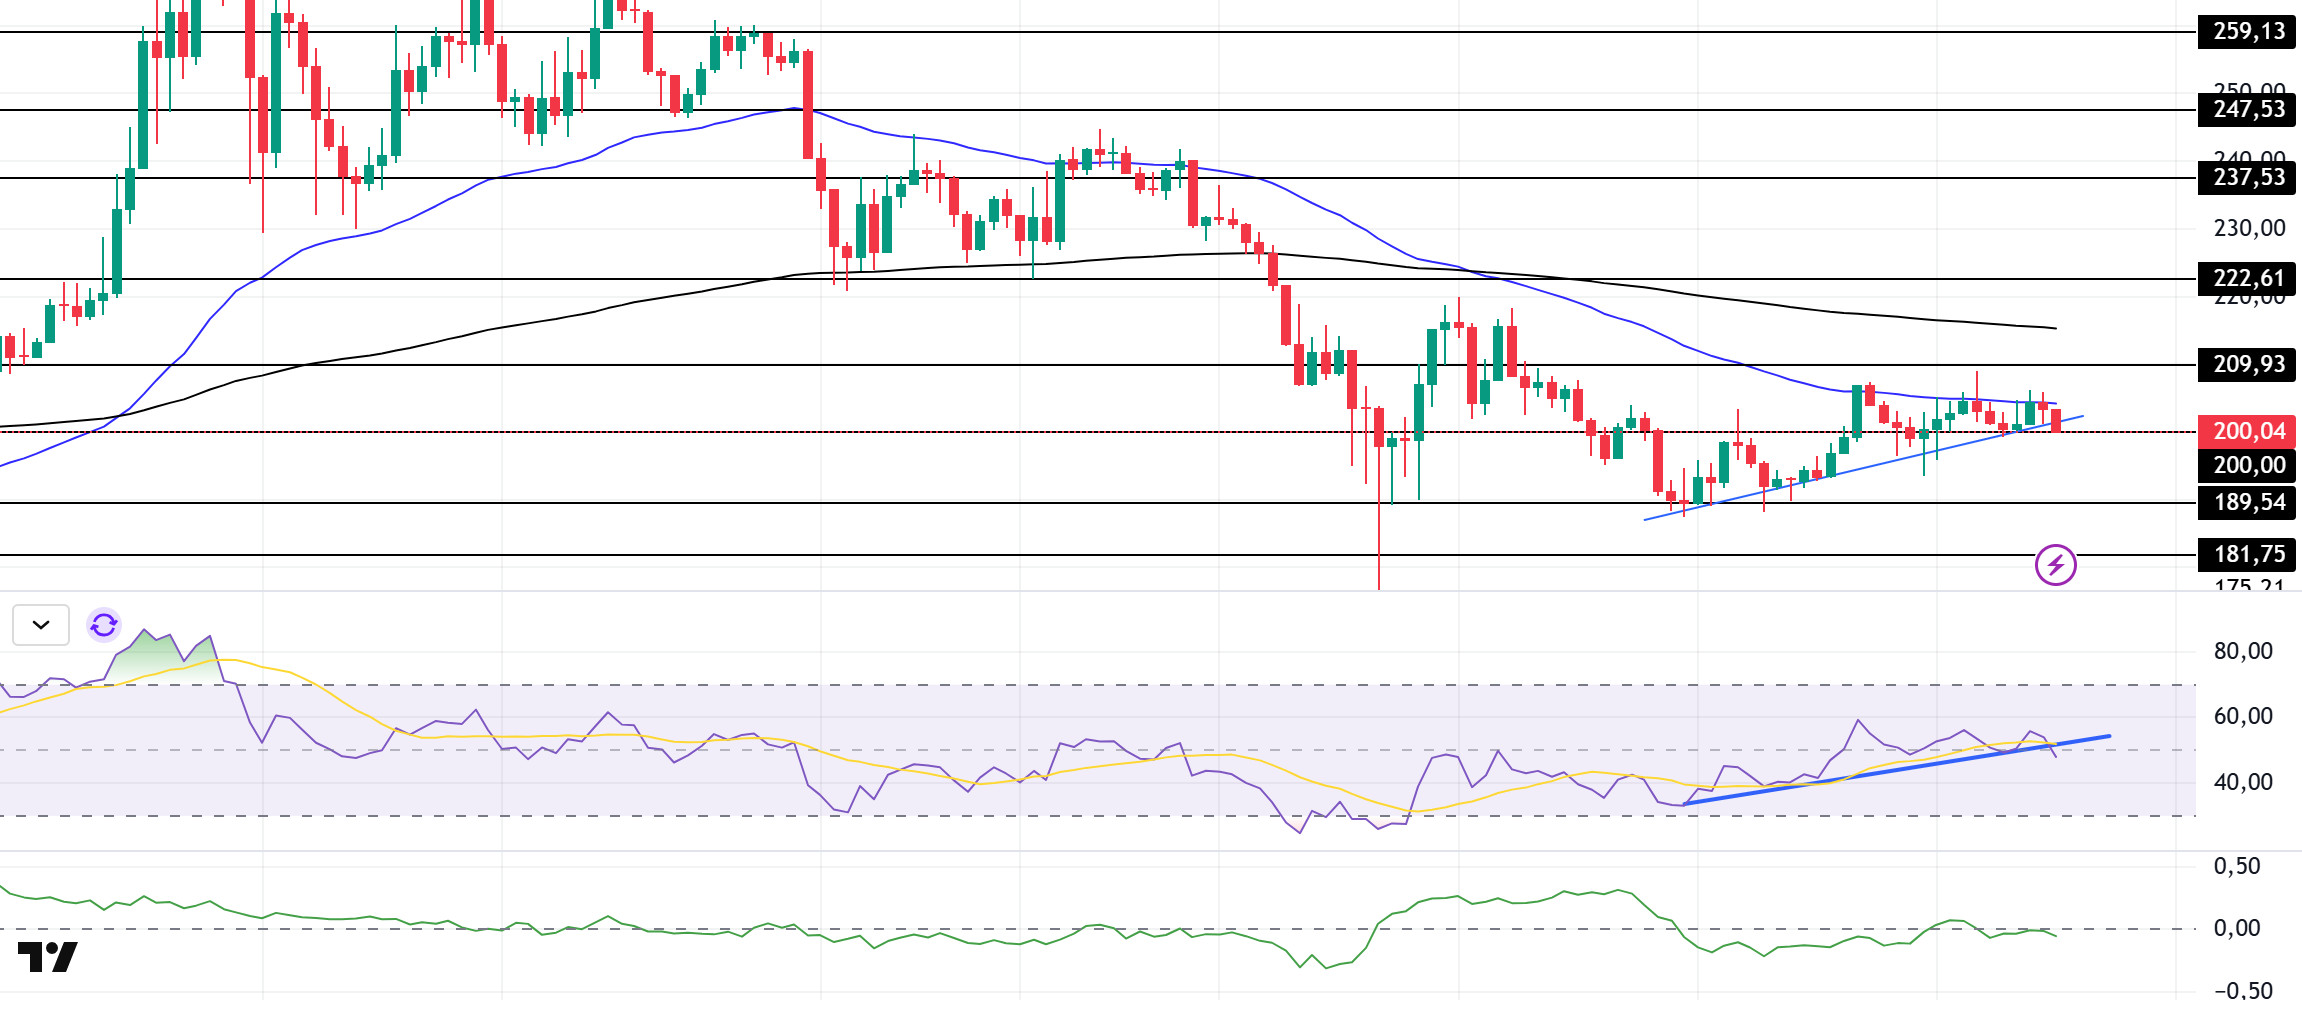
SOL has exhibited slight declines since our analysis in the morning. On the 4-hour timeframe, the 50 EMA (Blue Line) continues to be below the 200 EMA (Black Line). This could deepen the decline in the medium term. At the same time, the asset is priced below the 50 EMA and 200 EMA. On February 6, the uptrend that started to form continues and the asset is trying to orient itself between this uptrend and the 50 EMA. When we examine the Chaikin Money Flow (CMF)20 indicator, it is in the neutral zone but inflows have decreased. However, the Relative Strength Index (RSI)14 indicator is at the mid-level of the positive zone and the price is currently testing the support level of the uptrend that started on February 6. The $ 237.53 level stands out as a very strong resistance point in the rises driven by both the upcoming macroeconomic data and the news in the Solana ecosystem. If it breaks here, the rise may continue. In case of retracements for the opposite reasons or due to profit sales, the support level of $ 181.75 can be triggered again. If the price comes to these support levels, a potential bullish opportunity may arise if momentum increases.
Supports 200.00 – 189.54 – 181.75
Resistances 209.93 – 222.61 – 237.53
DOGE/USDT
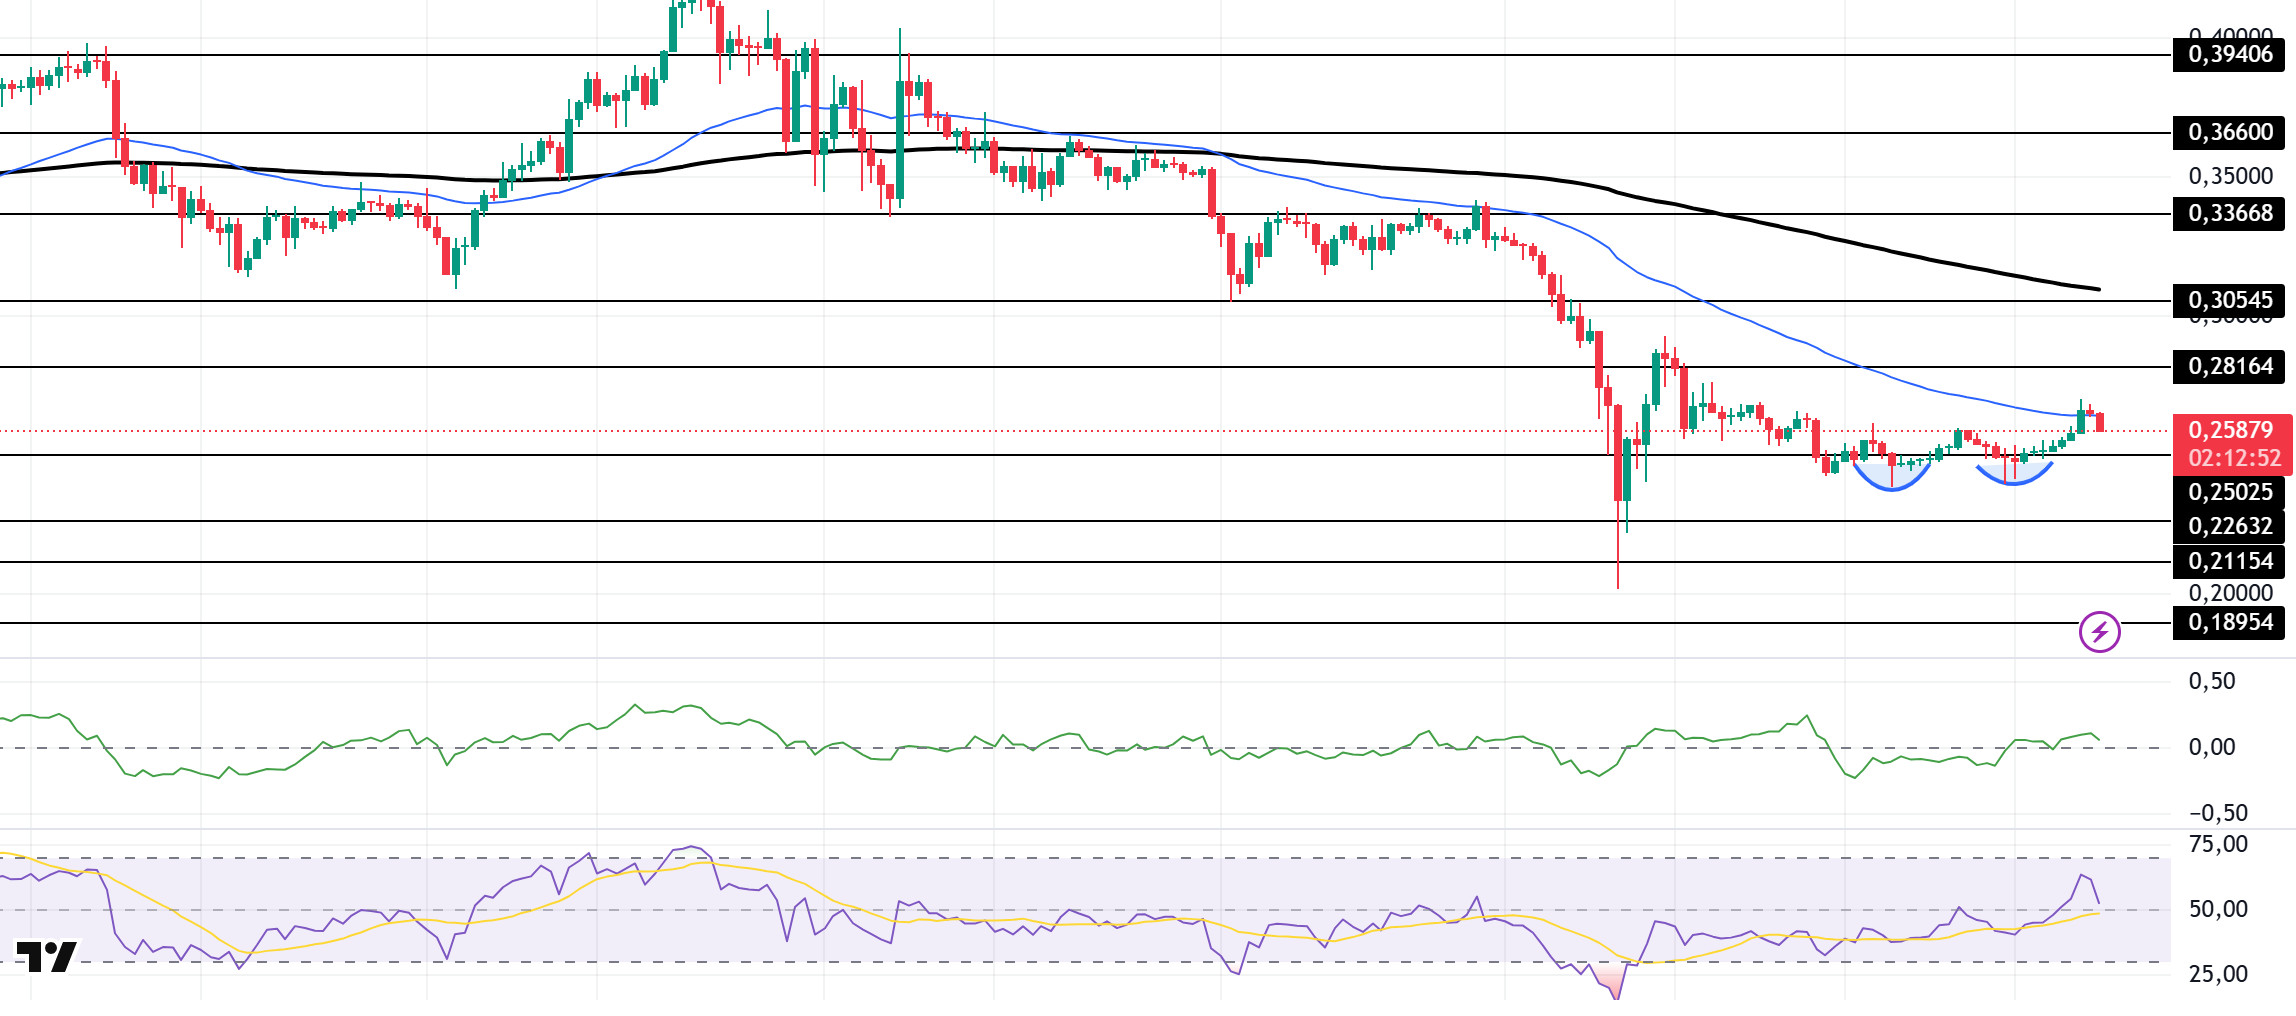
DOGE has been bearish since our analysis in the morning. On the 4-hour timeframe, the 50 EMA (Blue Line) remained below the 200 EMA (Black Line). This could mean that the decline could deepen further in the medium term. At the same time, the price is below the 50 EMA (Blue Line) and the 200 EMA (Black Line). However, the large gap between the two moving averages may increase the probability of the DOGE rising. It is also testing the 50 EMA as of the time of writing. The double bottom formation may be a bullish harbinger. When we examine the Chaikin Money Flow (CMF)20 indicator, it is in positive territory but money inflows have decreased. At the same time, Relative Strength Index (RSI)14 is near the middle of the positive zone. The level of 0.33668 dollars appears as a very strong resistance place in the rises due to political reasons, macroeconomic data and innovations in the DOGE coin. In case of possible pullbacks due to political, macroeconomic reasons or negativities in the ecosystem, the base level of the trend, the $ 0.22632 level, is an important support. If the price reaches these support levels, a potential bullish opportunity may arise if momentum increases.
Supports 0.25025 – 0.22632 – 0.21154
Resistances 0.28164 – 0.30545 – 0.33668
LEGAL NOTICE
The investment information, comments and recommendations contained herein do not constitute investment advice. Investment advisory services are provided individually by authorized institutions taking into account the risk and return preferences of individuals. The comments and recommendations contained herein are of a general nature. These recommendations may not be suitable for your financial situation and risk and return preferences. Therefore, making an investment decision based solely on the information contained herein may not produce results in line with your expectations.
