
MARKET SUMMARY
Latest Situation in Crypto Assets
| Assets | Last Price | 24h Change | Dominance | Market Cap. |
|---|---|---|---|---|
| BTC | 96,135.82 | 1.43% | 59.96% | 1,90 T |
| ETH | 2,661.94 | 2.78% | 10.09% | 320,35 B |
| XRP | 2.450 | 2.83% | 4.44% | 141,25 B |
| SOLANA | 190.97 | -0.44% | 2.93% | 93,07 B |
| DOGE | 0.2573 | 2.11% | 1.20% | 38,05 B |
| CARDANO | 0.7835 | 1.66% | 0.87% | 27,54 B |
| TRX | 0.2367 | -1.67% | 0.64% | 20,38 B |
| LINK | 18.52 | 2.46% | 0.37% | 11,82 B |
*Prepared on 2.13.2025 at 14:00 (UTC)
WHAT’S LEFT BEHIND
In the US, Producer Price Index (PPI) was announced.
Announced: 3.5% Expected: 3.2% Previous: 3.3
US Applications for Unemployment Benefits released
Announced:213K Expectation: 217K Previous:219K
Trump: Big news on reciprocal tariffs coming
US President Donald Trump announced today that he will announce a major development regarding reciprocal tariffs. While this announcement on global trade policies creates uncertainty in the markets, its effects on international trade and economy are closely monitored.
Tether May Have to Sell Bitcoin to Comply with US Regulations
According to JPMorgan analysts, only 66% to 83% of Tether’s reserves comply with proposed stablecoin regulations in the US. If the new regulations are adopted, Tether may need to sell Bitcoin and other non-compliant assets and turn to US Treasury bonds and liquid reserves.
Taurus Expands Digital Asset Custody and Tokenization Services to Solana
Deutsche Bank-backed infrastructure provider Taurus announced that it has expanded its digital asset custody and tokenization services to the Solana blockchain. This step could accelerate Solana’s growth and adoption in the tokenization space.
Circle’s USDC Market Cap Breaks Record, Tops $56 Billion
Activity in the stablecoin market continues. Circle’s USDC supply surpassed $56 billion, reaching a new record. According to Artemis data, USDC has grown by $10 billion in recent months, while Tether’s USDT supply has increased by $4.2 billion.
Ethereum Foundation Distributes 45,000 ETH to Spark and Other Protocols
The Ethereum Foundation announced that it invested a total of 45,000 ETH in Spark, Aave and Compound protocols. The distribution is as follows:
Spark: 10,000 ETH
Aave Prime: 10,000 ETH
Aave Core: 20,800 ETH
Compound: 4,200 ETH
It was reported that the foundation plans to explore Ethereum staking options in the future.
HIGHLIGHTS OF THE DAY
Important Economic Calender Data
| Time | News | Expectation | Previous |
|---|---|---|---|
| Tentative | President Trump Speaks |
INFORMATION
*The calendar is based on UTC (Coordinated Universal Time) time zone.
The economic calendar content on the relevant page is obtained from reliable news and data providers. The news in the economic calendar content, the date and time of the announcement of the news, possible changes in the previous, expectations and announced figures are made by the data provider institutions. Darkex cannot be held responsible for possible changes that may arise from similar situations
MARKET COMPASS
In global markets, the US agenda continues to determine asset prices. After yesterday’s Consumer Price Index data, today we saw the January Producer Price Index figures for the world’s largest economy. In addition to this data set, which came slightly above the forecasts, weekly jobless claims, although lower than expected, did not point to a data far from expectations. Expectations that the US Federal Reserve (FED) will not cut interest rates before its September meeting are maintained for now. On the other hand, President Trump is expected to hold a press conference on the latest executive orders at the White House today.
Wall Street futures are slightly positive and outside the UK, the European session is also green. The fact that peace in Ukraine is on the horizon was an important dynamic that contributed to the positive mood. Still, Trump’s expected speech, which can be categorized under the heading of “trade wars”, will be important. We maintain our expectation for digital assets to be volatile in the short term, pressured in the medium term and bullish in the long term.
From the short term to the big picture.
Trump’s victory on November 5, one of the main pillars of our bullish expectation for the long-term outlook in digital assets, produced a result in line with our predictions. In the process that followed, the appointments made by the president-elect and the increasing regulatory expectations for the crypto ecosystem in the US, as well as the emergence of BTC as a reserve, continued to take place in our equation as positive variables. Then, 4 days after the new President took over the White House, he signed the “Cryptocurrency Working Unit” decree, which was among his election promises, and we think that the positive reflection of the outputs it will produce in the coming days on digital assets may continue.
On the other hand, the expectations that the FED will continue its interest rate cut cycle, albeit on hiatus for now, and the fact that the volume in crypto-asset ETFs indicates an increase in institutional investor interest, support our upside forecast for the big picture. In the short term, given the nature of the market and pricing behavior, we think it would not be surprising to see occasional pause or pullbacks in digital assets. However, at this point, it is worth underlining again that we think the fundamental dynamics continue to be bullish.
TECHNICAL ANALYSIS
BTC/USDT
Important developments in macroeconomic and crypto markets continued to unfold. In the US, the Producer Price Index (PPI) came in at 3.5%, above expectations (3.2%), while unemployment benefit claims came in below expectations at 213K. These data suggest that the labor market remains relatively strong and inflationary pressures persist. On the other hand, Trump is expected to make a major announcement on reciprocal tariffs. On the crypto side, JPMorgan analysts suggested that Tether may be forced to sell Bitcoin and other non-compliant assets due to new regulations.
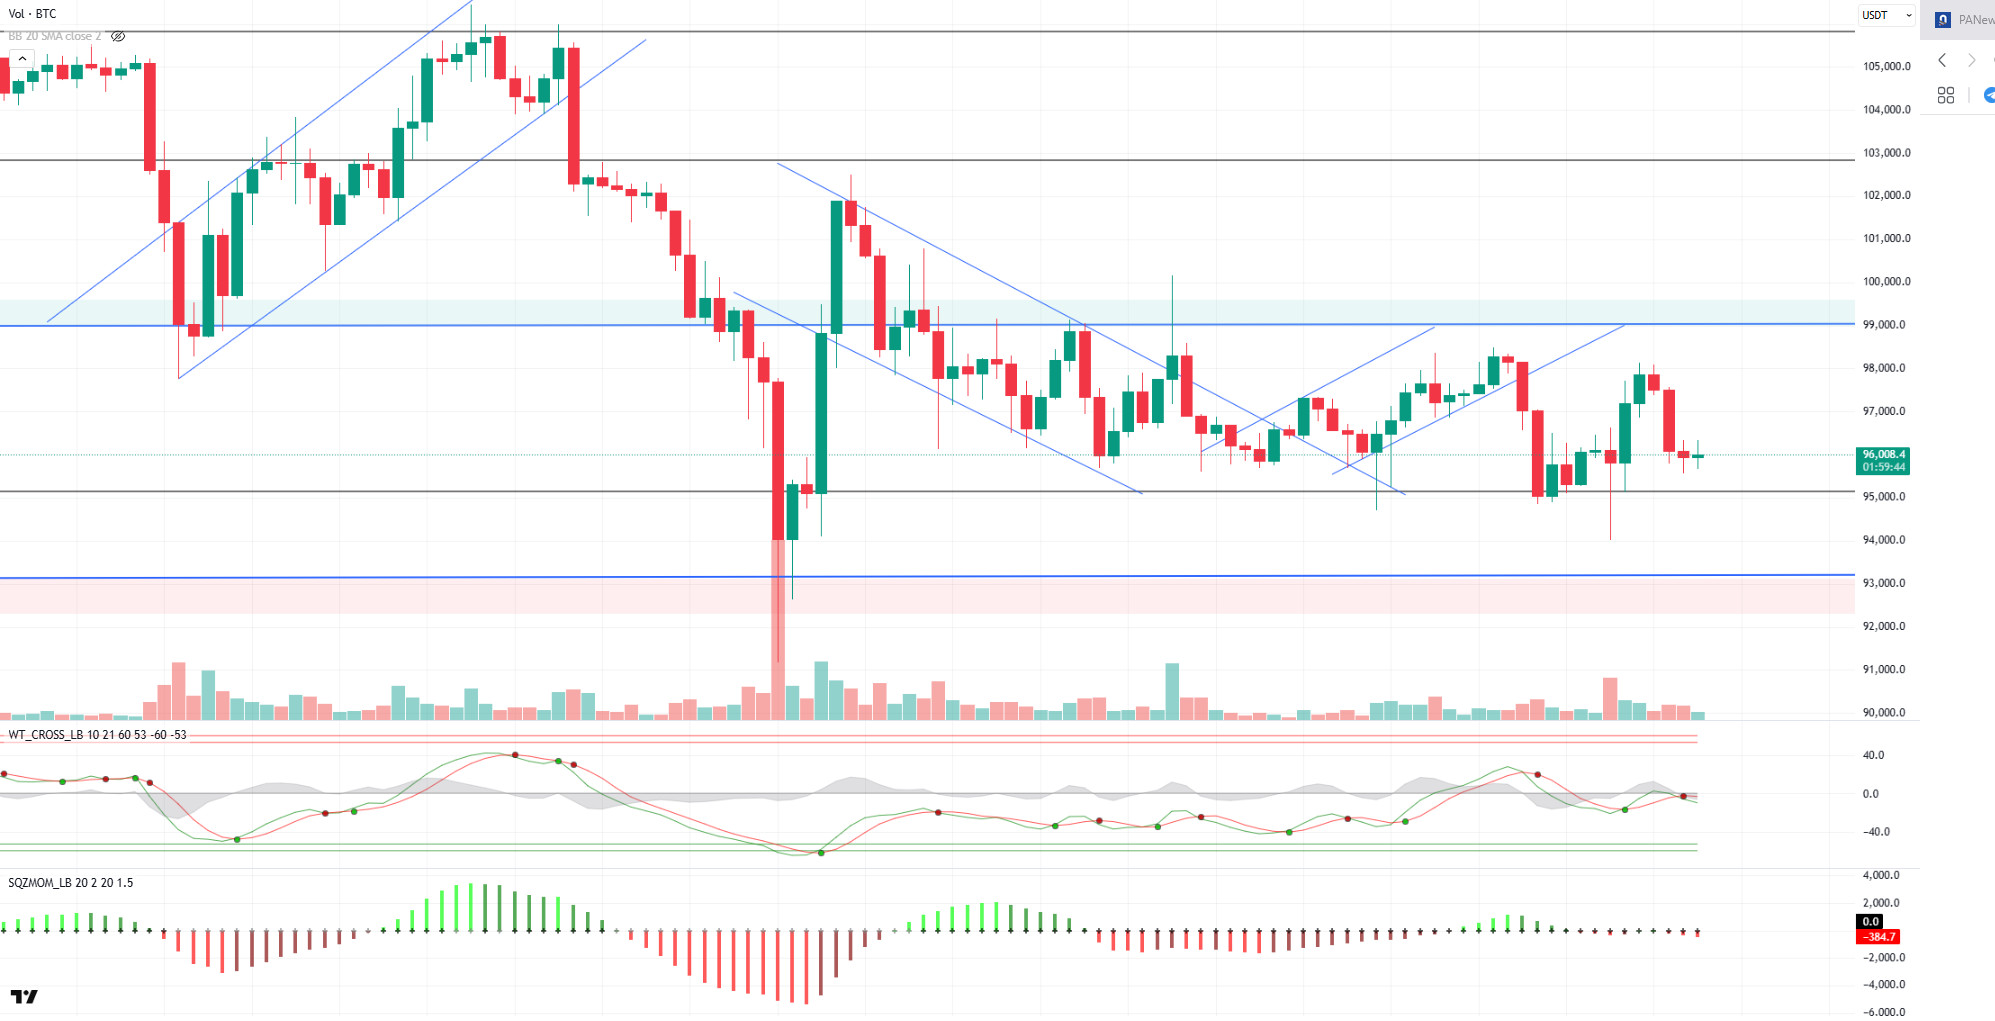
BTC, which retreated to 94,000 after yesterday’s data, managed to recover and attempted to start a minor uptrend again. While the 95,000 level continues to serve as a reference point as a support point, the price deviates from the resistance points above this level, indicating that BTC is in a respite phase. Currently trading at 96,000, BTC’s price movements are neutral. When technical oscillators are analyzed, it is observed that sell signals continue to be maintained on the 4-hour charts, and momentum indicators have moved back into negative territory. In order for the uptrend to regain strength, closes above 97,000 will be followed as a critical threshold. On the other hand, in case of a possible pullback, closes above the 95,000-support level will be an important indicator in the price’s search for balance.
Supports 95,000 – 92,800 – 90,400
Resistances 97,000 – 99,100 -101,400
ETH/USDT
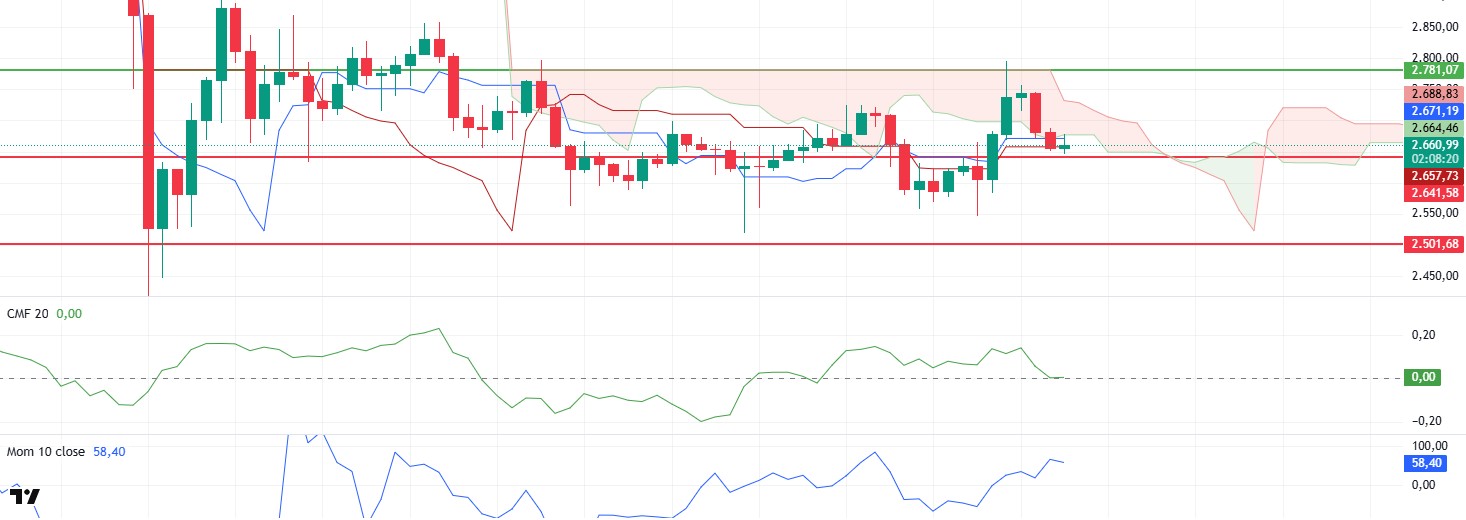
ETH retreated to the $2,641 support level, facing strong selling pressure at the $2,781 level after a rally last night. ETH, which has found slight support in this region, still continues to give positive signals in terms of technical indicators.
First of all, despite the pullback, momentum indicators seem to have maintained their uptrend. This suggests that despite the price pullback, buyers have not completely withdrawn from the market and the upward momentum may still be valid. The Chaikin Money Flow (CMF) indicator, on the other hand, has retreated to the zero line, but a positive divergence is seen here. The fact that CMF has not dipped below the zero line suggests that buyers may still be in play at certain levels. However, in terms of the Ichimoku indicator, the price dipping below both the kumo cloud and the tenkan level creates a negative outlook. The fact that the price remains below the cloud suggests that the market may be under pressure in the short term and upward movements may remain limited.
In the current situation, if ETH holds the $2,641 intermediate support level, a bullish movement up to the $2,781 level can be observed again. However, the loss of this support level may cause the price to retreat to the strong support zone in the range of $2,586 – $2,500. In particular, the $2,500 level stands out as a critical support point in the wider time frame, and a fall below this level could lead to deeper selling pressure.
Supports 2,501 – 2,368 – 2,127
Resistances 2,641 – 2,781 – 2,881
XRP/USDT
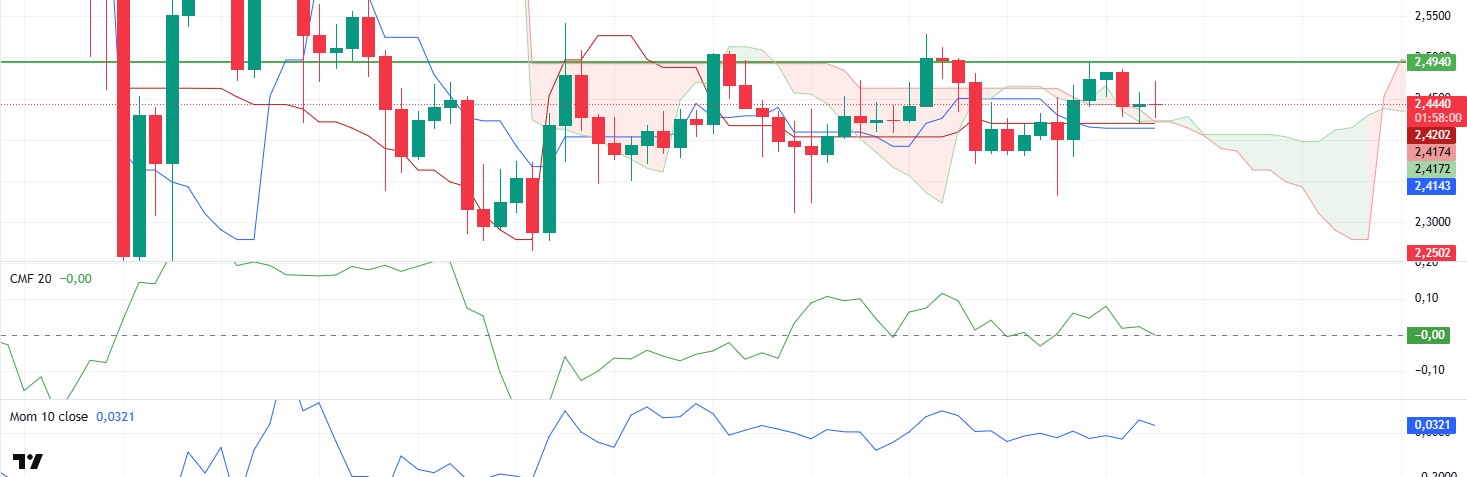
XRP remained relatively strong, holding the $2.45 level despite the overall decline in the crypto market after yesterday’s rally.
With this price action, no clear changes were seen in the indicators. The Chaikin Money Flow (CMF) indicator continues to decline, indicating that liquidity is being withdrawn, while momentum continues to move sideways. The fact that the price remains above the kumo cloud and kijun level can be seen as one of the positive factors in the short term.
In summary, provided that the price stays on the kumo cloud, it seems likely to continue to rise by exceeding the $ 2.49 level in the evening. However, closures below this level may cause slight retracements again.
Supports 2.2502 – 2.0201 – 1.6309
Resistances 2.4940 – 2.6486 – 2.7815
SOL/USDT
According to Block Beats, a Solana whale transferred 111,600 SOLs worth $22.01 million to a centralized exchange in the last three days. On the other hand, Solana validators will now receive 100% of the priority fees instead of 50% under the new model. Under the previous fee distribution model, Solana validators received only 50% of the network’s priority fees, while the remaining 50% was burned. Taurus launches Solana-based custody and tokenization platform for banks. Deutsche Bank-backed Taurus has launched a Solana-based custody and tokenization platform that allows banks to issue and manage digital assets.
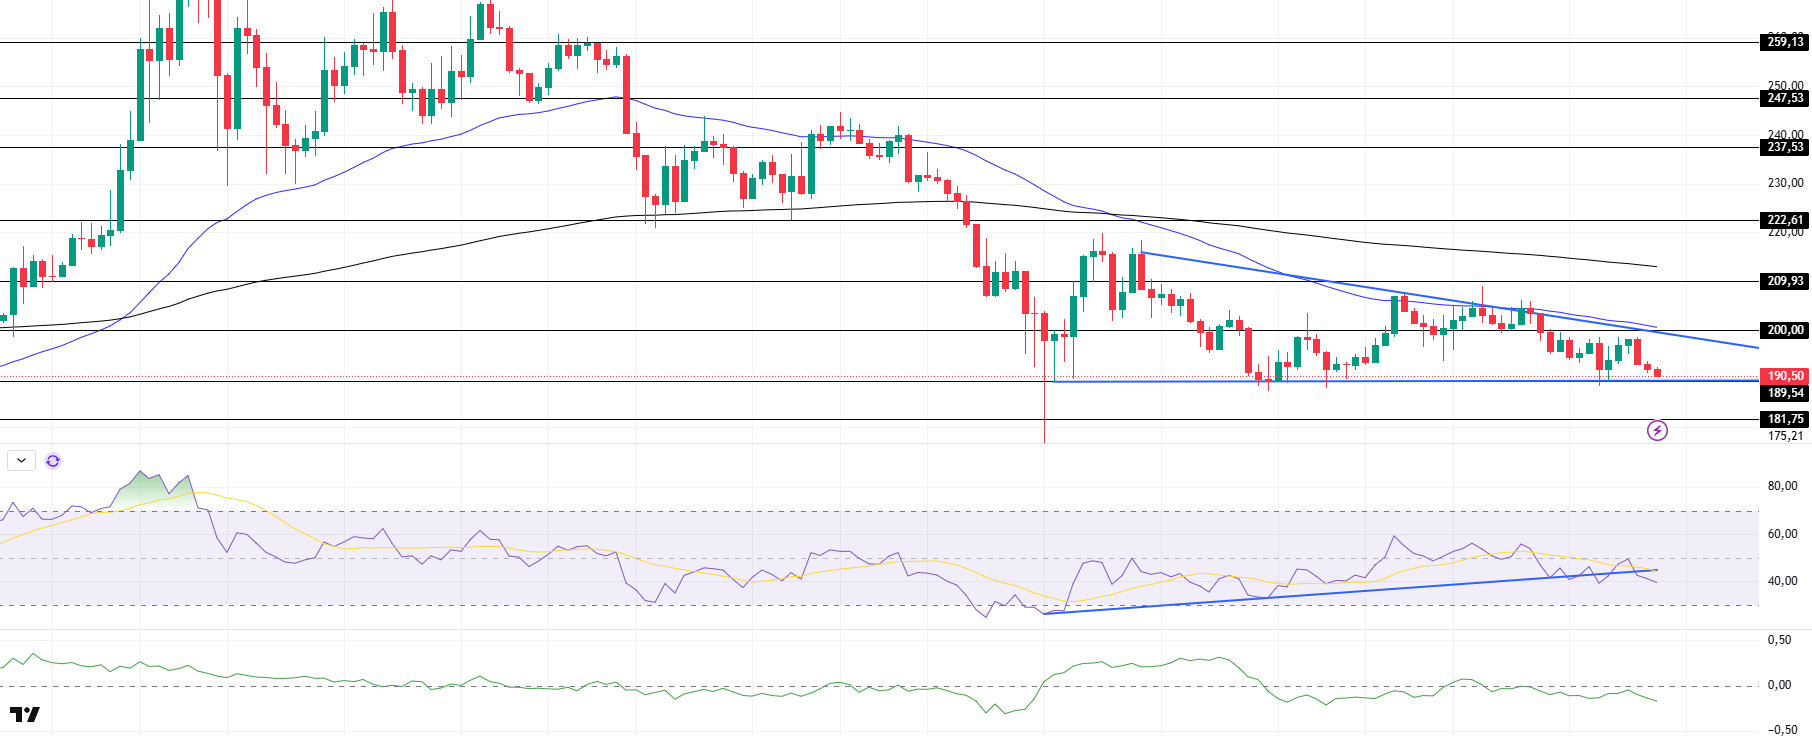
SOL continues to accumulate inside the falling triangle pattern. On the 4-hour timeframe, the 50 EMA (Blue Line) continues to be below the 200 EMA (Black Line). This could deepen the decline in the medium term. At the same time, the asset is priced below the 50 EMA and 200 EMA. The asset, which continues to move in a narrow band, continues to be in a falling triangle pattern. When we examine the Chaikin Money Flow (CMF)20 indicator, it is close to the neutral level of the negative zone. However, the Relative Strength Index (RSI)14 indicator is at the mid-level of the negative zone and the RSI has broken the downward uptrend that started on February 3. This may deepen the decline. The $200.00 level stands out as a very strong resistance point in the rises driven by both the upcoming macroeconomic data and the news in the Solana ecosystem. If it breaks here, the rise may continue. In case of retracements for the opposite reasons or due to profit sales, the support level of $ 181.75 can be triggered again. If the price reaches these support levels, a potential bullish opportunity may arise if momentum increases.
Supports 189.54 – 181.75 – 171.82
Resistances 200.00 – 209.93 – 222.61
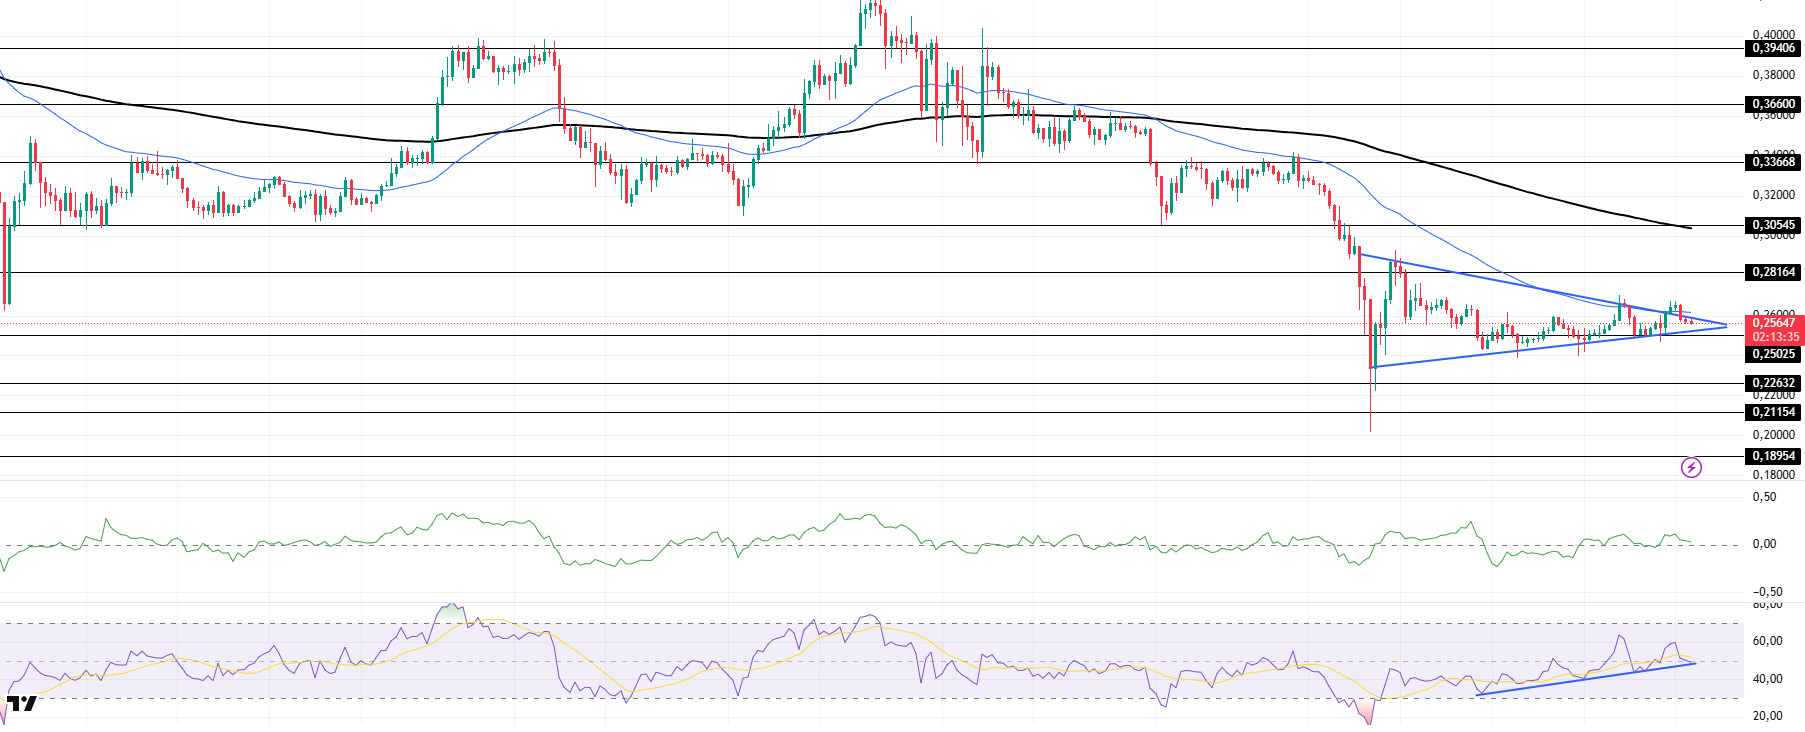
DOGE/USDT
Since our analysis in the morning, DOGE encountered resistance at the top of the symmetrical triangle pattern, but broke through it, only to find resistance at the 50 EMA (Blue Line) and lost strength to re-enter the triangle. On the 4-hour timeframe, the 50 EMA (Blue Line) remains below the 200 EMA (Black Line). This could mean that the decline could deepen further in the medium term. At the same time, the price is hovering between the 50 EMA (Blue Line) and the 200 EMA (Black Line). However, the large gap between the two moving averages may increase the probability of DOGE rising. The Chaikin Money Flow (CMF)20 indicator is in positive territory and money inflows have started to decline. At the same time, Relative Strength Index (RSI)14 is near the neutral level of the negative zone and is currently testing the uptrend that started on February 6 as support. The $0.33668 level stands out as a very strong resistance in the uptrend due to political reasons, macroeconomic data and innovations in the DOGE coin. In case of possible pullbacks due to political, macroeconomic reasons or negativities in the ecosystem, the base level of the trend, the $ 0.22632 level, is an important support. If the price reaches these support levels, a potential bullish opportunity may arise if momentum increases.
Supports 0.25025 – 0.22632 – 0.21154
Resistances 0.28164 – 0.30545 – 0.33668
LEGAL NOTICE
The investment information, comments and recommendations contained herein do not constitute investment advice. Investment advisory services are provided individually by authorized institutions taking into account the risk and return preferences of individuals. The comments and recommendations contained herein are of a general nature. These recommendations may not be suitable for your financial situation and risk and return preferences. Therefore, making an investment decision based solely on the information contained herein may not produce results in line with your expectations.

