
MARKET SUMMARY
Latest Situation in Crypto Assets
| Assets | Last Price | 24h Change | Dominance | Market Cap. |
|---|---|---|---|---|
| BTC | 96,821.38 | 0.73% | 59.61% | 1,92 T |
| ETH | 2,702.40 | 1.51% | 10.11% | 325,88 B |
| XRP | 2.724 | 11.11% | 4.89% | 157,62 B |
| SOLANA | 198.96 | 3.57% | 3.00% | 96,76 B |
| DOGE | 0.2702 | 5.13% | 1.24% | 40,06 B |
| CARDANO | 0.8070 | 3.11% | 0.88% | 28,43 B |
| TRX | 0.2313 | -2.19% | 0.62% | 19,93 B |
| LINK | 19.25 | 4.10% | 0.38% | 12,29 B |
*Prepared on 2.14.2025 at 14:00 (UTC)
WHAT’S LEFT BEHIND
Bank of America: If PCE Inflation Exceeds 3%, Fed May Raise Rates
According to Bank of America’s February interest rate and exchange rate survey, 58% of respondents believe that the Federal Reserve may raise interest rates if US Personal Consumption Expenditures (PCE) inflation exceeds 3%. Moreover, 12% of respondents believe that market-based inflation indicators exceeding 3% could also lead to a rate hike.
FTX Issues First Round of Asset Distribution Notice, Some Creditors May Have to Wait Until Second Quarter of 2025
FTX has sent email notifications to clients who do not meet the requirements set for the asset distribution. Among the clients who will not be able to participate in the first distribution, which will take place on February 18, 2025:
- Customer requests under review
- Creditors over 50 thousand dollars
- Customers who have not completed KYC and tax processes will be included in the planned deployment in the second quarter of 2025 after completing the missing information.
Elon Musk’s doge.gov Site Carries Security Risks
Musk’s doge.gov website, which he launched to track cuts in federal spending, contains security vulnerabilities. According to Cointelegraph’s report, the database linked to the site can be edited by anyone, raising serious concerns about data reliability.
HIGHLIGHTS OF THE DAY
Important Economic Calender Data
*There is no important calendar data for the rest of the day.
INFORMATION
*The calendar is based on UTC (Coordinated Universal Time) time zone.
The economic calendar content on the relevant page is obtained from reliable news and data providers. The news in the economic calendar content, the date and time of the announcement of the news, possible changes in the previous, expectations and announced figures are made by the data provider institutions. Darkex cannot be held responsible for possible changes that may arise from similar situations
MARKET COMPASS
Tariffs and the FED agenda continue to influence asset prices. According to CME FedWatch, it is priced in that the US Federal Reserve (FED) will not make its next rate cut before September. Today’s US retail sales data for January came as a downside surprise. In the world’s largest economy, core retail sales declined by 0.4% in the corresponding period. Expectations were for an increase of *.3%. After the release of the data, the dollar lost value, while Wall Street futures also declined. Meanwhile, President Donald Trump signed a circular to review reciprocal tariffs but delayed immediate action, hinting at potential auto tariffs.
Digital assets remain flat. We maintain our expectation of flat-volatile in the short term, slightly pressured in the medium term and bullish in the long term.
From the short term to the big picture.
Trump’s victory on November 5, one of the main pillars of our bullish expectation for the long-term outlook in digital assets, produced a result in line with our predictions. In the process that followed, the appointments made by the president-elect and the increasing regulatory expectations for the crypto ecosystem in the US, as well as the emergence of BTC as a reserve, continued to take place in our equation as positive variables. Then, 4 days after the new President took over the White House, he signed the “Cryptocurrency Working Unit” decree, which was among his election promises, and we think that the positive reflection of the outputs it will produce in the coming days on digital assets may continue.
On the other hand, the expectations that the FED will continue its interest rate cut cycle, albeit on hiatus for now, and the fact that the volume in crypto-asset ETFs indicates an increase in institutional investor interest, support our upside forecast for the big picture. In the short term, given the nature of the market and pricing behavior, we think it would not be surprising to see occasional pause or pullbacks in digital assets. However, at this point, it is worth underlining again that we think the fundamental dynamics continue to be bullish.
TECHNICAL ANALYSIS
BTC/USDT
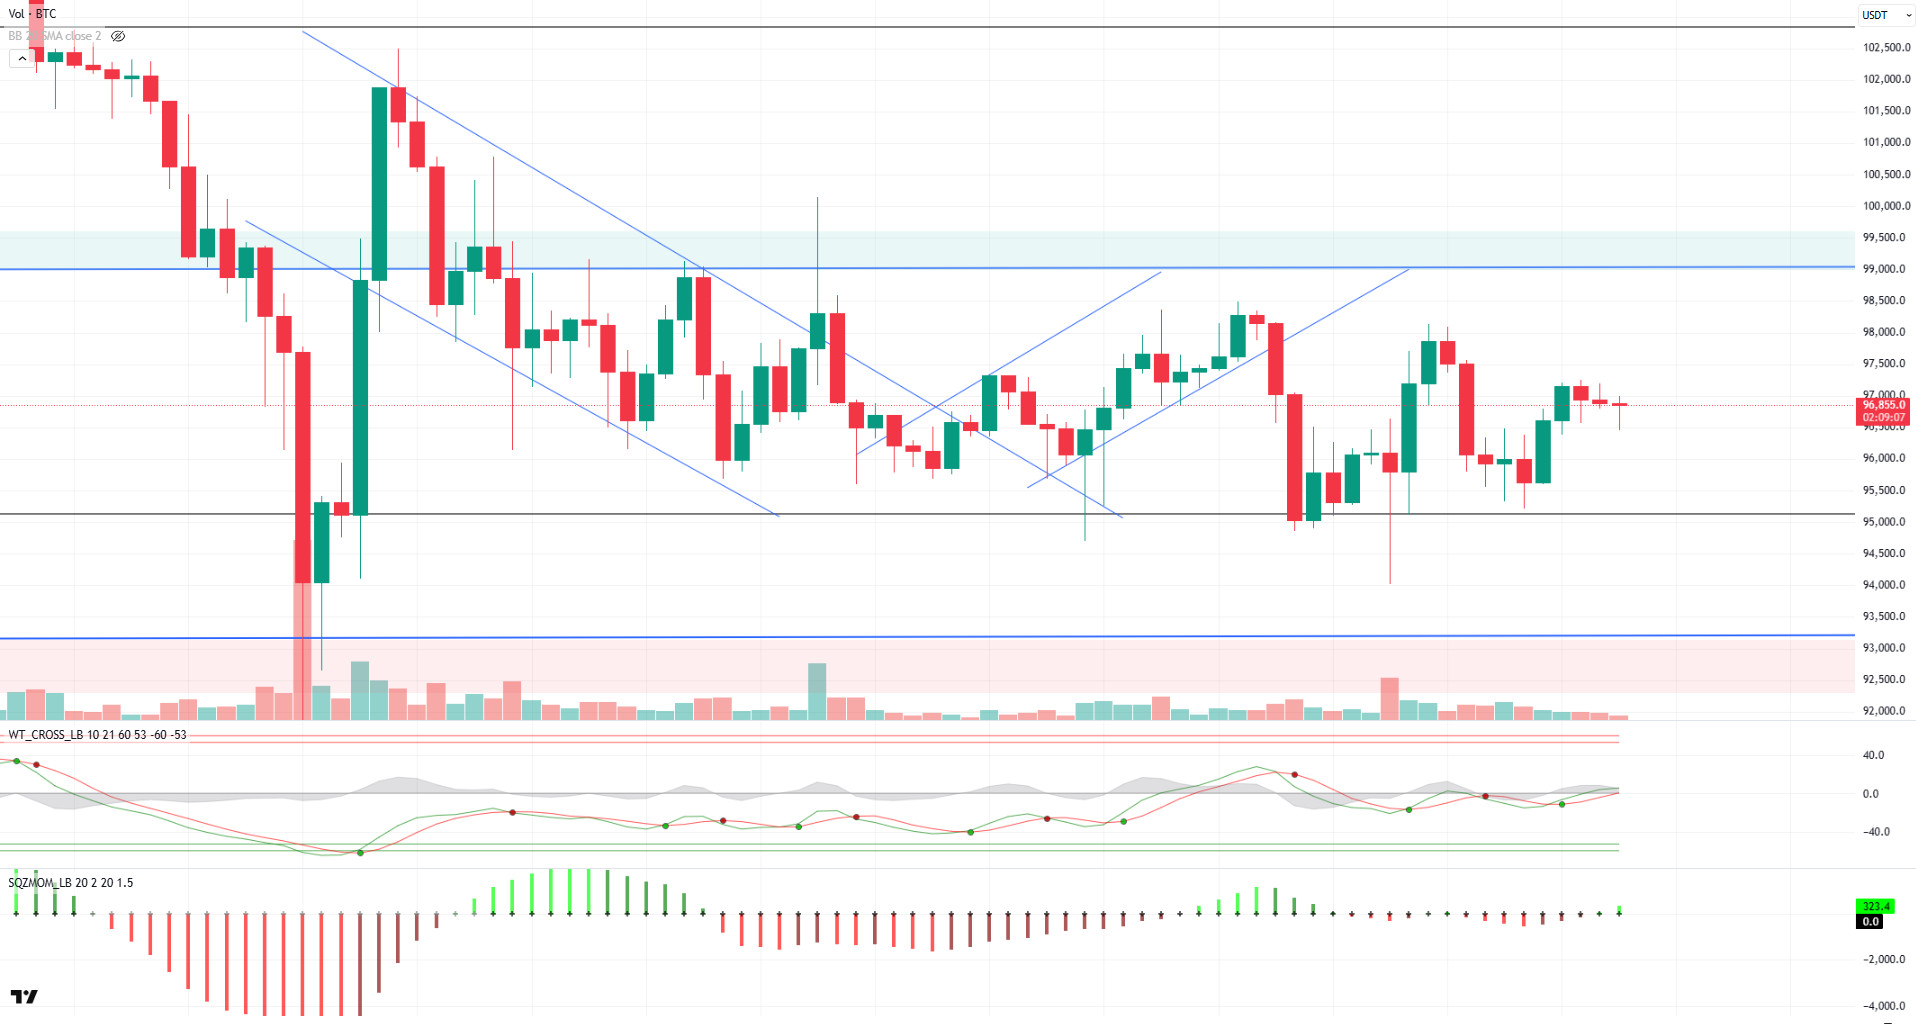
According to on-chain data, the SOPR indicator for Bitcoin is signaling a second sell signal, indicating that the market may enter a consolidation phase. After peaking at 1.03, SOPR is currently just above the 1.01 critical line. If it falls below this line, the market could enter consolidation or further price declines.
Following the on-chain data, BTC’s technical outlook remains neutral as it continues to move sideways. As in the previous analysis, BTC is currently trading at 96,800, while the price is still moving within the same range. Although technical oscillators continue to generate buy signals, momentum indicators remain weak, limiting the price’s upside movement. While macroeconomic developments and data from the US increase the uncertainty on the market, a possible development may give direction to price movements. In case the uptrend gains momentum, closes above the 97,000 level will be monitored, and in a possible pullback scenario, the 95,000 level continues to be a reference for us to stay in the positive zone.
Supports 95,000 – 92,800 – 90,400
Resistances 97,000 – 99,100 -101,400
ETH/USDT
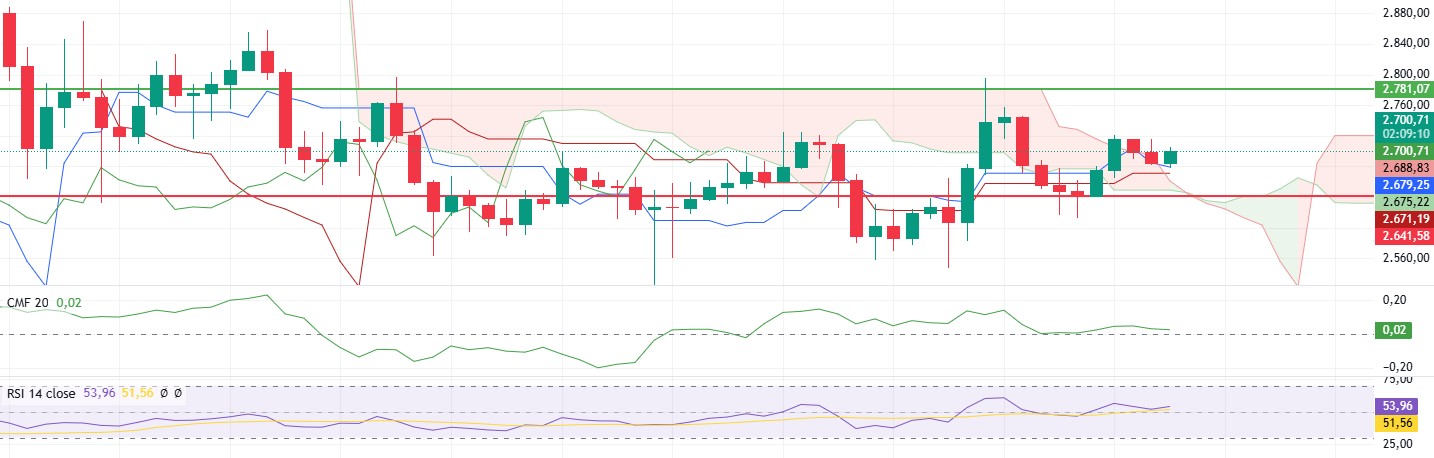
ETH, which managed to jump above the $ 2,700 level during the night hours, moved sideways during the day and maintained this level. The lack of any change in indicators during the price movement allows bullish expectations to continue.
Although there is a weakness in momentum during this movement, there is no negative signal in terms of structure. On the other hand, the Chaikin Money Flow (CMF) indicator remained in the positive area during the sideways movement, indicating that liquidity remained strong. Looking at the Ichimoku indicator, the price moving above the kumo cloud and regaining the tenkan and kijun levels is a buy signal.
In summary, rises up to $2,781 seem possible in the evening hours. A break of this level could start a positive rally. The $2.641 level, on the other hand, maintains its current support position. Violation of this level may cause a test of lower support levels.
Supports 2,641 – 2,501 – 2,368
Resistances 2,781 – 2,881 – 2,992
XRP/USDT
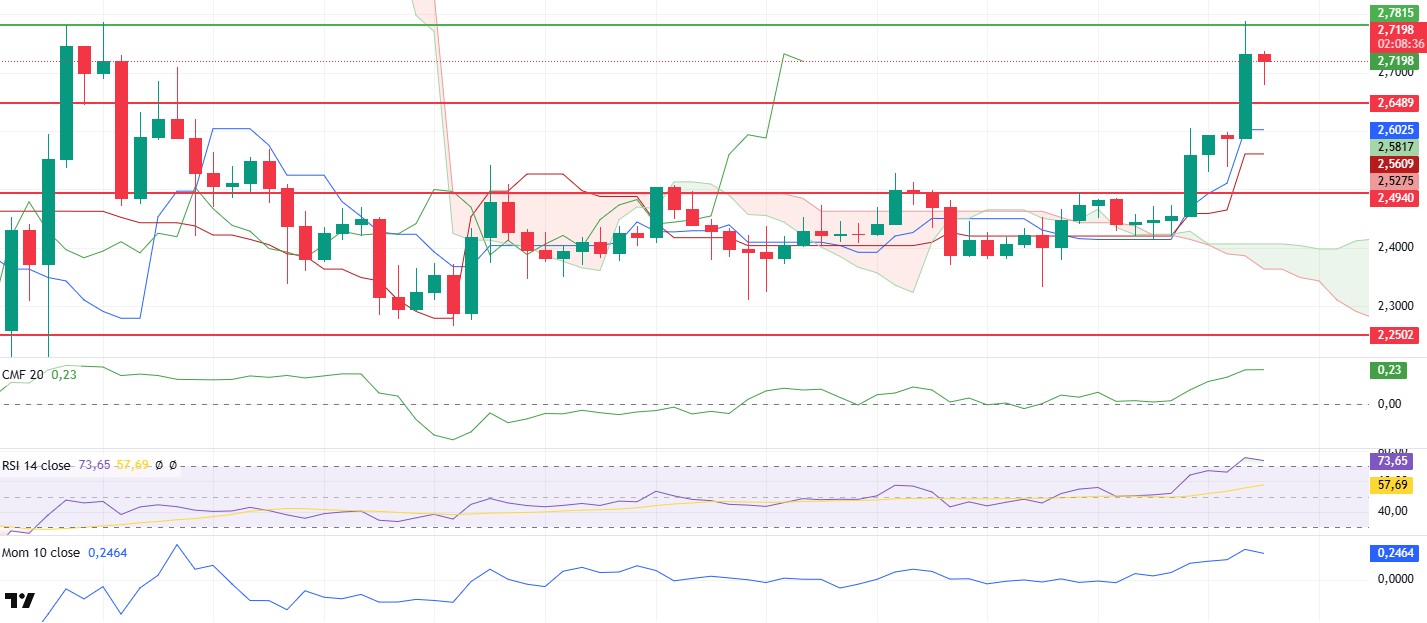
With the SEC’s acceptance of Grayscale XRP and DOGE ETFs, the XRP price, which moved with the SEC’s acceptance of Grayscale XRP and DOGE ETFs, managed to rise to the resistance of $ 2.78, exceeding the important resistance points of $ 2.49 and $ 2.64.
With this movement, indicators, which are generally horizontal, also move and offer some clues. First of all, the rise of the Relative Strength Index (RSI) indicator up to the overbought zone without any negative divergence supports the price action. However, the possibility of a small correction in this region seems strong. Chaikin Money Flow (CMF) and momentum indicators also seem to support the price action.
As a result, it can be said that the rises for XRP can continue, provided that the $ 2.64 level is not violated. However, with the break of the $ 2.64 level, there may be pullbacks to the $ 2.49 level again.
Supports 2.6489 – 2.4940 – 2.2502
Resistances 2.7815 – 2.9379 – 3.1891
SOL/USDT
Solana’s all-time inbound bridge volume since 2021 has surpassed $10.1 billion, a 114% increase compared to its total volume of $4.7 billion through February 2024. On the other hand, Doodles, one of Ethereum’s largest NFT brands, chose to launch its official token, DOOD, on the Solana network.
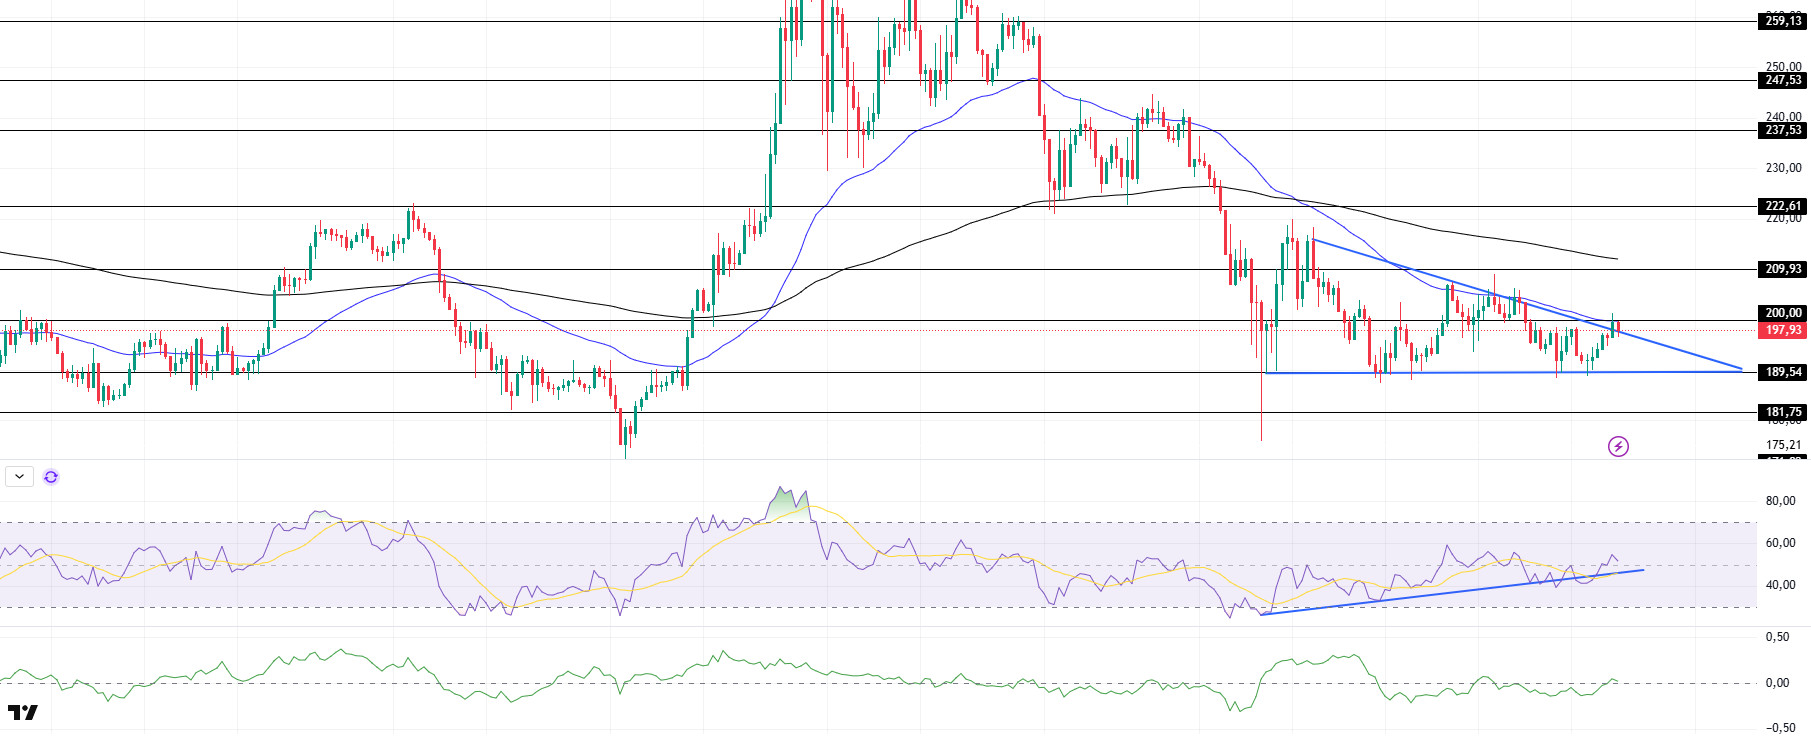
SOL broke the falling triangle pattern to the upside, but after this fake breakout, it reentered the triangle pattern. On the 4-hour timeframe, the 50 EMA (Blue Line) continues to be below the 200 EMA (Black Line). This could deepen the decline in the medium term. At the same time, the asset tested the 50 EMA as resistance and retreated from there, remaining below both moving averages. When we analyze the Chaikin Money Flow (CMF)20 indicator, it is at a neutral level. However, the Relative Strength Index (RSI)14 indicator is in the neutral zone and the uptrend in the RSI, which started on February 3, is back above the uptrend, although it has experienced a downward false break. The $200.00 level is a very strong resistance point in the uptrend driven by both the upcoming macroeconomic data and the news in the Solana ecosystem. If it breaks here, the rise may continue. In case of retracements for the opposite reasons or due to profit sales, the support level of $ 181.75 can be triggered again. If the price reaches these support levels, a potential bullish opportunity may arise if momentum increases.
Supports 189.54 – 181.75 – 171.82
Resistances 200.00 – 209.93 – 222.61
DOGE/USDT
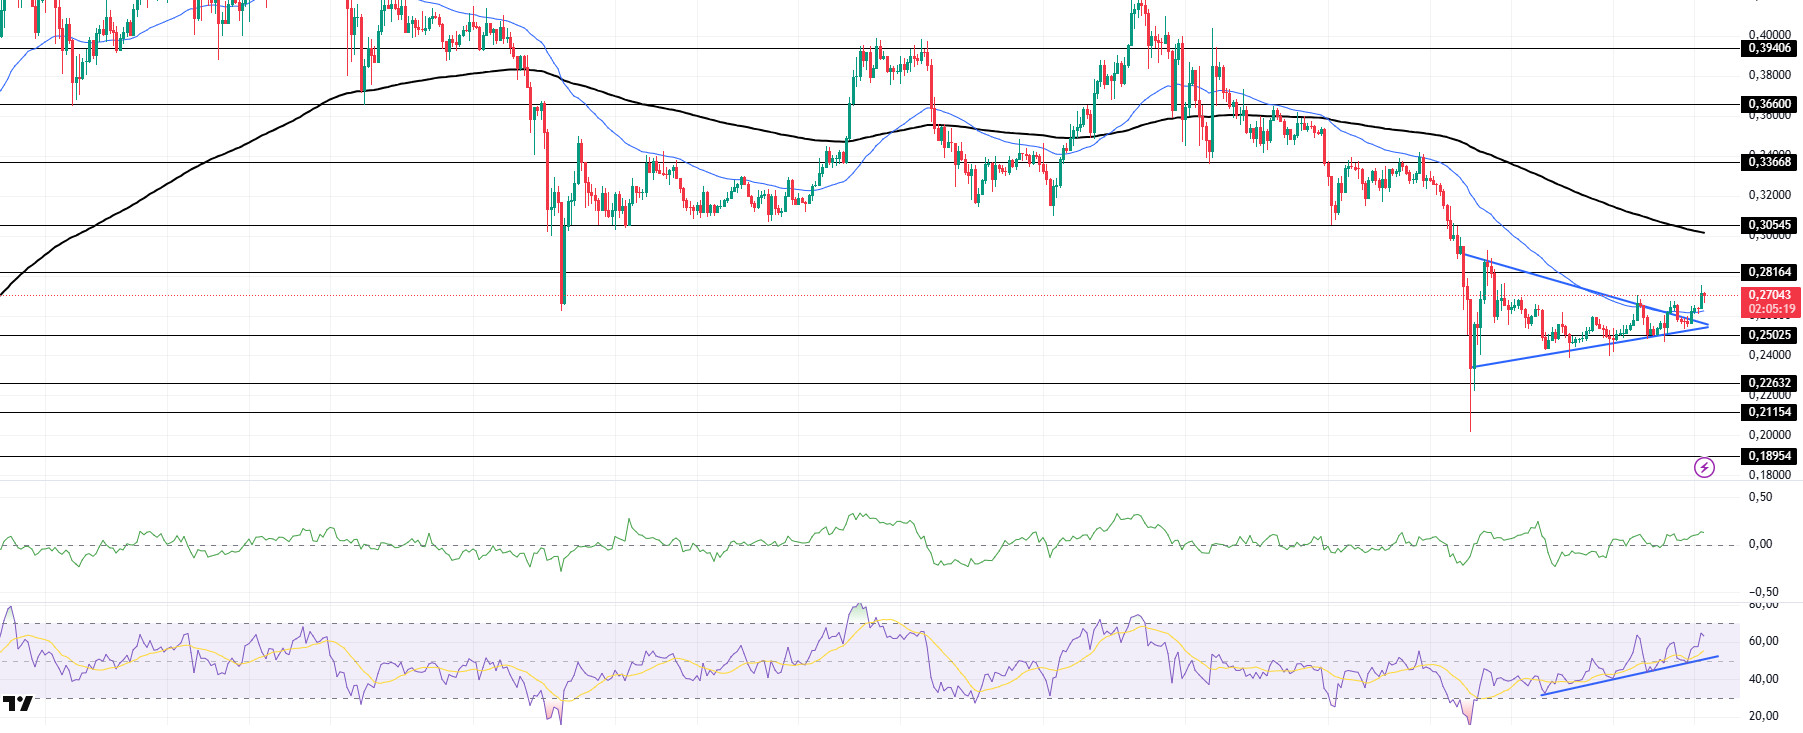
Since our analysis in the morning, DOGE encountered resistance at the top of the symmetrical triangle pattern but broke it strongly. On the 4-hour timeframe, the 50 EMA (Blue Line) remains below the 200 EMA (Black Line). This could mean that the decline could deepen further in the medium term. At the same time, the price is hovering between two moving averages with a strong upside break of the 50 EMA (Blue Line). However, the larger gap between the two moving averages could further increase the probability of DOGE moving higher. Chaikin Money Flow (CMF)20 indicator is in positive territory and inflows have started to increase. At the same time, Relative Strength Index (RSI)14 is close to the middle level of the positive zone and the uptrend that started on February 6 continues. The $0.33668 level is a very strong resistance point in the uptrend due to political reasons, macroeconomic data and innovations in the DOGE coin. In case of possible pullbacks due to political, macroeconomic reasons or negativities in the ecosystem, the base level of the trend, the $ 0.22632 level, is an important support. If the price reaches these support levels, a potential bullish opportunity may arise if momentum increases.
Supports 0.25025 – 0.22632 – 0.21154
Resistances 0.28164 – 0.30545 – 0.33668
LEGAL NOTICE
The investment information, comments and recommendations contained herein do not constitute investment advice. Investment advisory services are provided individually by authorized institutions taking into account the risk and return preferences of individuals. The comments and recommendations contained herein are of a general nature. These recommendations may not be suitable for your financial situation and risk and return preferences. Therefore, making an investment decision based solely on the information contained herein may not produce results in line with your expectations.
