
MARKET SUMMARY
Latest Situation in Crypto Assets
| Assets | Last Price | 24h Change | Dominance | Market Cap. |
|---|---|---|---|---|
| BTC | 94,908.20 | -3.80% | 60.75% | 1,88 T |
| ETH | 2,566.53 | -16.75% | 9.97% | 309,30 B |
| XRP | 2.340 | -16.77% | 4.38% | 135,66 B |
| SOLANA | 194.44 | -8.54% | 3.06% | 94,89 B |
| DOGE | 0.2503 | -15.57% | 1.19% | 37,05 B |
| CARDANO | 0.6971 | -20.28% | 0.79% | 24,53 B |
| TRX | 0.2185 | -8.97% | 0.61% | 18,82 B |
| LINK | 18.66 | -16.57% | 0.39% | 11,90 B |
| AVAX | 24.98 | -19.03% | 0.33% | 10,28 B |
| SHIB | 0.00001440 | -16.43% | 0.27% | 8,47 B |
| DOT | 4.625 | -18.97% | 0.23% | 7,13 B |
*Prepared on 2.3.2025 at 14:00 (UTC)
WHAT’S LEFT BEHIND
Goldman Sachs: Trump’s Tariffs Could Cause US Stocks to Fall 5%
Goldman Sachs strategists stated that Trump’s new tariff policies could reduce S&P 500 earnings forecasts by 2-3%. Strategist David Kostin stated that this could lead to a 5% depreciation in the US stock market in the short term.
WLFI Lost $51.7 Million in Crypto Investments
World Liberty Financial lost 21% on its $243 million crypto investment due to Trump’s tariff policies. The biggest loss was seen in ETH (-$36.7 million, down 24.4%), while WBTC and ENA also suffered significant losses.
Bernstein: Tariffs Trigger Crypto Sales, States May Accumulate Bitcoin and Gold
Bernstein analysts noted that the tariffs have increased selling pressure in the crypto market with expectations of a strong dollar and weak liquidity. In the long run, however, Bitcoin is expected to continue appreciating against the US dollar.
Bitwise: Bitcoin Will Continue to Rise in the Long Term Despite Tariffs
Jeff Park, Bitwise Alpha’s head of strategy, stated that tariffs are a temporary tool and that Bitcoin will reach higher prices and speeds in the long run.
Utah Could Be the First State in the US to Consider Establishing a Bitcoin Reserve
Utah could become the first state in the US to plan to establish a Bitcoin reserve. Satoshi Action Fund CEO Dennis Porter stated that the state has 45 days to make a decision on this issue.
Raydium Overtakes Uniswap to Become Largest DEX
Raydium overtook Uniswap to become the largest decentralized exchange (DEX) in January with a 27% market share, according to The Block. Uniswap’s market share fell to 22%.
HIGHLIGHTS OF THE DAY
Important Economic Calender Data
| Time | News | Expectation | Previous |
|---|---|---|---|
| 14:45 | US S&P Global Manufacturing PMI (Jan) | 50.1 | 50.1 |
| 15:00 | US ISM Manufacturing PMI (Jan) | 49.3 | 49.3 |
| 17:30 | FOMC Member Bostic Speaks | ||
| 22:30 | FOMC Member Musalem Speaks |
INFORMATION
*The calendar is based on UTC (Coordinated Universal Time) time zone.
The economic calendar content on the relevant page is obtained from reliable news and data providers. The news in the economic calendar content, the date and time of the announcement of the news, possible changes in the previous, expectations and announced figures are made by the data provider institutions. Darkex cannot be held responsible for possible changes that may arise from similar situations
MARKET COMPASS
In global markets, fears of trade wars triggered by Trump’s tariffs had an impact on prices. Assets considered relatively risky lost value, while the dollar rallied and gave back a small portion of its gains during European trading. European indices were down around 1.5% across the board. Futures contracts linked to Wall Street indices lost around 1.4%-1.6%. Digital assets continue to trade at price levels close to the lows recorded after the fear of tariffs.
The tariffs will go into effect tomorrow, barring a last-minute deal during Trump’s talks with the leaders of Canada and Mexico today. We can say that the issue may continue to create stress on global markets. However, for the short term in crypto assets, we think that under the assumption that there will be no new surprise news flow, we may see a horizontal and some recovery desire. Nevertheless, it is worth emphasizing that we do not expect a quick turnaround. For the long-term outlook, as mentioned below, we maintain our bullish expectation for now.
From the short term to the big picture.
Trump’s victory on November 5, one of the main pillars of our bullish expectation for the long-term outlook in digital assets, produced a result in line with our predictions. In the process that followed, the appointments made by the president-elect and the increasing regulatory expectations for the crypto ecosystem in the US and the emergence of BTC as a reserve continued to take place in our equation as positive variables. Then, 4 days after the new President took over the White House, he signed the “Cryptocurrency Working Unit” decree, which was among his election promises, and we think that the outputs it will produce in the coming days will continue to reflect positively on digital assets.
On the other hand, the expectations that the FED will continue its interest rate cut cycle, albeit on hiatus for now, and the fact that the volume in crypto-asset ETFs indicates an increase in institutional investor interest, support our upside forecast for the big picture. In the short term, given the nature of the market and pricing behavior, we think it would not be surprising to see occasional pause or pullbacks in digital assets. However, at this point, it is worth emphasizing again that we think that the fundamental dynamics continue to be bullish.
TECHNICAL ANALYSIS
BTC/USD
In the aftermath of the Trump tariff crisis, the EU announced that it would respond strongly to Trump’s possible tariffs on European goods. The EU emphasized that such policies are harmful for all parties.
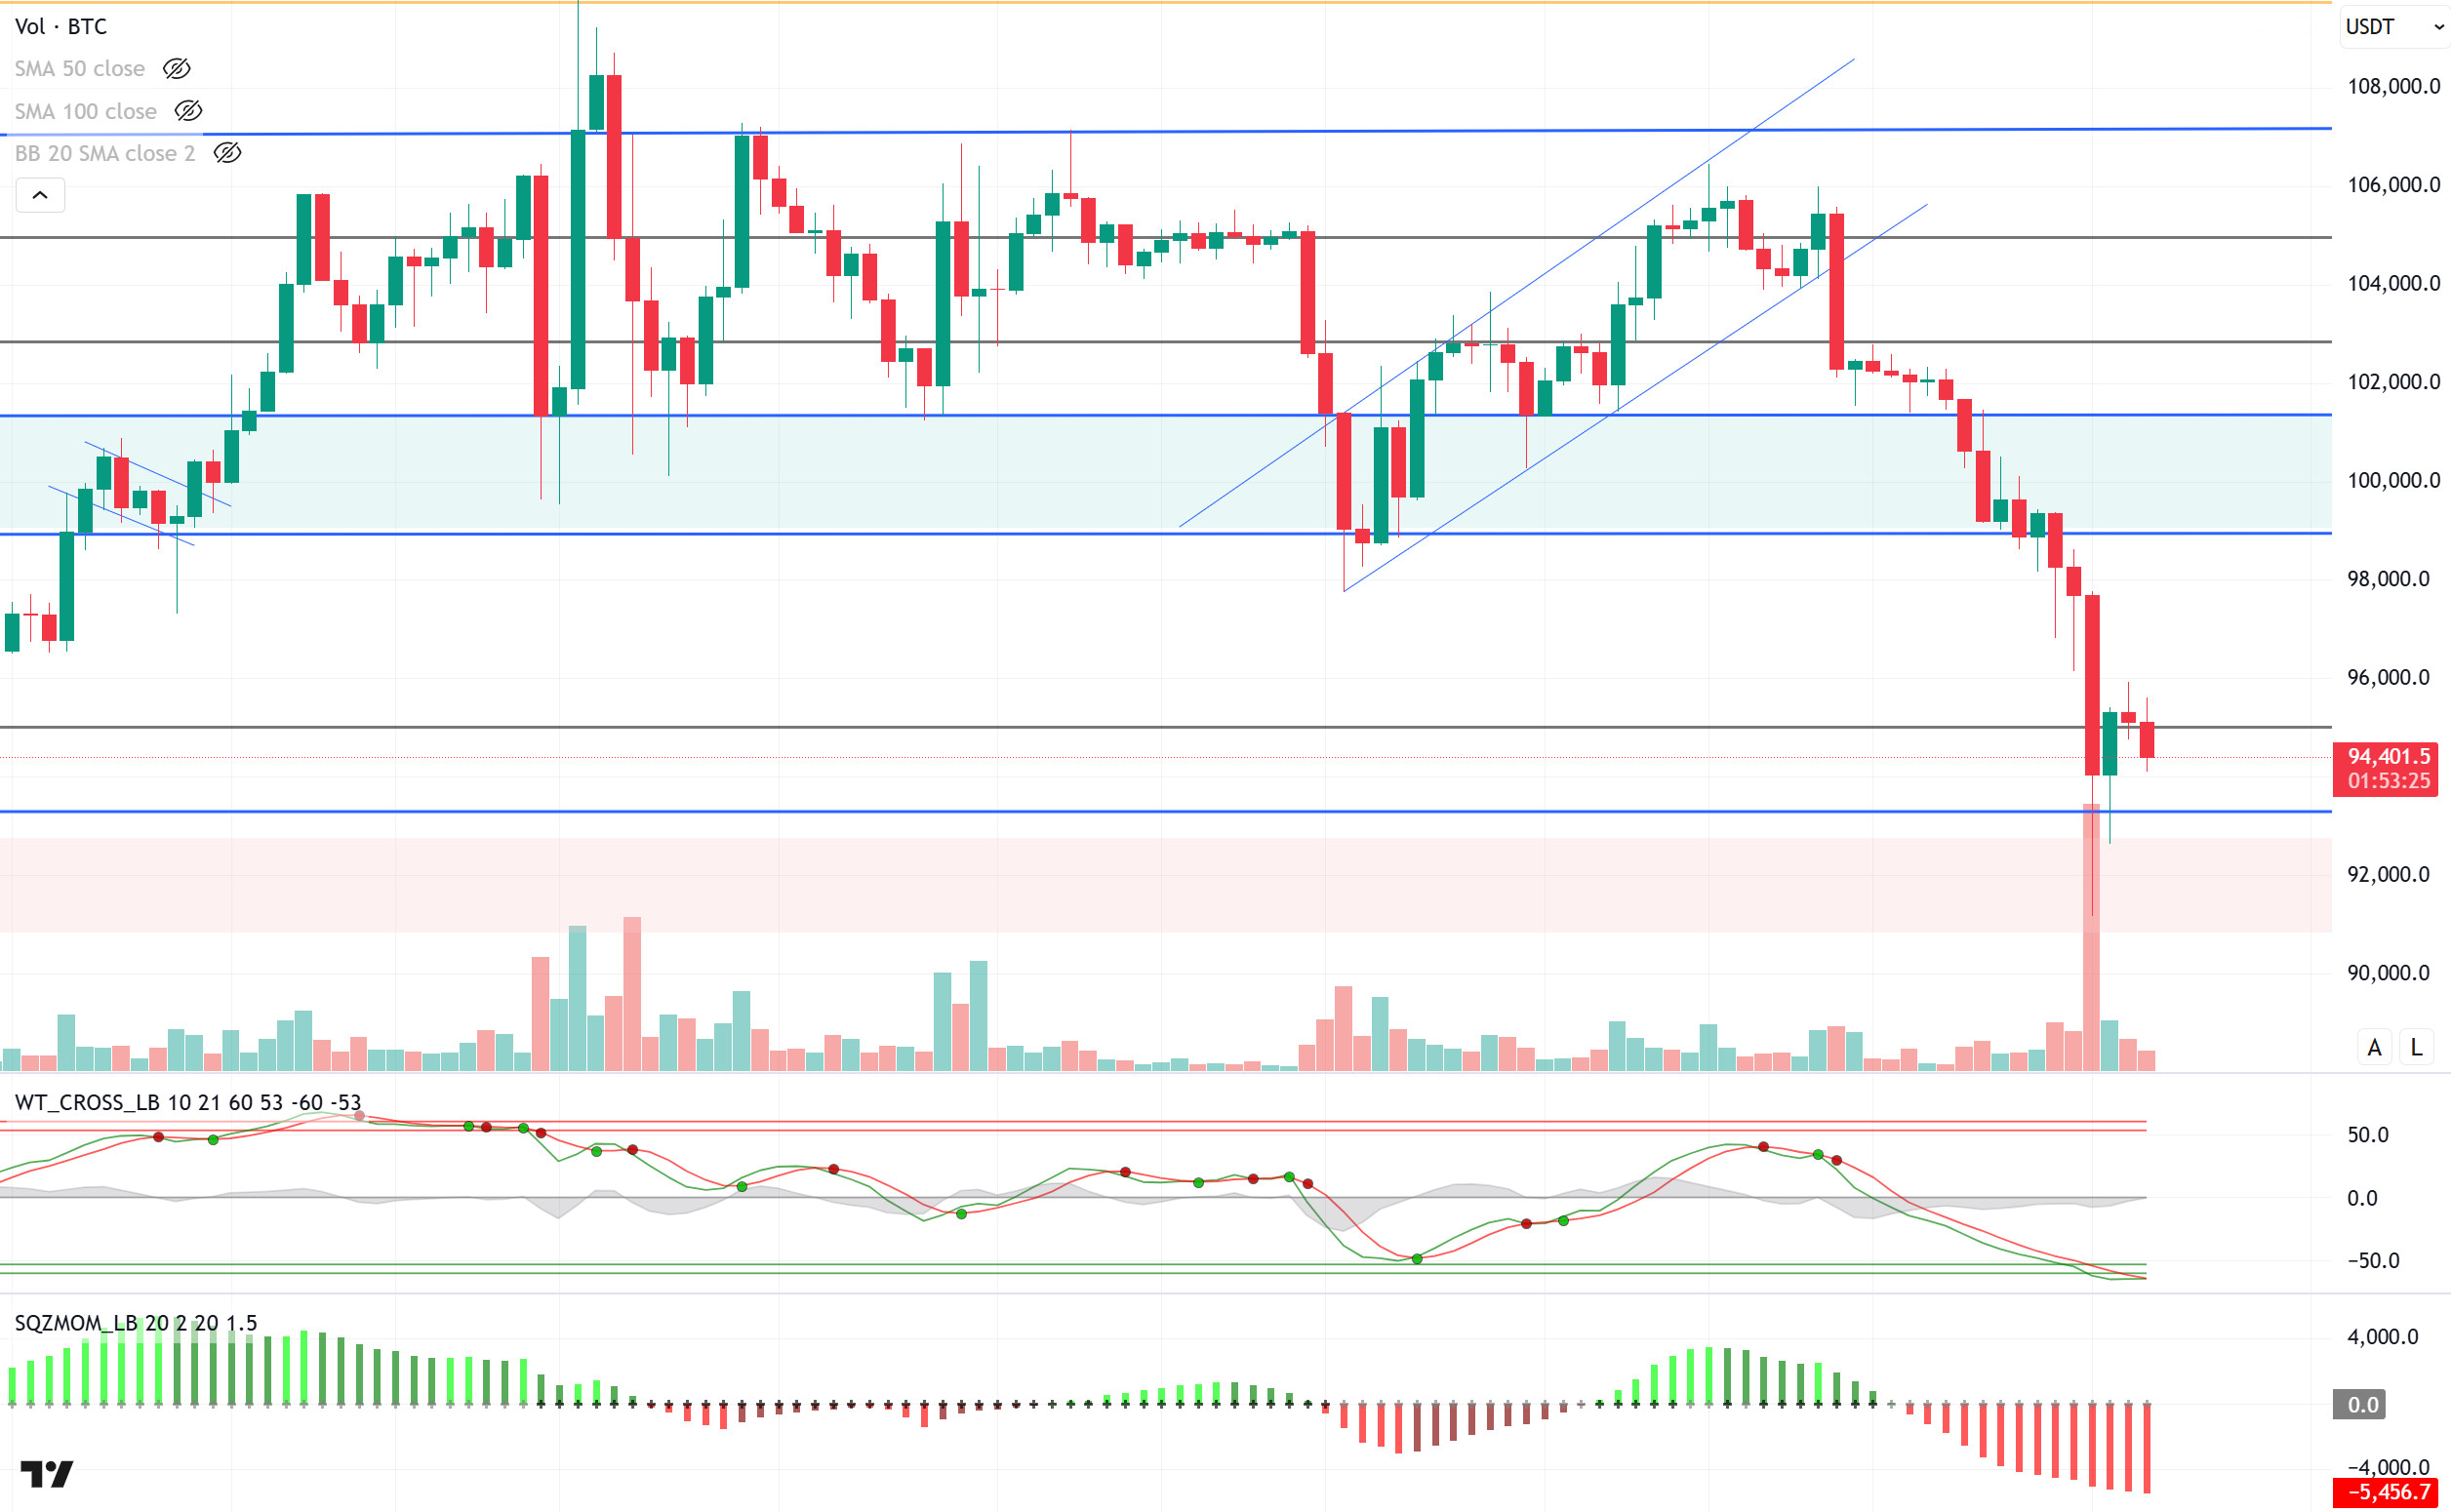
When we look at the technical outlook following the tariff crisis, we see that pricing continued at 94,400 levels, just below the 95,000 resistance level during the day. Technical oscillators remain in oversold territory, while the momentum indicator remains weak, suggesting that selling pressure is still effective. If the selling pressure continues to increase, the 92,800 level may stand out as a strong support point. A break of this level could lead to a deepening of the sell-off, testing lower support zones. On the other hand, in case of a possible recovery, exceeding the 95,000-resistance level and sustaining above this level will be a critical threshold in terms of strengthening the upward trend. Closures above this level may support the acceleration of upward movements.
Supports 92,800 – 90,400 – 88,000
Resistances 95,000 – 97,200 – 99,100
ETH/USDT
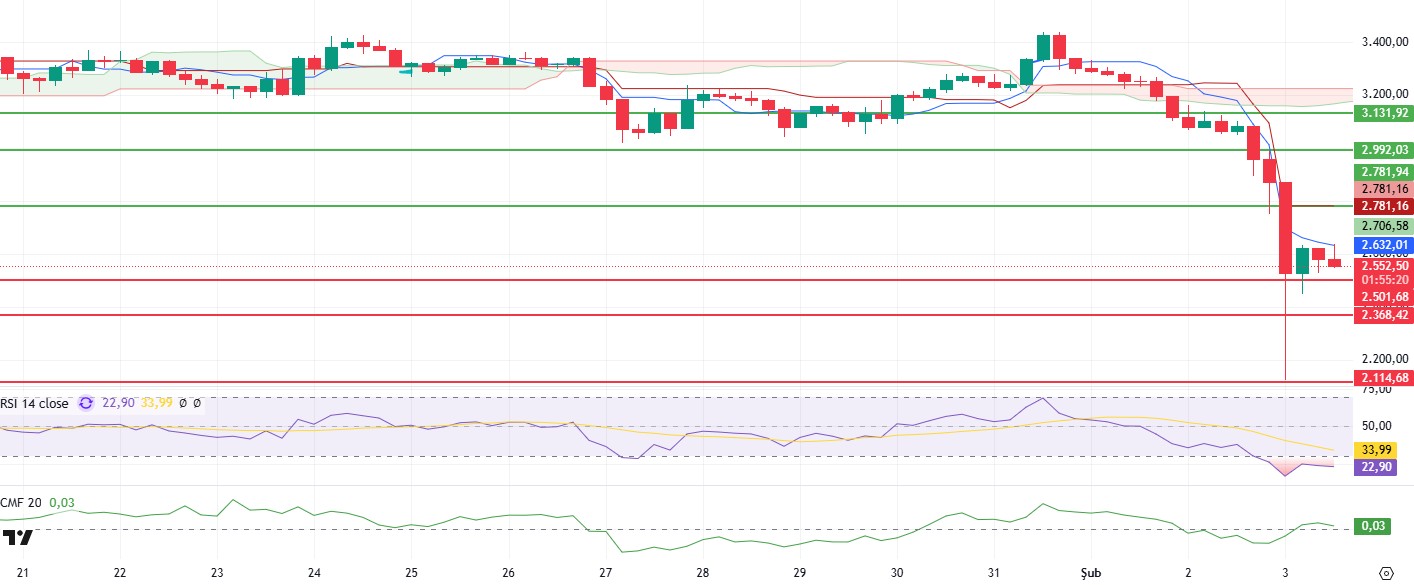
After a sharp decline last night, ETH recovered to the $2,500 level but continues to move sideways, encountering resistance in this region. In the short term, it rose as high as Tenkan-Sen, but retreated slightly with selling pressure and the market has not yet set a clear direction.
Analyzing the technical indicators, the Relative Strength Index (RSI) is still in oversold territory and does not signal an upward reversal. This indicates that the selling pressure continues and buyers have not entered the market strongly. Chaikin Money Flow (CMF), on the other hand, briefly moved into positive territory, but weakened again and headed towards negative territory, suggesting that liquidity inflows are insufficient.
In order for ETH to enter the recovery process, it is critical to maintain the $ 2,500 level. If this level is broken, it is predicted that the price could fall as low as $ 2,368. On the other hand, exceeding the $2,781 level could start a new uptrend and lead the price towards $2,992. While the current indicators show that ETH is yet to enter a strong recovery phase, it should be carefully monitored how the price movements will shape around the decisive levels.
Supports 2,501 – 2,368 – 2,114
Resistances 2,781 – 2,992 – 3,131
XRP/USDT
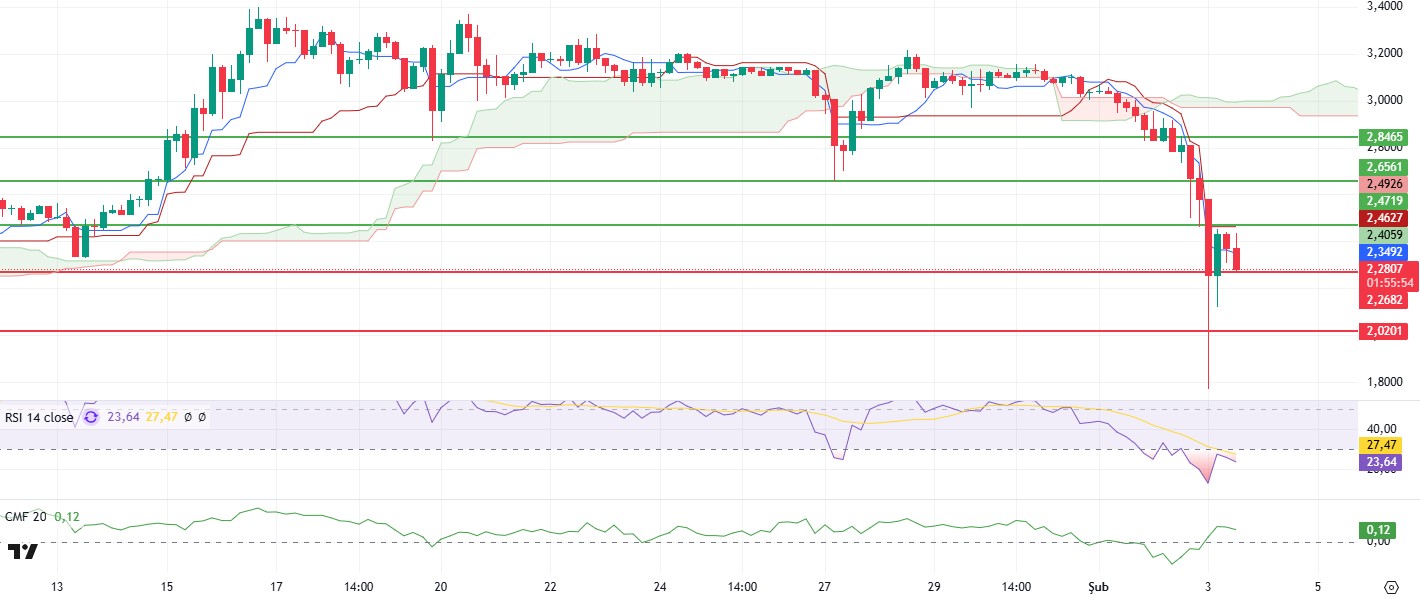
XRP, which fell to the level of $ 1.77 with sharp sales in the night hours, quickly recovered and managed to rise above $ 2.30. The technical outlook of XRP, which remained flat during the day, turned slightly negative.
The Relative Strength Index (RSI) indicator remains slightly down in the oversold territory, suggesting that the signals of a market rebound are weak. On the other hand, the Chaikin Money Flow (CMF) indicator remains in positive territory, indicating that there is still liquidity in the market and fund inflows are continuing.
In this context, it is predicted that if the $2.24 level is broken, XRP may fall towards the main support of $2.02. However, if reaction purchases come from the 2.24 support, it is possible for the price to rise again to the $ 2.47 level. Movements at the $2.24 level will be decisive for the short-term direction of XRP.
Supports 2.2467 – 2.0201 – 1.6309
Resistances 2.4719 – 2.6561 – 2.8465
SOL/USDT
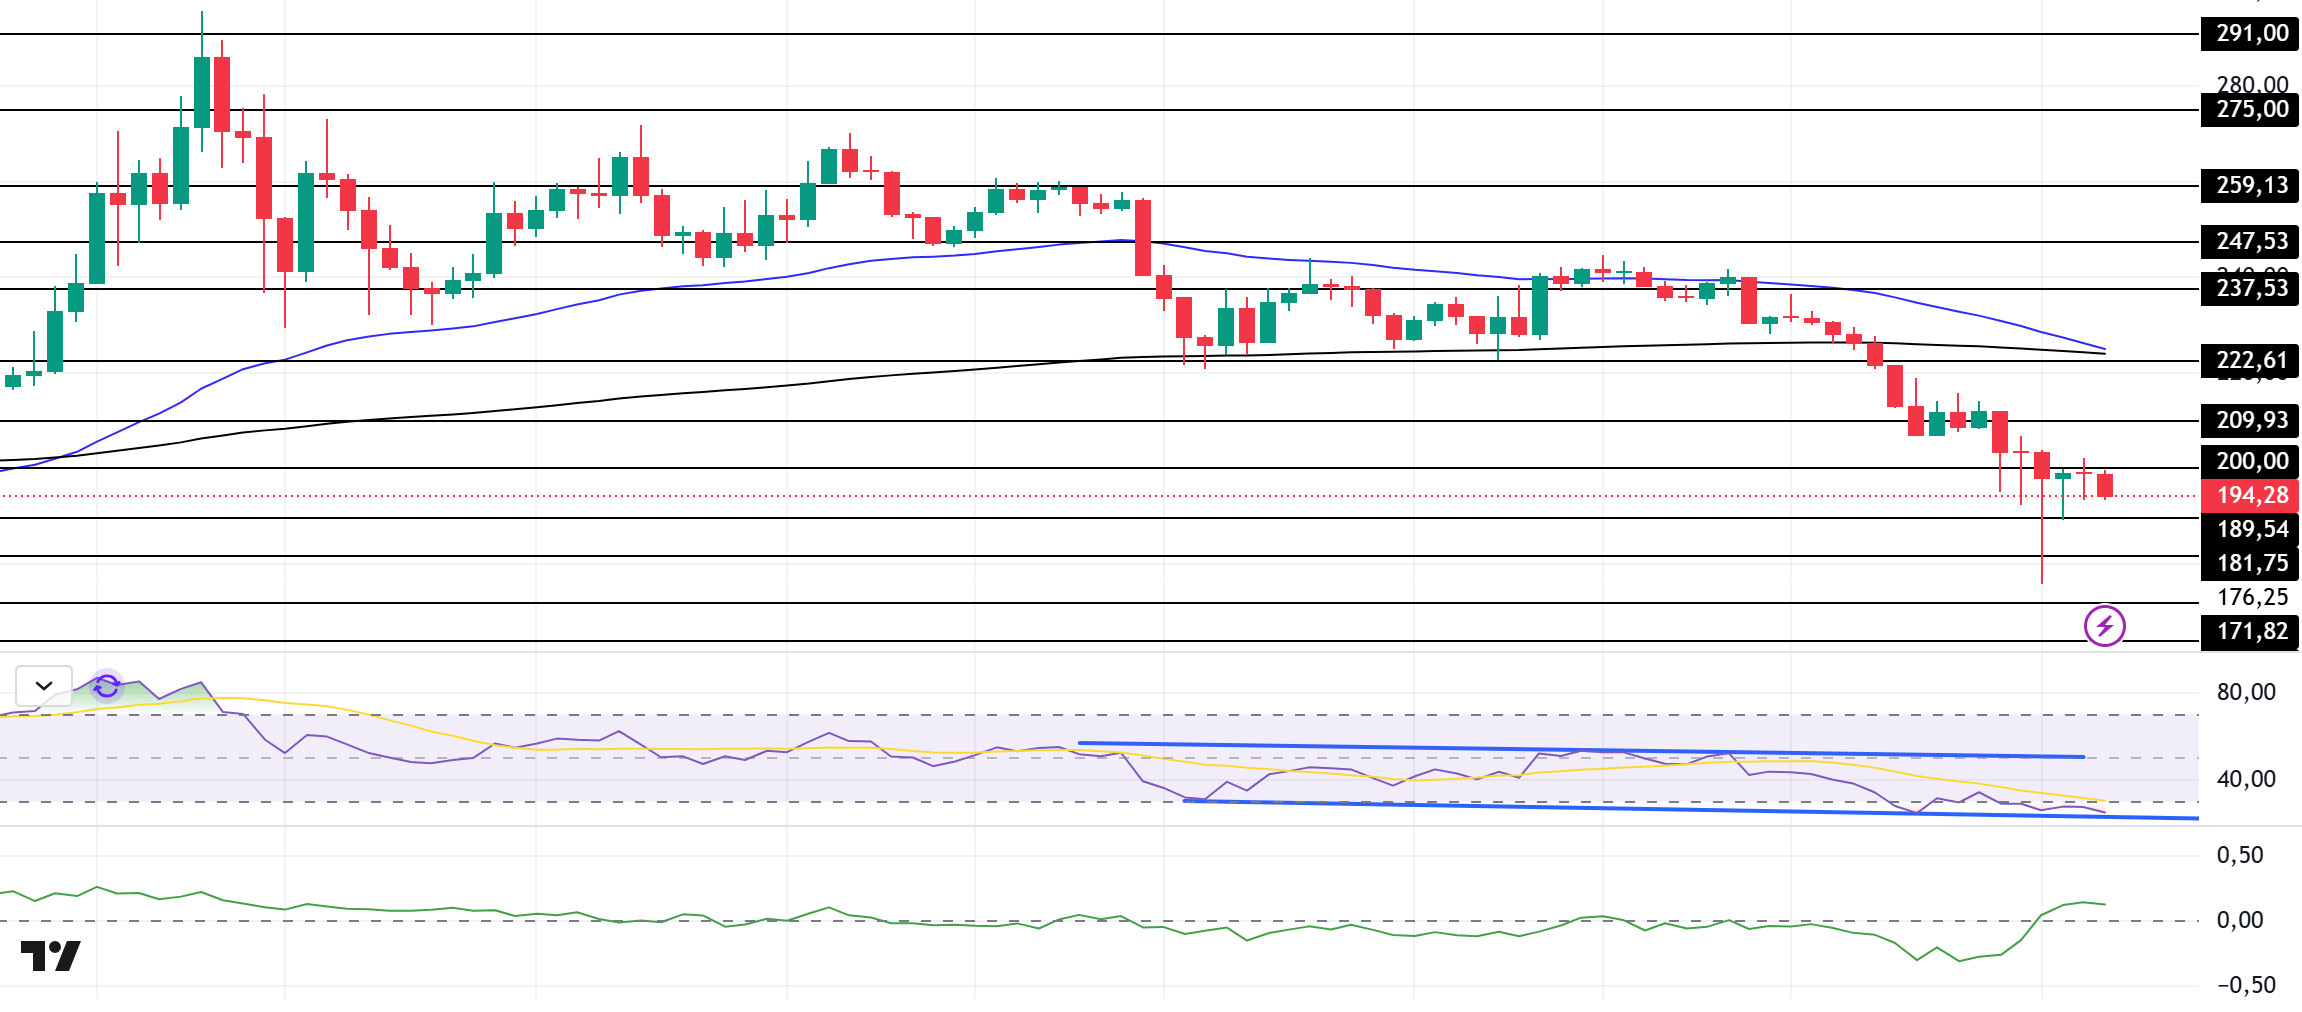
The Solana network has a total locked value (TVL) of more than $9.4 billion and a stablecoin market capitalization of more than $11.7 billion. On the other hand, more than 388 million SOLs have already been deposited to secure the Solana network and generate passive income in return.
SOL has remained sideways since our analysis in the morning. On the 4-hour timeframe, the 50 EMA (Blue Line) is about to touch the 200 EMA (Black Line). This shows us that the price is looking for direction. At the same time, the asset continues to be priced below the 50 EMA and 200 EMA. When we examine the Chaikin Money Flow (CMF)20 indicator, it is in the positive territory and money inflows are increasing at the same time. However, the Relative Strength Index (RSI)14 indicator is in the oversold zone and the downtrend in RSI that started on January 19 continues. It is currently testing the support point of the downtrend. The 237.53 level appears to be a very strong resistance point in the rises driven by both the upcoming macroeconomic data and the news in the Solana ecosystem. If it breaks here, the rise may continue. In case of retracements for the opposite reasons or due to profit sales, the 209.93 support level can be triggered. If the price comes to these support levels, a potential bullish opportunity may arise if momentum increases.
Supports 189.54 – 181.75 – 171.82
Resistances 200.00 – 209.93 – 222.61
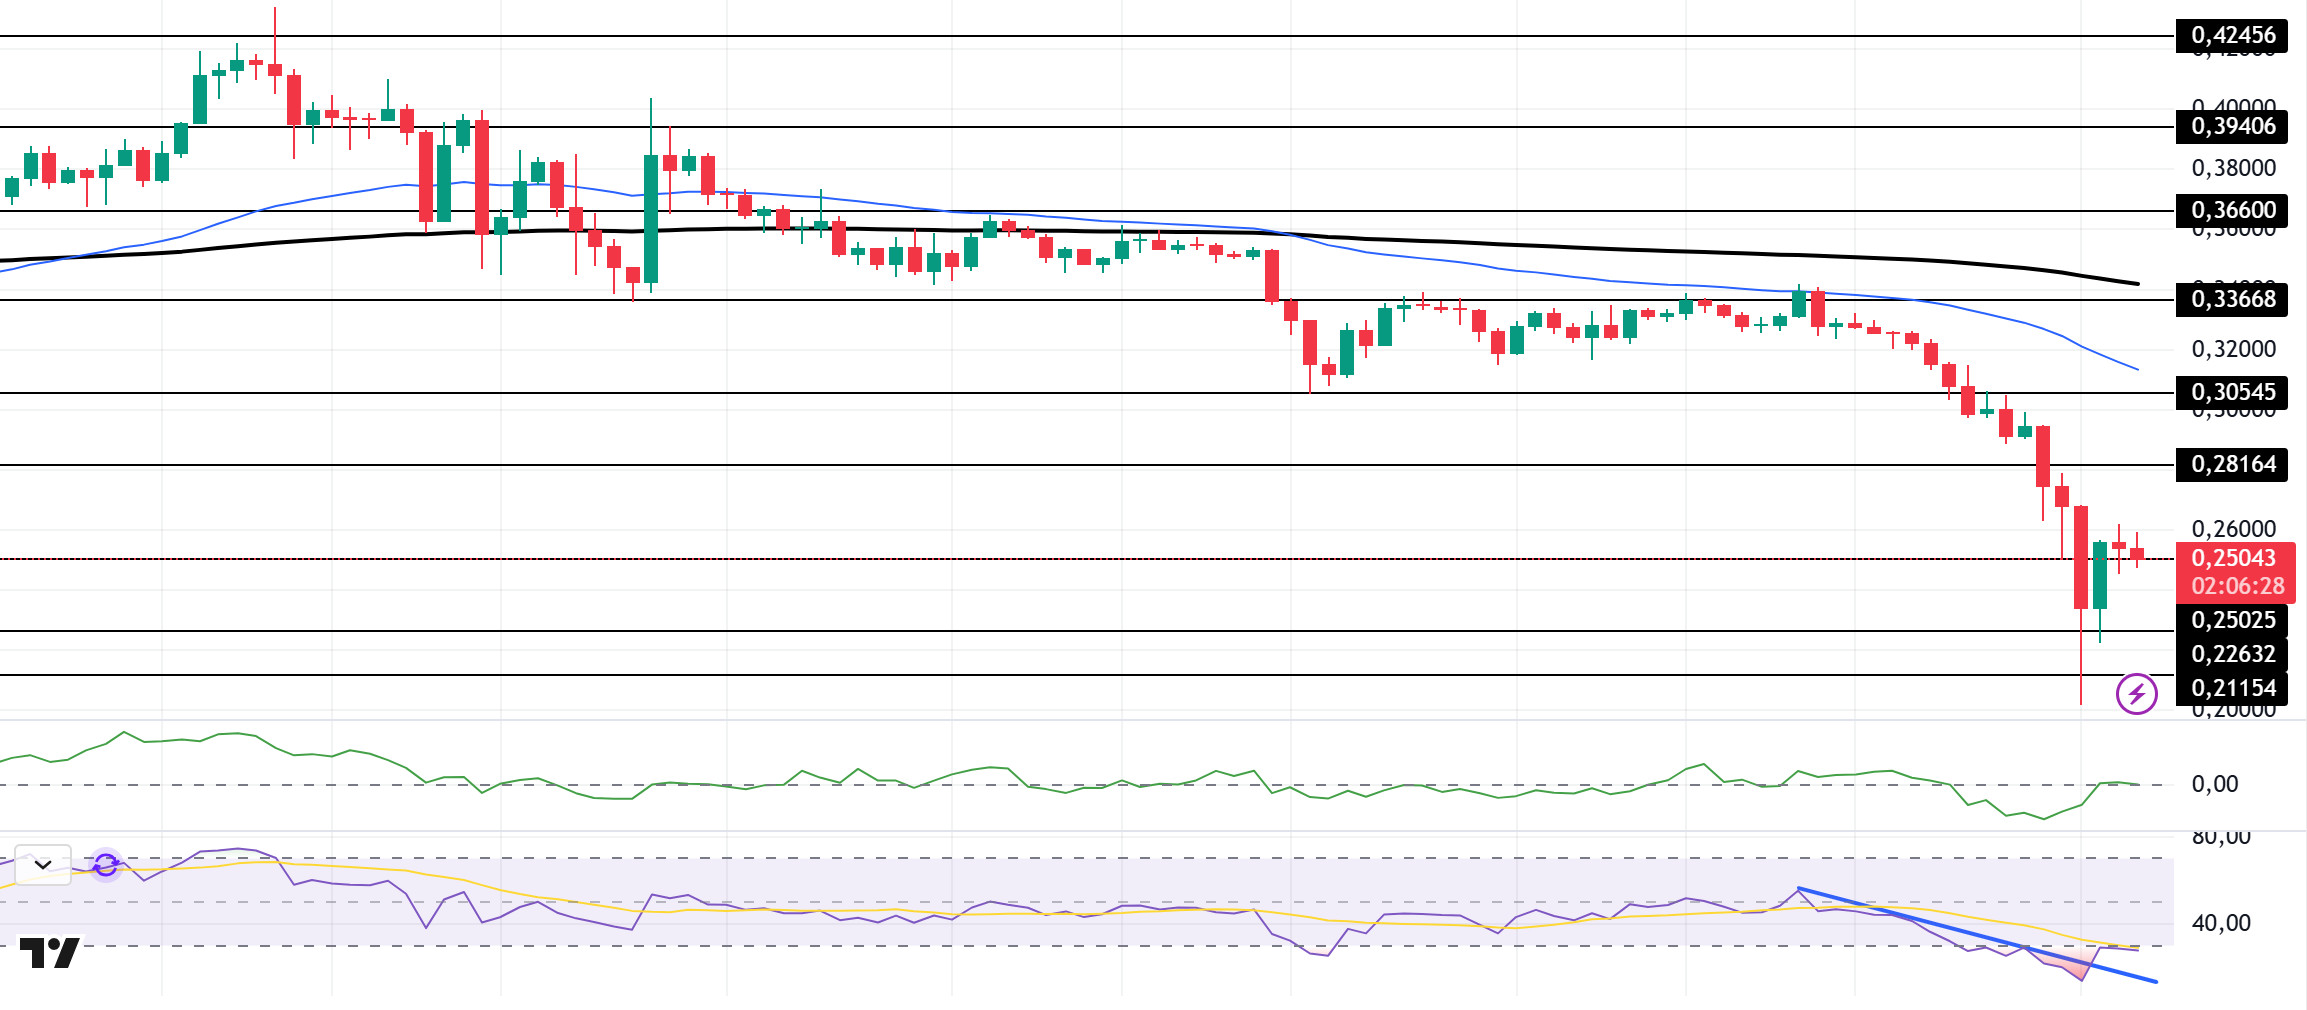
DOGE/USDT
Dogecoin whales have sold another significant portion of their holdings in the last 24 hours, adding to the downward pressure. Whales sold 270 million DOGE in the last 24 hours, causing a price drop and market losses. In total, however, more than 1.2 billion Dogecoin transfers took place. DOGE’s Funding Ratio was realized as -0.0193%. Open Interest data decreased by 30% to $2.53 billion. In the last hour alone, $1.31 million worth of liquidations took place
On the 4-hour timeframe, the 50 EMA (Blue Line) continues to be below the 200 EMA (Black Line). This could mean that the decline could deepen further in the medium term. At the same time, the price is below the 50 EMA (Blue Line) and the 200 EMA (Black Line). However, the large gap between the moving averages and the asset may increase the probability of DOGE rising. The Chaikin Money Flow (CMF)20 indicator is in the neutral zone. However, it is seen that money inflows and outflows are in balance. At the same time, the Relative Strength Index (RSI)14 is in oversold territory and the RSI indicator seems to have broken the downtrend upwards. This shows us that the price is strengthening here. The 0.33668 level appears to be a very strong resistance point in the rises due to political reasons, macroeconomic data and innovations in the DOGE coin. In case of possible pullbacks due to political, macroeconomic reasons or negativities in the ecosystem, the 0.18954 level, which is the base level of the trend, is an important support. If the price reaches these support levels, a potential bullish opportunity may arise if momentum increases.
Supports 0.25025 – 0.22632 – 0.21154
Resistances 0.28164 – 0.30545 – 0.33668
LEGAL NOTICE
The investment information, comments and recommendations contained herein do not constitute investment advice. Investment advisory services are provided individually by authorized institutions taking into account the risk and return preferences of individuals. The comments and recommendations contained herein are of a general nature. These recommendations may not be suitable for your financial situation and risk and return preferences. Therefore, making an investment decision based solely on the information contained herein may not produce results in line with your expectations.
