
MARKET SUMMARY
Latest Situation in Crypto Assets
| Assets | Last Price | 24h Change | Dominance | Market Cap. |
|---|---|---|---|---|
| BTC | 99,523.48 | 4.48% | 60.13% | 1,97 T |
| ETH | 2,829.48 | 10.02% | 10.42% | 341,31 B |
| XRP | 2.627 | 11.11% | 4.62% | 151,56 B |
| SOLANA | 212.34 | 8.24% | 3.16% | 103,36 B |
| DOGE | 0.2725 | 7.74% | 1.23% | 40,31 B |
| CARDANO | 0.7622 | 8.98% | 0.82% | 26,84 B |
| TRX | 0.2246 | 1.84% | 0.59% | 19,35 B |
| LINK | 20.56 | 9.12% | 0.40% | 13,13 B |
| AVAX | 27.01 | 7.31% | 0.34% | 11,13 B |
| SHIB | 0.00001587 | 9.32% | 0.29% | 9,35 B |
| DOT | 4.848 | 4.35% | 0.23% | 7,49 B |
*Prepared on 2.4.2025 at 14:00 (UTC)
WHAT’S LEFT BEHIND
Crypto and Artificial Intelligence “Czar” David Sacks to Hold Press Conference Today
David Sacks, appointed by US President Trump, will hold a press conference today to outline the US government’s plans for leadership in digital wealth and artificial intelligence.
Trump Agrees to Delay Tariffs with Mexico for a Month
Trump has agreed with Mexican President Sheinbaum to suspend the expected tariffs for one month. The two sides will continue negotiations during this period to seek a permanent solution.
Elon Musk Outlines DOGE Plan and Aims to Boost Confidence in US Debt
Elon Musk has presented a plan to abolish the US foreign aid agency USAID. Musk aims to increase confidence in US debt, arguing that regulations should be simplified.
Sol Strategies Buys 40,300 SOLs
Canada-based Sol Strategies has acquired 40,300 SOLs, spending approximately $9.94 million. The transaction was realized at an average price of USD 246.53 per SOL.
Ethereum Increases Gas Limit for the First Time Since Proof-of-Stake Transition
The Ethereum network has increased its scalability capacity by increasing the gas limit from 30 million to 31 million. The change was approved by more than 50% of validators.
Tron and Movement Decline to Exchange Tokens with WLFI Project
Tron and Movement Labs rejected a token swap offer from the Trump-backed WLFI project. Movement co-founder Rushi Manche said there was no collusion or backdoor dealings.
HIGHLIGHTS OF THE DAY
Important Economic Calender Data
| Time | News | Expectation | Previous |
|---|---|---|---|
| 15:00 | US JOLTS Job Openings (Dec) | 8.01M | 8.10M |
| 16:00 | FOMC Member Bostic Speaks | – | – |
| 19:00 | FOMC Member Daly Speaks | – | – |
INFORMATION
*The calendar is based on UTC (Coordinated Universal Time) time zone.
The economic calendar content on the relevant page is obtained from reliable news and data providers. The news in the economic calendar content, the date and time of the announcement of the news, possible changes in the previous, expectations and announced figures are made by the data provider institutions. Darkex cannot be held responsible for possible changes that may arise from similar situations
MARKET COMPASS
The agenda in global markets continues to be shaped by US President Donald Trump’s tariffs. Digital assets, which fell sharply at the beginning of the week with the additional tariffs announced for Mexico and Canada, had the opportunity to recover when it was announced that they were postponed after phone calls between the leaders. On the other hand, the additional tariffs announced by China in response to the US were enough to prevent these rises. The Asian session in major cryptocurrencies saw some of the gains given back. During European trading, we saw more horizontal changes and stabilization. However, it seems that the “trade wars” agenda, especially between the US and China, will continue to be effective on asset prices.
During the day, we saw an effort to recover losses in European stock markets, while Wall Street futures point to a flat opening. After the tariffs announced over the weekend, the dollar, which rose after the opening of traditional markets, declined slightly against major currencies and is currently holding around 108.50. Yields on the US 10-year treasury bond have risen and are pushing 4.60% again. Although the dose of tension in the markets does not seem to have decreased, we can state that investors may start to digest the latest developments.
In the rest of the day, in addition to this agenda, Job Openings and Labor Turnover Survey (JOLTS) data from the US and statements from the Federal Reserve officials will be monitored. In addition, Alphabet, the parent company of Google, will announce its balance sheet after the closing bell of the US stock markets. We think that volatility and wavelengths may increase, but price changes may be observed in a horizontal band, albeit relatively wider. The direction in which the trade war issue will evolve and the US macro agenda will continue to be decisive in pricing behavior. As for the longer term outlook, we see no reason to change our bullish expectation mentioned below, underlining once again that volatility may be high in the short term.
From the short term to the big picture.
Trump’s victory on November 5, one of the main pillars of our bullish expectation for the long-term outlook in digital assets, produced a result in line with our predictions. In the process that followed, the appointments made by the president-elect and the increasing regulatory expectations for the crypto ecosystem in the US, as well as the emergence of BTC as a reserve, continued to take place in our equation as positive variables. Then, 4 days after the new President took over the White House, he signed the “Cryptocurrency Working Unit” decree, which was among his election promises, and we think that the positive reflection of the outputs it will produce in the coming days on digital assets may continue.
On the other hand, the expectations that the FED will continue its interest rate cut cycle, albeit on hiatus for now, and the fact that the volume in crypto-asset ETFs indicates an increase in institutional investor interest, support our upside forecast for the big picture. In the short term, given the nature of the market and pricing behaviors, we think it would not be surprising to see occasional pause or pullbacks in digital assets. However, at this point, it is worth emphasizing again that we think that the fundamental dynamics continue to be bullish.
TECHNICAL ANALYSIS
BTC/USD
US President Donald Trump signed a decree establishing a sovereign wealth fund. Treasury Secretary Scott Bessent announced that the fund will be launched within 12 months. Following this development, Senator Cynthia Lummis’ suggestive post on social media increased speculation that Bitcoin could be evaluated within the scope of this fund. On the other hand, David Sacks, appointed by US President Trump, will summarize the government’s leadership plans in digital assets and artificial intelligence at a press conference today.
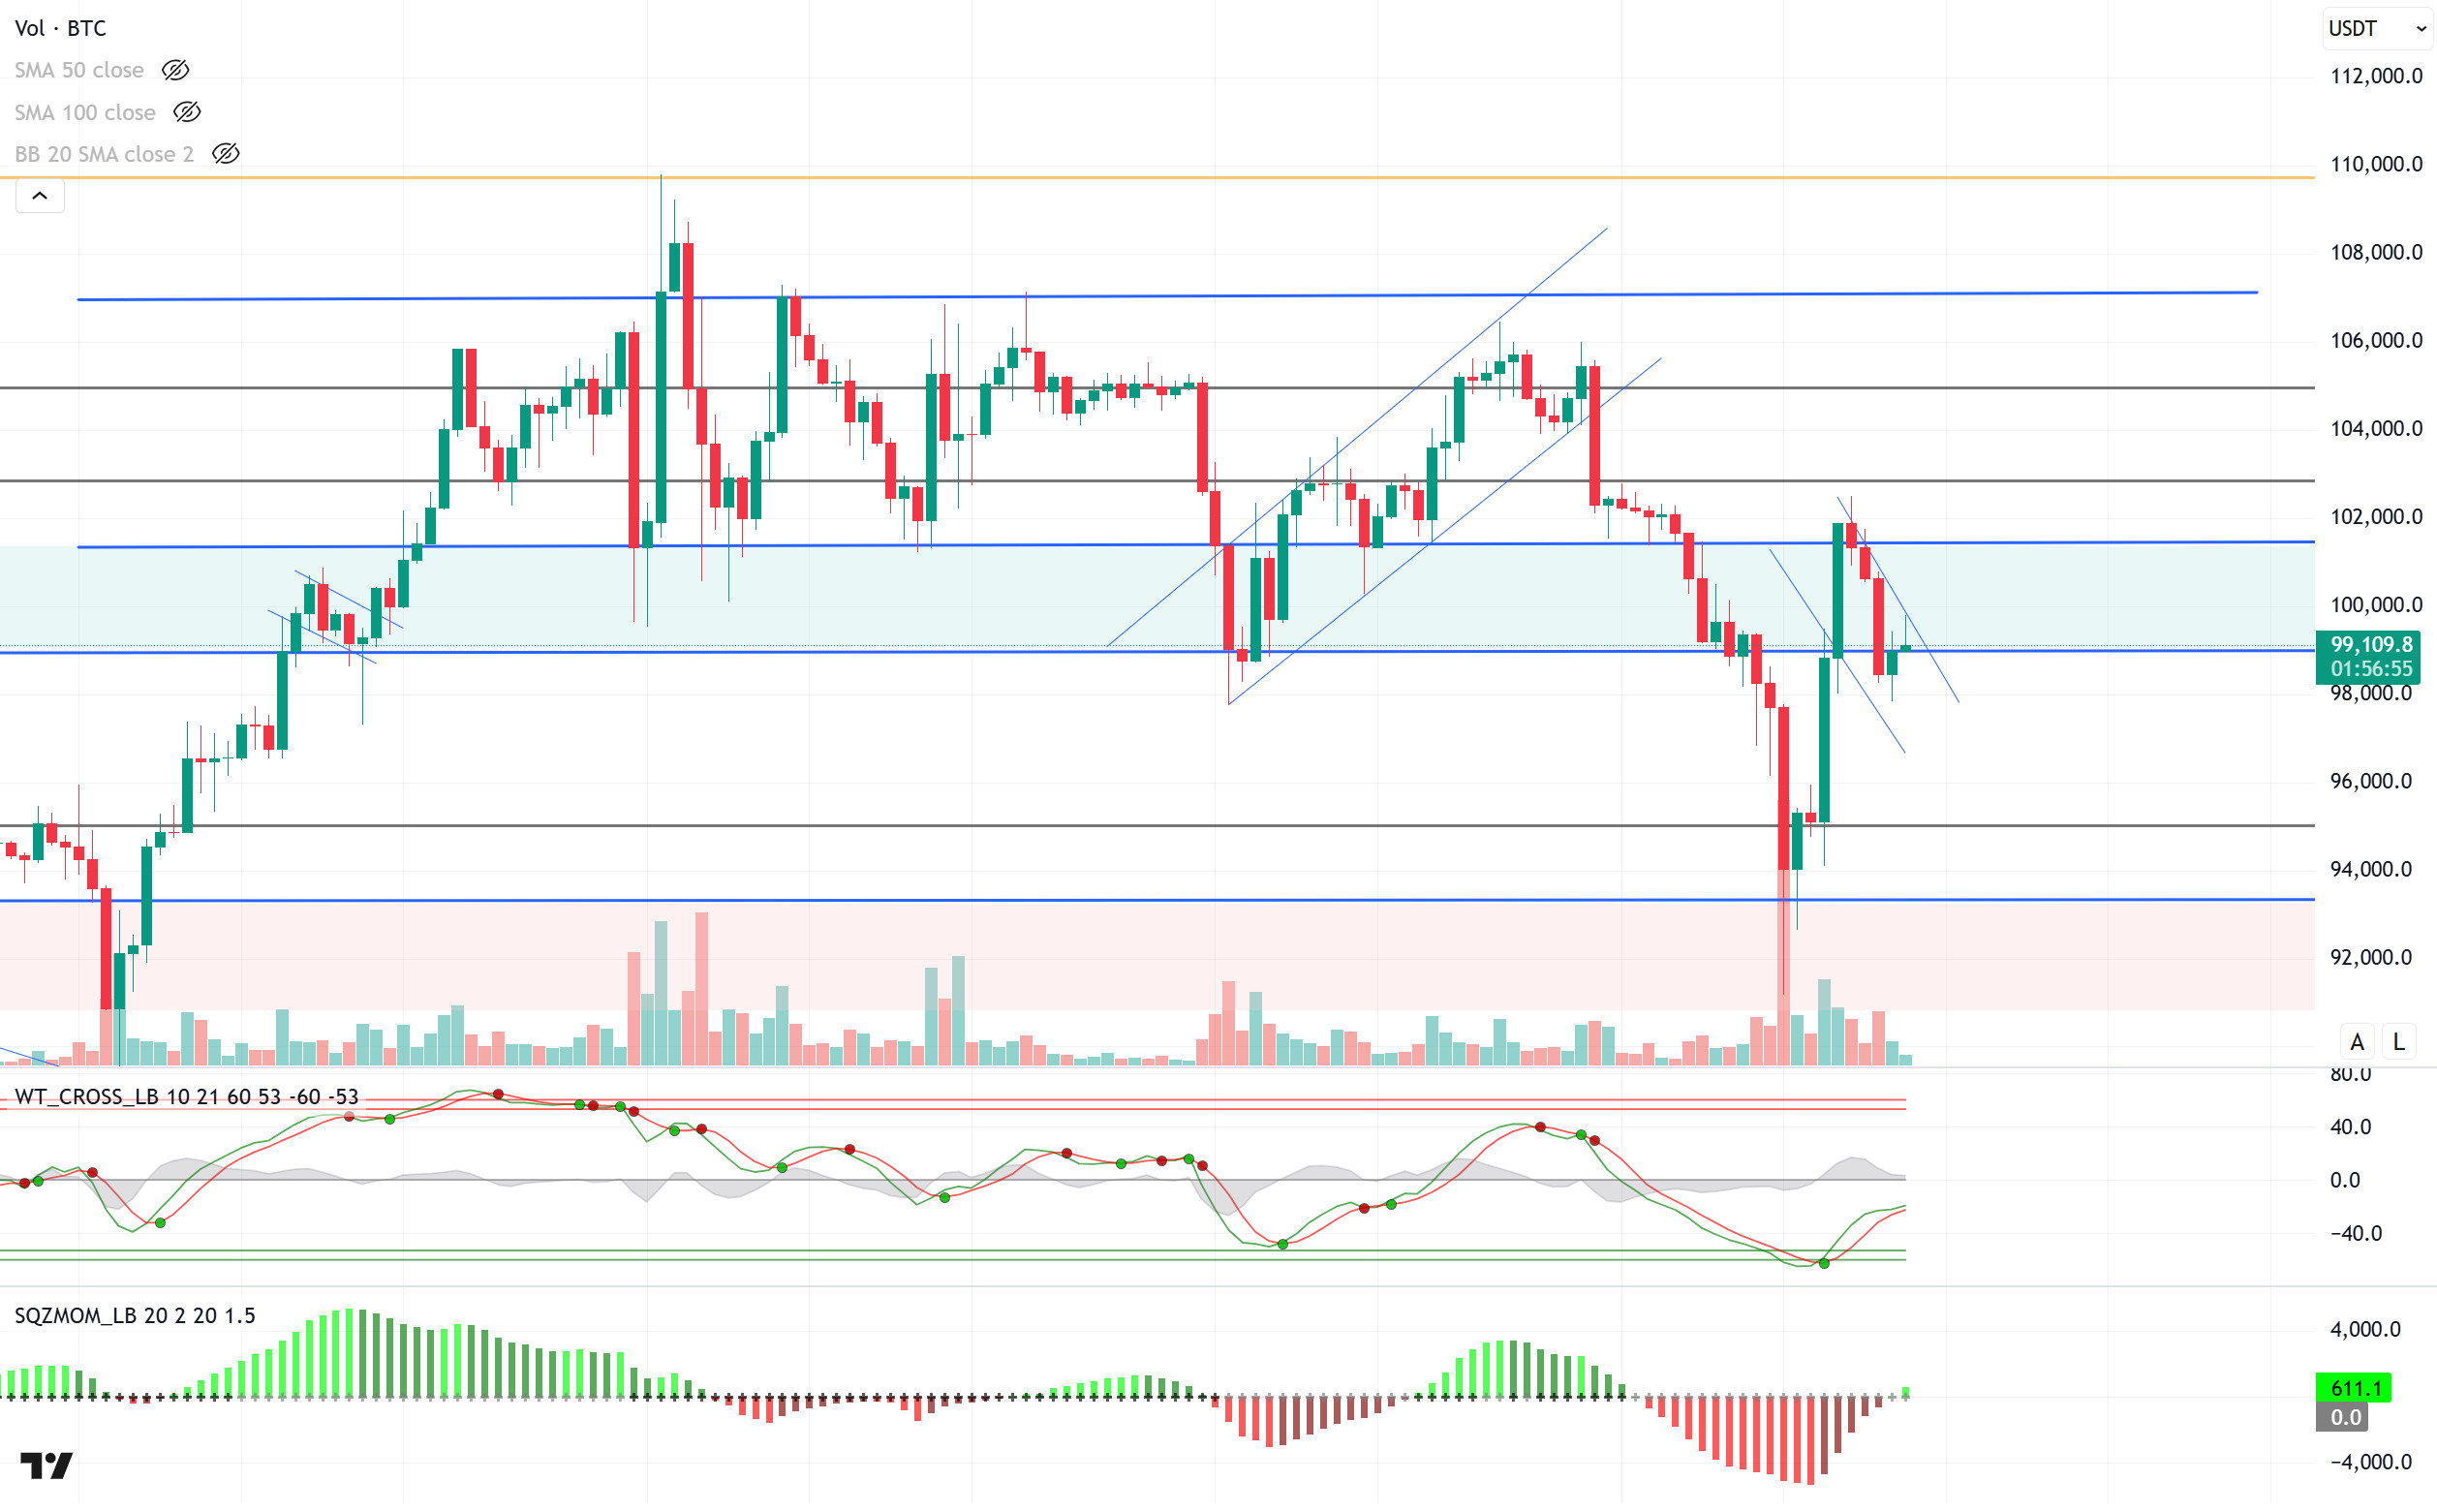
Looking at the technical outlook, in the previous analysis, we mentioned that technical oscillators coming to the overbought zone on hourly charts gave a sell signal and the accumulation of long trades between 97,000 and 98,000. As a matter of fact, BTC, which fell to 97,800 during the day, managed to recover again and is trading at 99,400 above the support level of 91,100. With the flag-pennant pattern seen in its price and the buy signal given by technical oscillators on hourly and 4-hour charts, we will follow the six-digit levels again in the upward breakout as a result of the positive momentum indicator. In the event of a possible pullback, closures below 99,100 may re-trigger selling pressure and the major support level of 95,000 may be tested once again.
Supports 99,100 – 98,000 – 97,200
Resistances 101,400 – 102,800 – 105,000
ETH/USDT
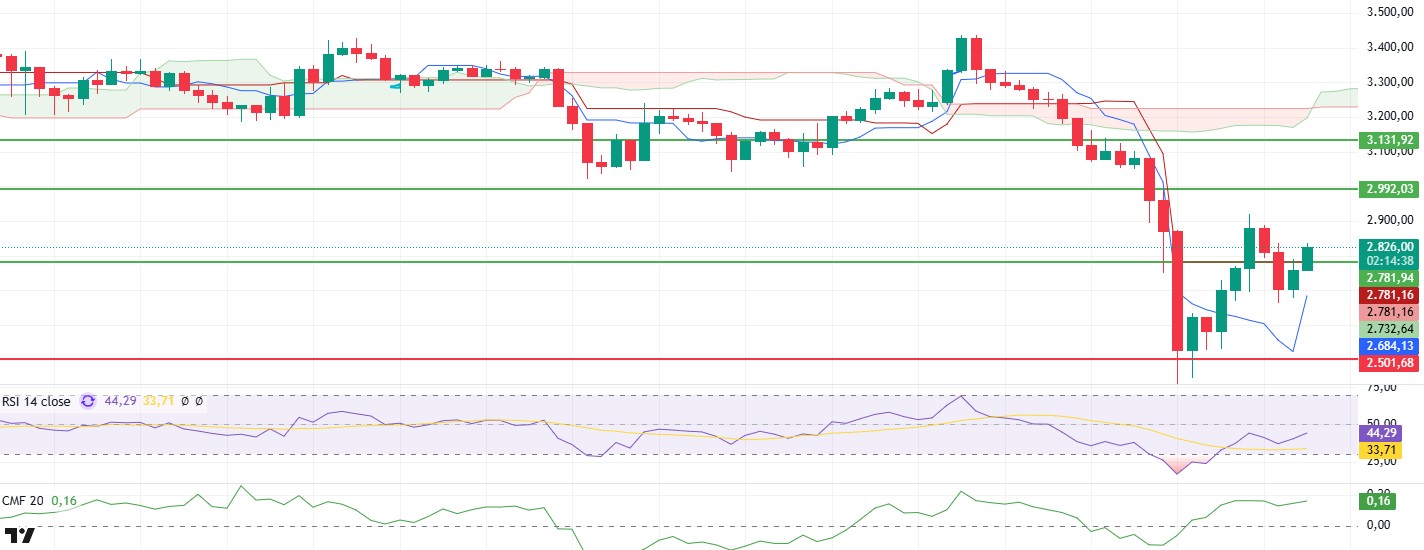
ETH has managed to rebound strongly after the morning pullback to break above the critical 2,781 resistance level and is currently pricing above $2,800.
Technical indicators suggest that bullish momentum may continue. The Relative Strength Index (RSI) indicator continues its upward movement, indicating that buying pressure is continuing and the price may maintain its momentum and support the uptrend. The Chaikin Money Flow (CMF) indicator continues to rise strongly after crossing into positive territory, indicating increased liquidity entering the market and strengthening buyers. As for the Ichimoku indicator, the price broke through the Kijun-Sen level, indicating that the trend is strengthening, and the upward movement is supported. This development stands out as an important factor supporting short-term bullish scenarios.
Persistence above 2,781 may accelerate the uptrend towards 2,992 levels. This region is followed as a strong resistance in the short term. However, a downward break of the 2,781 level may increase selling pressure and cause a deep retracement. In such a scenario, the 2,501 – 2,368 support zones may come to the fore. In summary, Ethereum’s technical outlook remains positive, while price movements above the 2,781 level are bullish. However, in case of a decline below this level, sharp selling waves may be seen.
Supports 2,781 – 2,501 – 2,368
Resistances 2,992 – 3,131 – 3,231
XRP/USDT
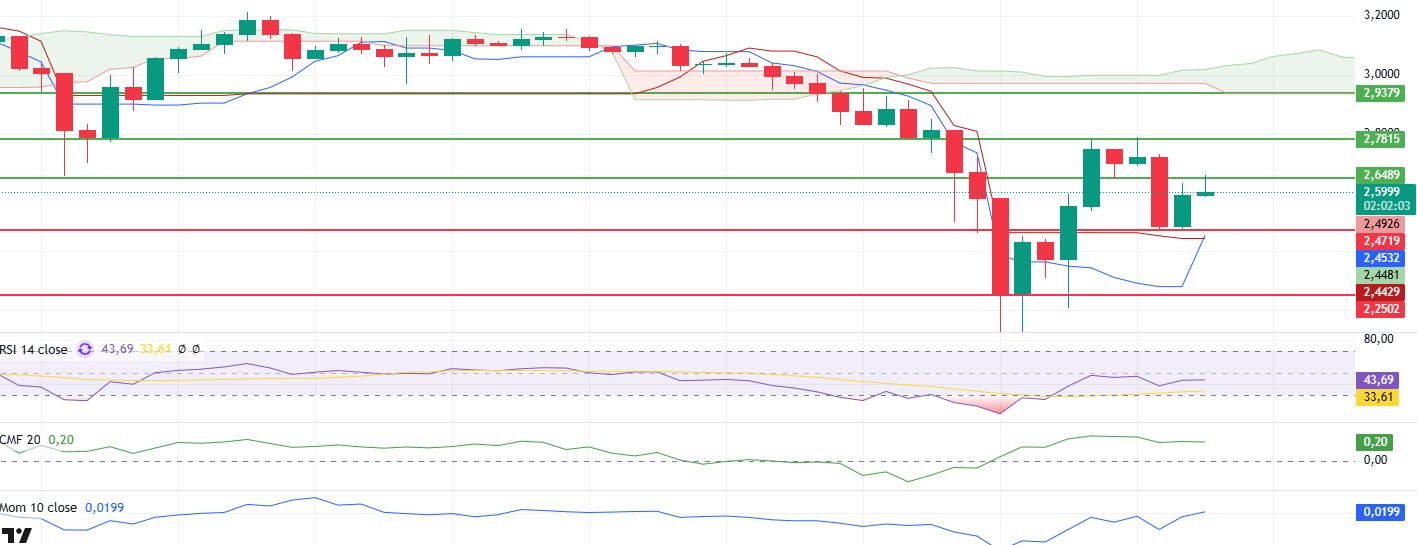
XRP first fell to 2.47 in the morning hours, as expected, and then rose again to 2.64 resistance with the reaction it received from this critical level
Looking at the technical indicators, it is seen that the positive outlook continues. The Relative Strength Index (RSI) indicator, which has continued its upward momentum by rapidly emerging from the oversold zone since the last decline, can be listed as one of the most important indicators contributing to the positive outlook. Chaikin Money Flow (CMF) has started its horizontal movement after moving into the positive area. Momentum, on the other hand, seems to continue its upward trend.
Although the indicators support the upward movements of the price, deep declines are likely to be seen in closures below 2.47 due to the fact that the XRP price is at important resistance points and macroeconomic risks. However, as long as this region is not broken, positive effects on the price will be effective.
Supports 2.4719 – 2.2502 – 2.0201
Resistances 2.6489 – 2.7815 – 2.9379
SOL/USDT
Everstake announced its partnership with Fragmetric to offer restaking services on SOL. The partnership will provide stakers with more flexibility and restaking rewards to retake their assets while maintaining liquidity. Meanwhile, according to PANews, Canadian public company Sol Strategies announced the purchase of 40,300 more SOL tokens between January 19 and January 31, 2025. The purchase was made at an average total cost of $9,935,329, equivalent to $246 per SOL.
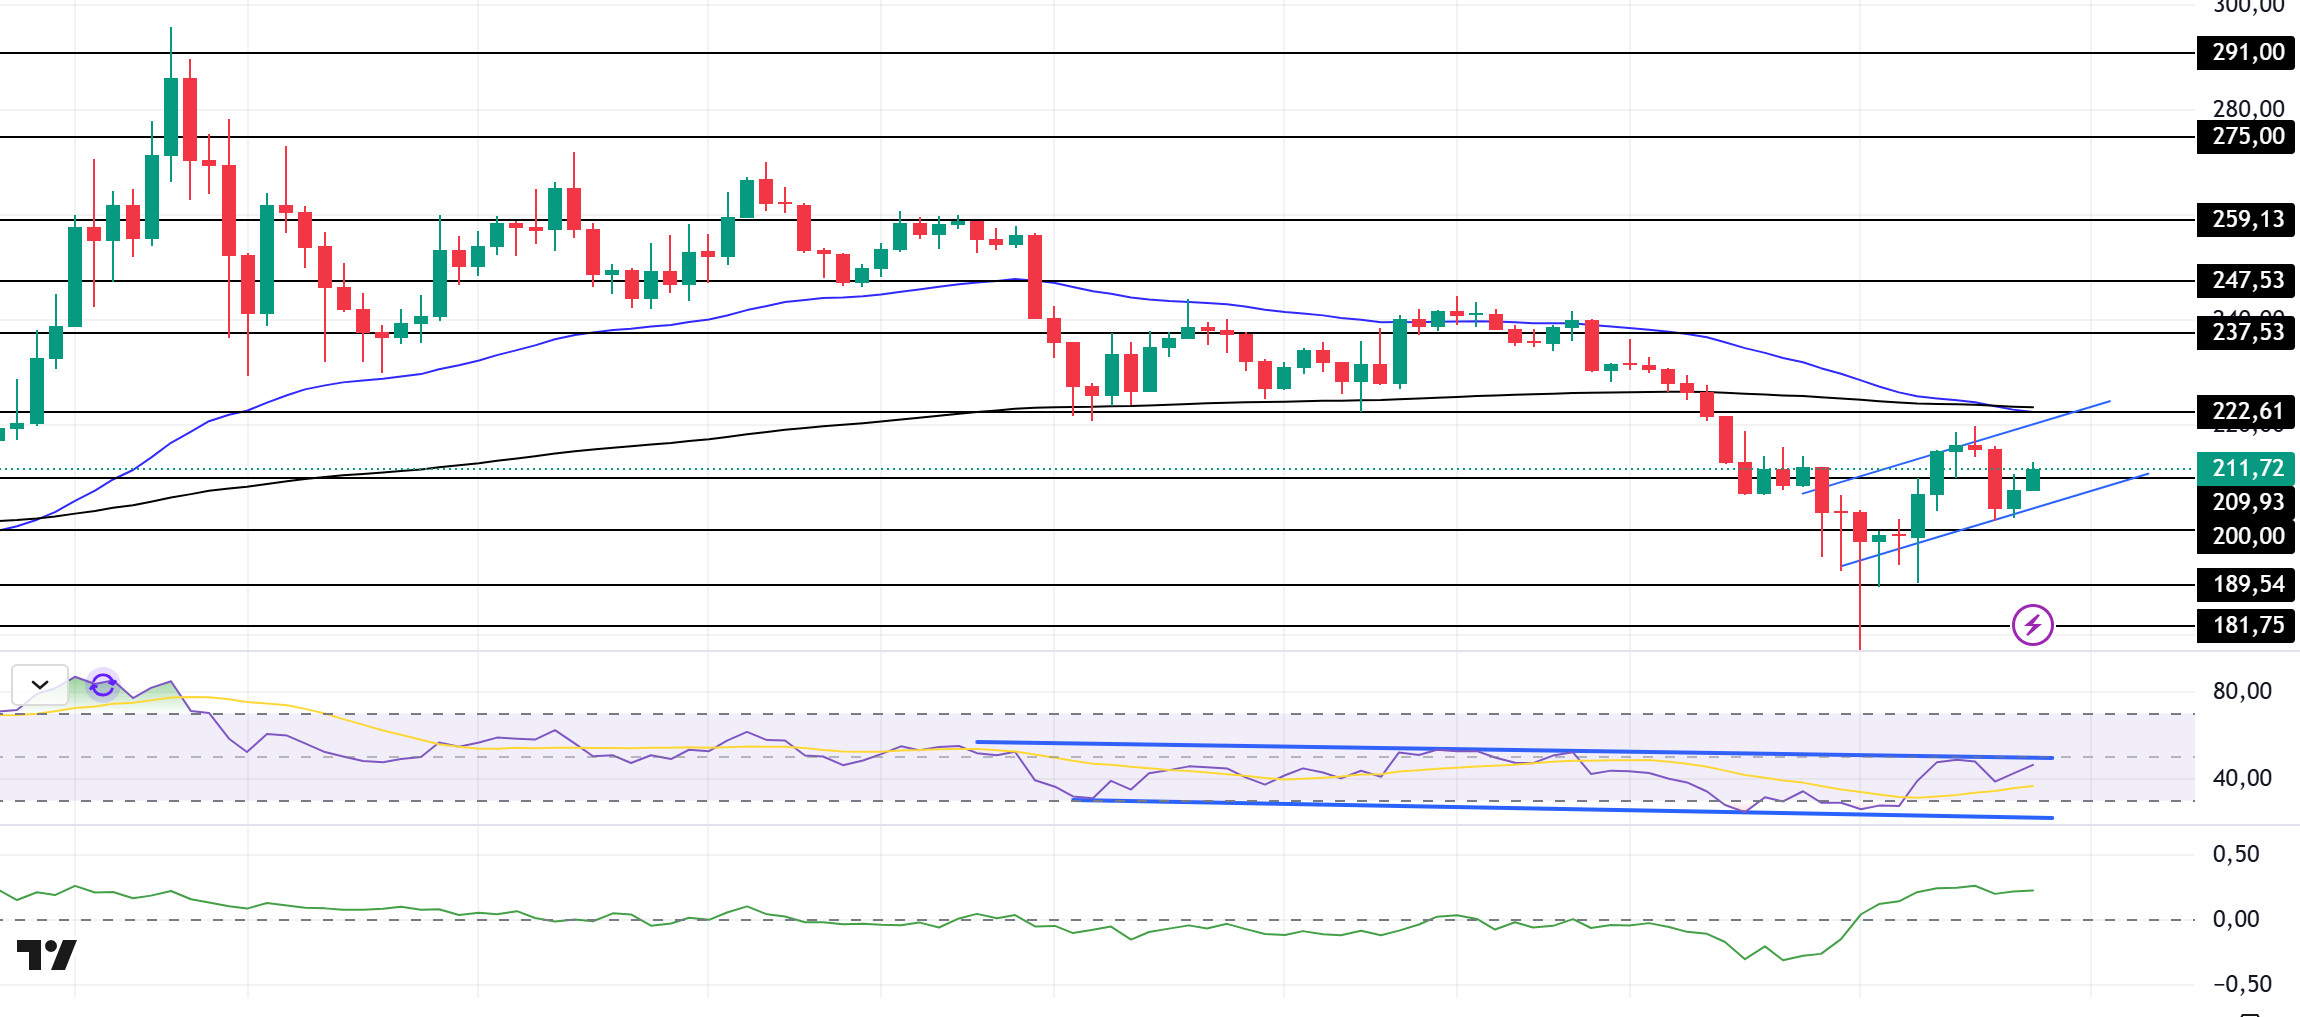
Since our analysis in the morning, SOL has fluctuated at a narrow level and formed an uptrend. On the 4-hour timeframe, the 50 EMA (Blue Line) has touched the 200 EMA (Black Line). This suggests that the price is looking for direction. At the same time, the asset continues to be priced below the 50 EMA and 200 EMA. When we examine the Chaikin Money Flow (CMF)20 indicator, it is in positive territory, but at the same time, money inflows have started to increase. However, the Relative Strength Index (RSI)14 indicator is at the upper level of the negative zone and the price is testing the ceiling level of the downtrend that started on January 19 at the time of writing. The 237.53 level is a very strong resistance point in the uptrend driven by both the upcoming macroeconomic data and the news in the Solana ecosystem. If it breaks here, the rise may continue. In case of retracements due to the opposite reasons or due to profit sales, the 209.93 support level can be triggered. If the price hits these support levels, a potential bullish opportunity may arise if momentum increases.
Supports 200.00 – 189.54 – 181.75
Resistances 209.93 – 222.61 – 237.53
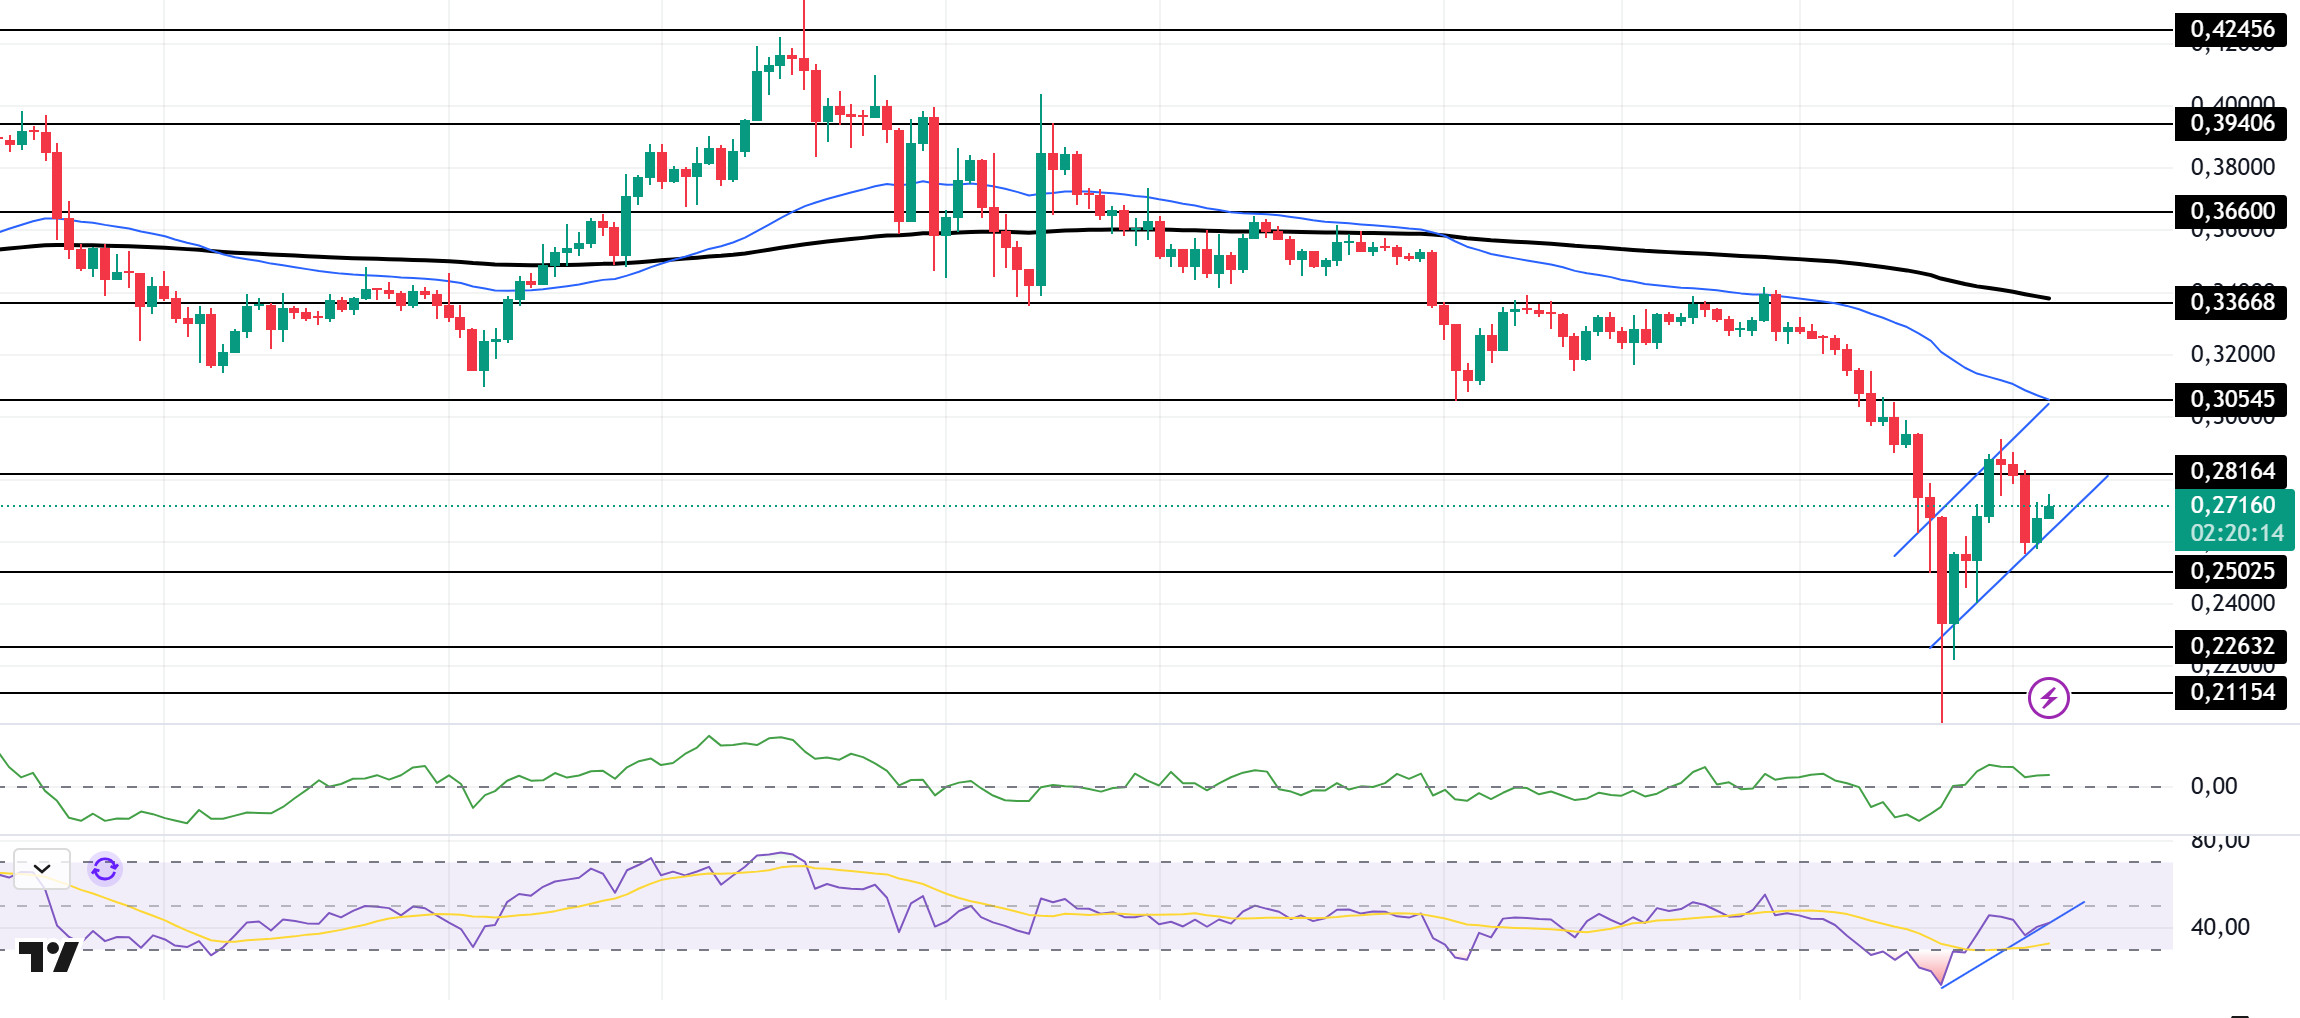
DOGE/USDT
The US Treasury was sued for giving Elon Musk’s DOGE department access to sensitive information. The US Treasury was accused of unlawfully allowing Elon Musk and his government efficiency organization access to the personal and financial data of millions of Americans.
Since our analysis in the morning, the price has shown a sideways trend. On the 4-hour timeframe, the 50 EMA (Blue Line) continues to be below the 200 EMA (Black Line). This could mean that the decline could deepen further in the medium term. At the same time, the price is below the 50 EMA (Blue Line) and the 200 EMA (Black Line). However, the large gap between the moving averages and the asset may increase the probability of DOGE rising. When we analyze the Chaikin Money Flow (CMF)20 indicator, although it is in positive territory, money inflows remained stable. At the same time, Relative Strength Index (RSI)14 is moving towards the neutral level at the mid-level of the negative zone. At the same time, an uptrend has formed in the RSI. This shows us that the strength of the price is increasing. The 0.33668 level is a very strong resistance point in the rises due to political reasons, macroeconomic data and innovations in the DOGE coin. In case of possible pullbacks due to political, macroeconomic reasons or negativities in the ecosystem, the 0.18954 level, which is the base level of the trend, is an important support. If the price reaches these support levels, a potential bullish opportunity may arise if momentum increases.
Supports 0.25025 – 0.22632 – 0.21154
Resistances 0.28164 – 0.30545 – 0.33668
LEGAL NOTICE
The investment information, comments and recommendations contained herein do not constitute investment advice. Investment advisory services are provided individually by authorized institutions taking into account the risk and return preferences of individuals. The comments and recommendations contained herein are of a general nature. These recommendations may not be suitable for your financial situation and risk and return preferences. Therefore, making an investment decision based solely on the information contained herein may not produce results in line with your expectations.
