MARKET SUMMARY
Latest Situation in Crypto Assets
| Assets | Last Price | 24h Change | Dominance | Market Cap. |
|---|---|---|---|---|
| BTC | 91,000.53 | -3.88% | 57.16% | 1,81 T |
| ETH | 3,057.37 | -6.36% | 11.68% | 368,79 B |
| XRP | 2.374 | -5.21% | 4.33% | 136,63 B |
| SOLANA | 175.66 | -6.55% | 2.70% | 85,30 B |
| DOGE | 0.3183 | -5.75% | 1.49% | 46,99 B |
| CARDANO | 0.9040 | -9.44% | 1.01% | 31,80 B |
| TRX | 0.2203 | -7.15% | 0.60% | 18,99 B |
| AVAX | 33.86 | -8.72% | 0.44% | 13,91 B |
| SHIB | 0.00002019 | -7.01% | 0.38% | 11,90 B |
| LINK | 18.39 | -8.07% | 0.37% | 11,72 B |
| DOT | 6.169 | -7.94% | 0.30% | 9,48 B |
*Prepared on 1.13.2025 at 14:00 (UTC)
WHAT’S LEFT BEHIND
MicroStrategy Buys Bitcoin for the 10th Week in a Row
MicroStrategy continues its Bitcoin purchases unabated. The company bought 2,530 BTC on Monday, spending a total of $243 million on these purchases. The company, which has been aggressively buying Bitcoin since the beginning of November, continues to attract the attention of the market.
Semler Scientific Buys 237 BTC More
US-listed Semler Scientific spent $23.3 million to buy 237 BTC between December 16, 2024 and January 10, 2025, PR Newswire reported. The company bought each Bitcoin at approximately $98,267, bringing its total holdings to 2,321 BTC. The total value of these Bitcoins was calculated to be $191.9 million as of January 10, 2025. The company’s average BTC purchase cost was reported as $ 82,687.
FTX to Distribute $1.2 Billion to Creditors After Trump Inauguration
FTX is scheduled to distribute $1.2 billion to its creditors by 2025. Industry sources stated that a significant portion of these repayments will be reinvested in cryptocurrencies due to the promising crypto market growth prospect for 2025.
Deribit Options Market: BTC has a 32% Probability of Reaching $100K
Deribit executive Lin Chen said on the X platform that according to data from the options market, there is only a 32% chance that Bitcoin will exceed $100,000 by the end of the month.
HIGHLIGHTS OF THE DAY
Important Economic Calender Data
*No Important Calendar Data for the Rest of the Day
INFORMATION:
*The calendar is based on UTC (Coordinated Universal Time) time zone. The economic calendar content on the relevant page is obtained from reliable news and data providers. The news in the economic calendar content, the date and time of the announcement of the news, possible changes in the previous, expectations and announced figures are made by the data provider institutions. Darkex cannot be held responsible for possible changes that may arise from similar situations
MARKET COMPASS
The main storyline in global markets remains the US Federal Reserve’s (FED) interest rate cut path. While recent macro indicators paint a positive picture for the health of the world’s largest economy, expectations that the FED will slow down or even end the rate cut cycle and the possible inflationary consequences of the policies of the next Trump era play a decisive role in pricing behavior. The appreciation of the dollar and the rise in Treasury bond yields limited the appetite for risk-taking, which was also reflected in digital assets. European stock markets are selling, and Wall Street is expected to start the week on the negative side.
This week, macro indicators from the US, especially the Consumer Price Index (CPI), may be decisive for prices. Please click here for our weekly report on this topic.
Although there are intermediate reactions in the rest of the day, we think that the pressurized and horizontal course may continue. For the long term, we maintain our view mentioned below for now.
From the short term to the big picture.
The victory of former President Trump on November 5, which was one of the main pillars of our bullish expectation for the long-term outlook in digital assets, produced a result in line with our predictions. Afterwards, the appointments made by the president-elect and the increasing regulatory expectations for the crypto ecosystem in the US and the emergence of BTC as a reserve continued to take place in our equation as positive variables. Although it is expected to continue at a slower pace, the preservation of expectations that the FED will continue its interest rate cut cycle and the volume in crypto asset-based ETFs indicating an increase in institutional investor interest support our upward forecast for the big picture for now. In the short term, given the nature of the market and pricing behavior, we think it would not be surprising to see occasional pauses or pullbacks in digital assets. However, at this point, it is worth emphasizing again that we think the fundamental dynamics continue to be bullish.
TECHNICAL ANALYSIS
BTC/USDT
According to CoinShares’ weekly report, digital asset investment products saw net inflows totaling $48 million last week. While inflows approached $1 billion in the first half of the week, there was an outflow of $940 million in the second half of the week as the minutes of the FED meeting and macroeconomic data were published. With this development, we can say that Bitcoin sentiment has shifted to economic data. On January 20, after the inauguration of D.Trump, a new Trump effect can be expected in sentiment. On the other hand, Microstategy, which continued to buy Bitcoin for the tenth consecutive week, paid 243 million dollars for 2530 Bitcoin.
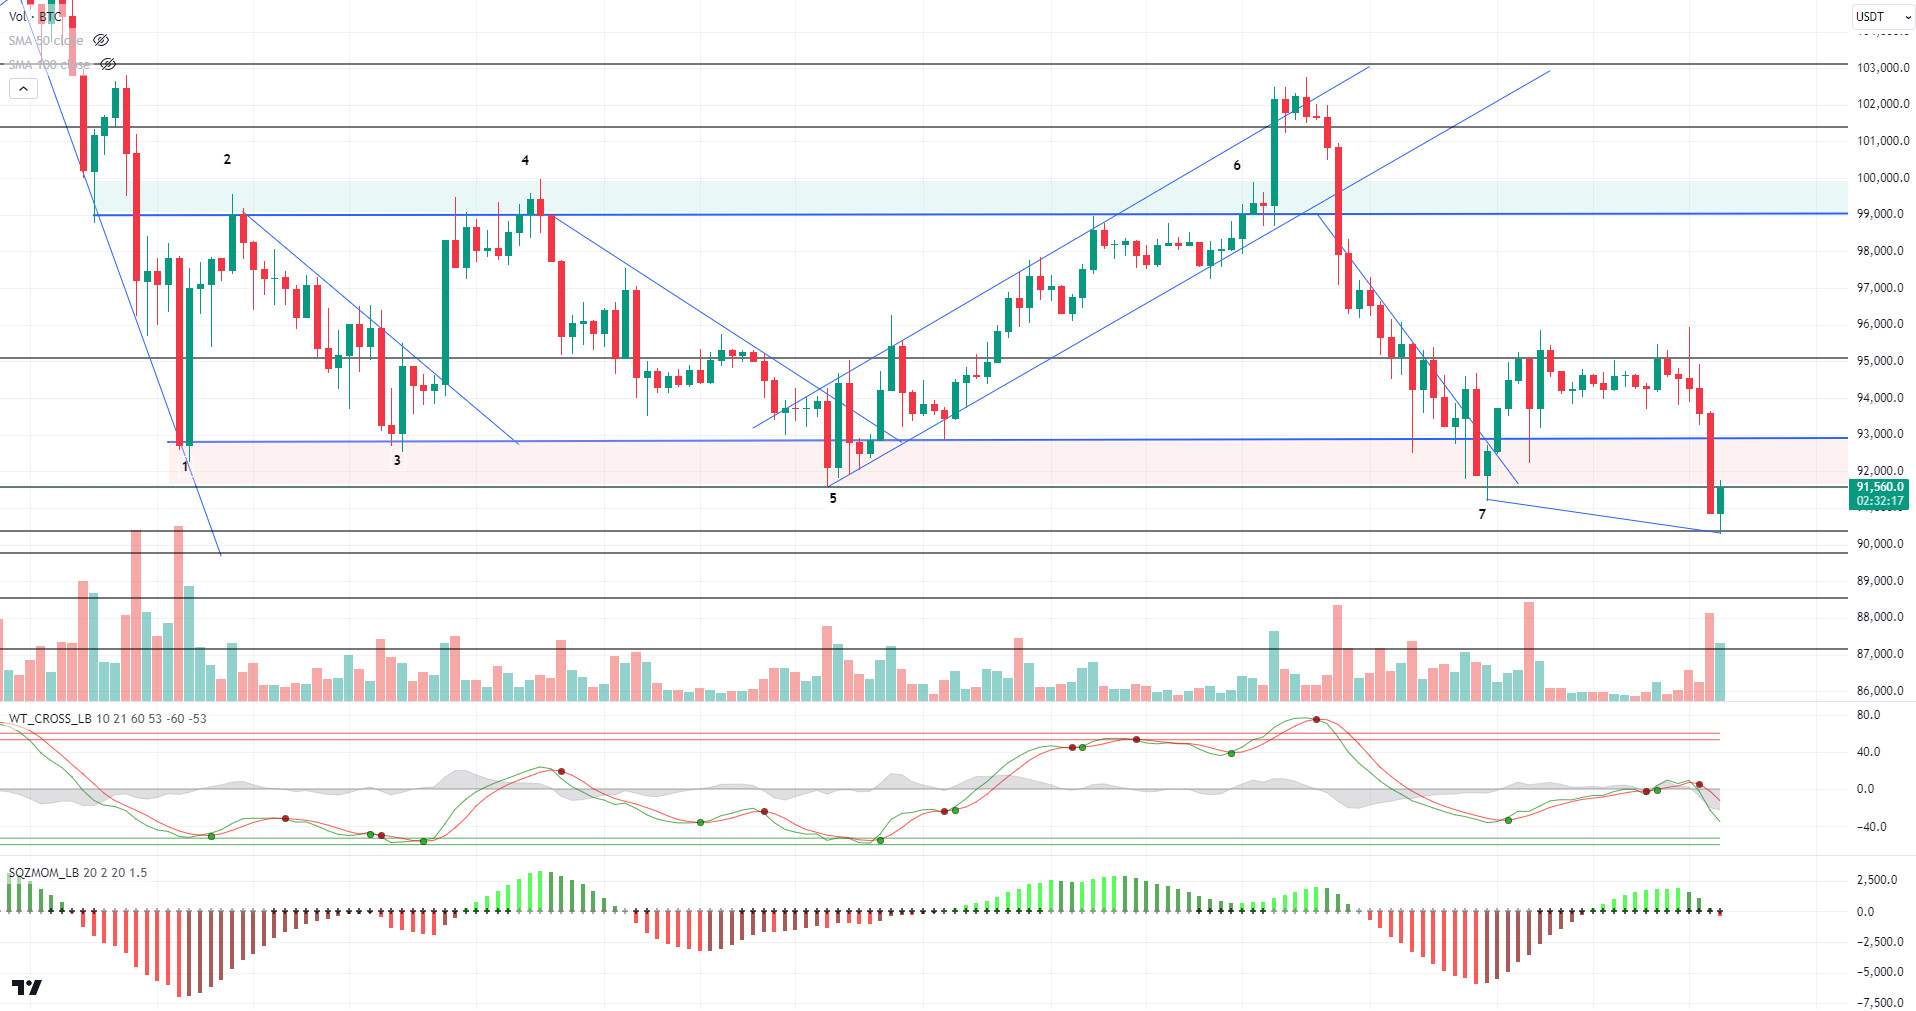
Looking at the technical outlook, BTC, which failed to break the major resistance level of 95,000, fell to 90,300 with the loss of the 92,800 support level. In the previous analysis, we stated that technical oscillators gave a sell signal and that the 90,000 and 91,000 levels were the target zone on the liquidation weekly chart. As a matter of fact, BTC, which has cleared this zone where long transactions are accumulating, has corrected the decline and turned its direction upwards again and is trading at 91,100. We can say that technical oscillators continue to maintain the sell signal on hourly charts and momentum has weakened well. We can say that closes above 92,800 are important for the uptrend to continue and the 95,000 level may be the target point again. In case the decline deepens, the 90,300 level appears as a support point, while we will follow the 89,700 level, which is one of the minor support levels in case of a downward break.
Supports 91,700 – 90,000 – 89,700
Resistances 92,800 – 95,000 – 97,200

ETH/USDT
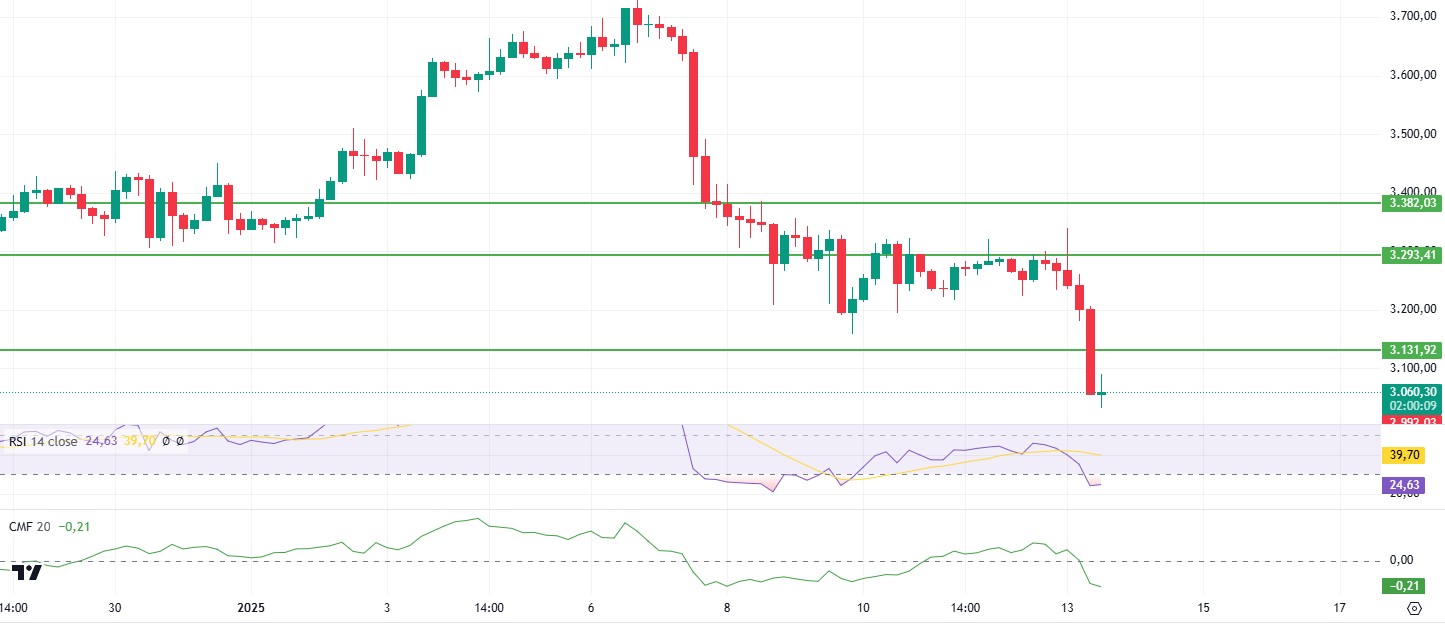
After retreating as low as 3,200 in the morning hours, ETH lost this level and fell sharply to as low as 3,050. While it is currently pricing in strong support zones, it can be said that the market is in the decision-making phase.
One of the most important details in the technical indicators is the positive divergence in the Relative Strength Index (RSI). This indicates that there may be a recovery in momentum despite falling prices. Similarly, a positive divergence is also observed on Chaikin Money Flow (CMF).
These indicators support the possibility of an upward reaction movement if the price finds support at current levels. However, if 2,992 support is broken, a sharp selling pressure may occur. Maintaining this level is critical for the price to recover to 3,200 and above. Otherwise, lower levels may become a target. To summarize, the 2,992 level plays a decisive role for the direction of ETH and the market continues to search for balance in this region.
Supports 2,992 – 2,890 – 2,781
Resistances 3,131 – 3,293 – 3,380

XRP/USDT
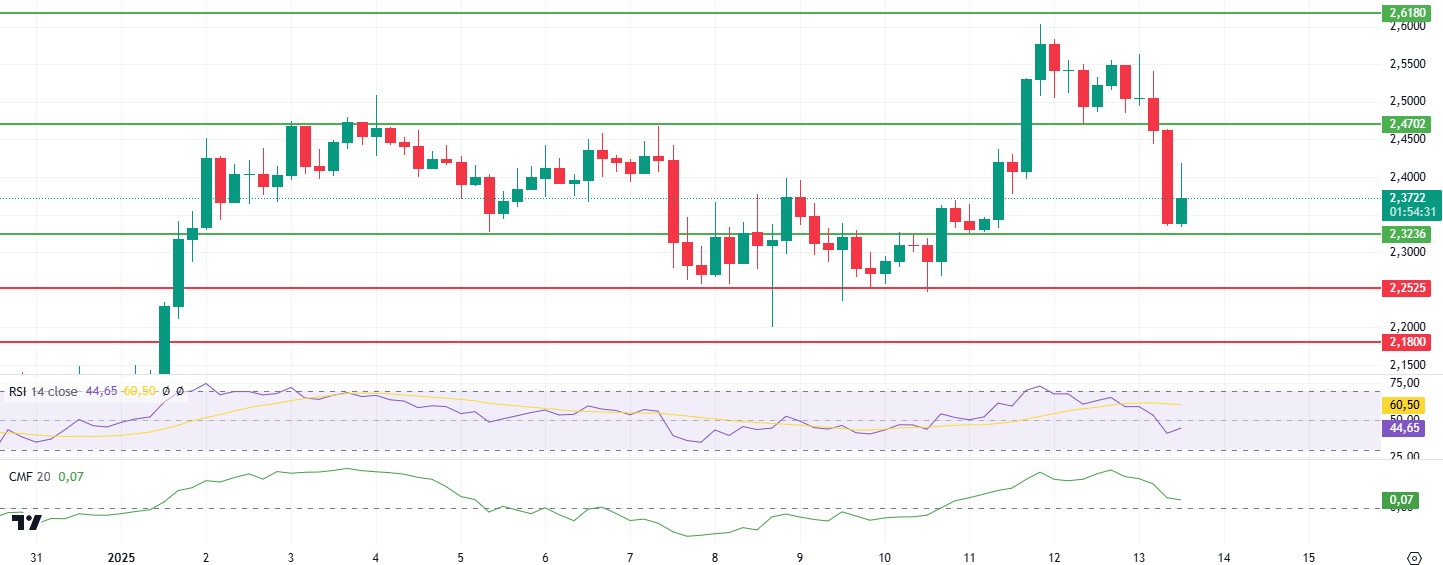
XRP, which fell to 2.32 again during the day, has reacted from this support and is slightly upward.
With this price action, the negative picture in the Chaikin Money Flow (CMF) and Relative Strength Index (RSI) indicators seems to have paused. Especially the positive divergence of the RSI indicator upward and gaining momentum contributes to the positive outlook. Although CMF has declined to the zero zone, it is seen that positive divergence has occurred and buyers may regain strength.
In the light of this data, unless 2.32 support is lost during the day, the price can be expected to rise to 2.47 levels again. Loss of the 2.32 level may disrupt the positive outlook and cause pullbacks to lower support levels.
Supports 2.3236 – 2.2525 – 2.1800
Resistances 2.4702 – 2.6180 – 2.8528

SOL/USDT
Mango Markets, a decentralized exchange based in Solana, is ceasing operations following legal issues and an SEC settlement.
Solana has fallen 5.82% in the last 24 hours to price at 176.88, keeping pace with the overall crypto market decline. On the 4-hour timeframe, the 50 EMA (Blue Line) broke the 200 EMA (Black Line) to the downside. This increased selling pressure and caused a pullback. When we examine the Chaikin Money Flow (CMF)20 indicator, it is seen that money outflows are intense, moving from the negative zone to the positive zone during the day. However, the Relative Strength Index (RSI)14 indicator is moving to the oversold level. At the same time, positive mismatch should be taken into account. This could be a bullish harbinger. The 200.00 level appears to be a very strong resistance point in the rises driven by both the upcoming macroeconomic and Solana ecosystem news. If it breaks here, the rise may continue. In case of retracements for the opposite reasons or due to profit sales, the 163.80 support level can be triggered. If the price comes to these support levels, a potential bullish opportunity may arise if momentum increases.
Supports 170.72 – 163.80 – 150.67
Resistances 181.75 – 189.54 – 200.00

DOGE/USDT
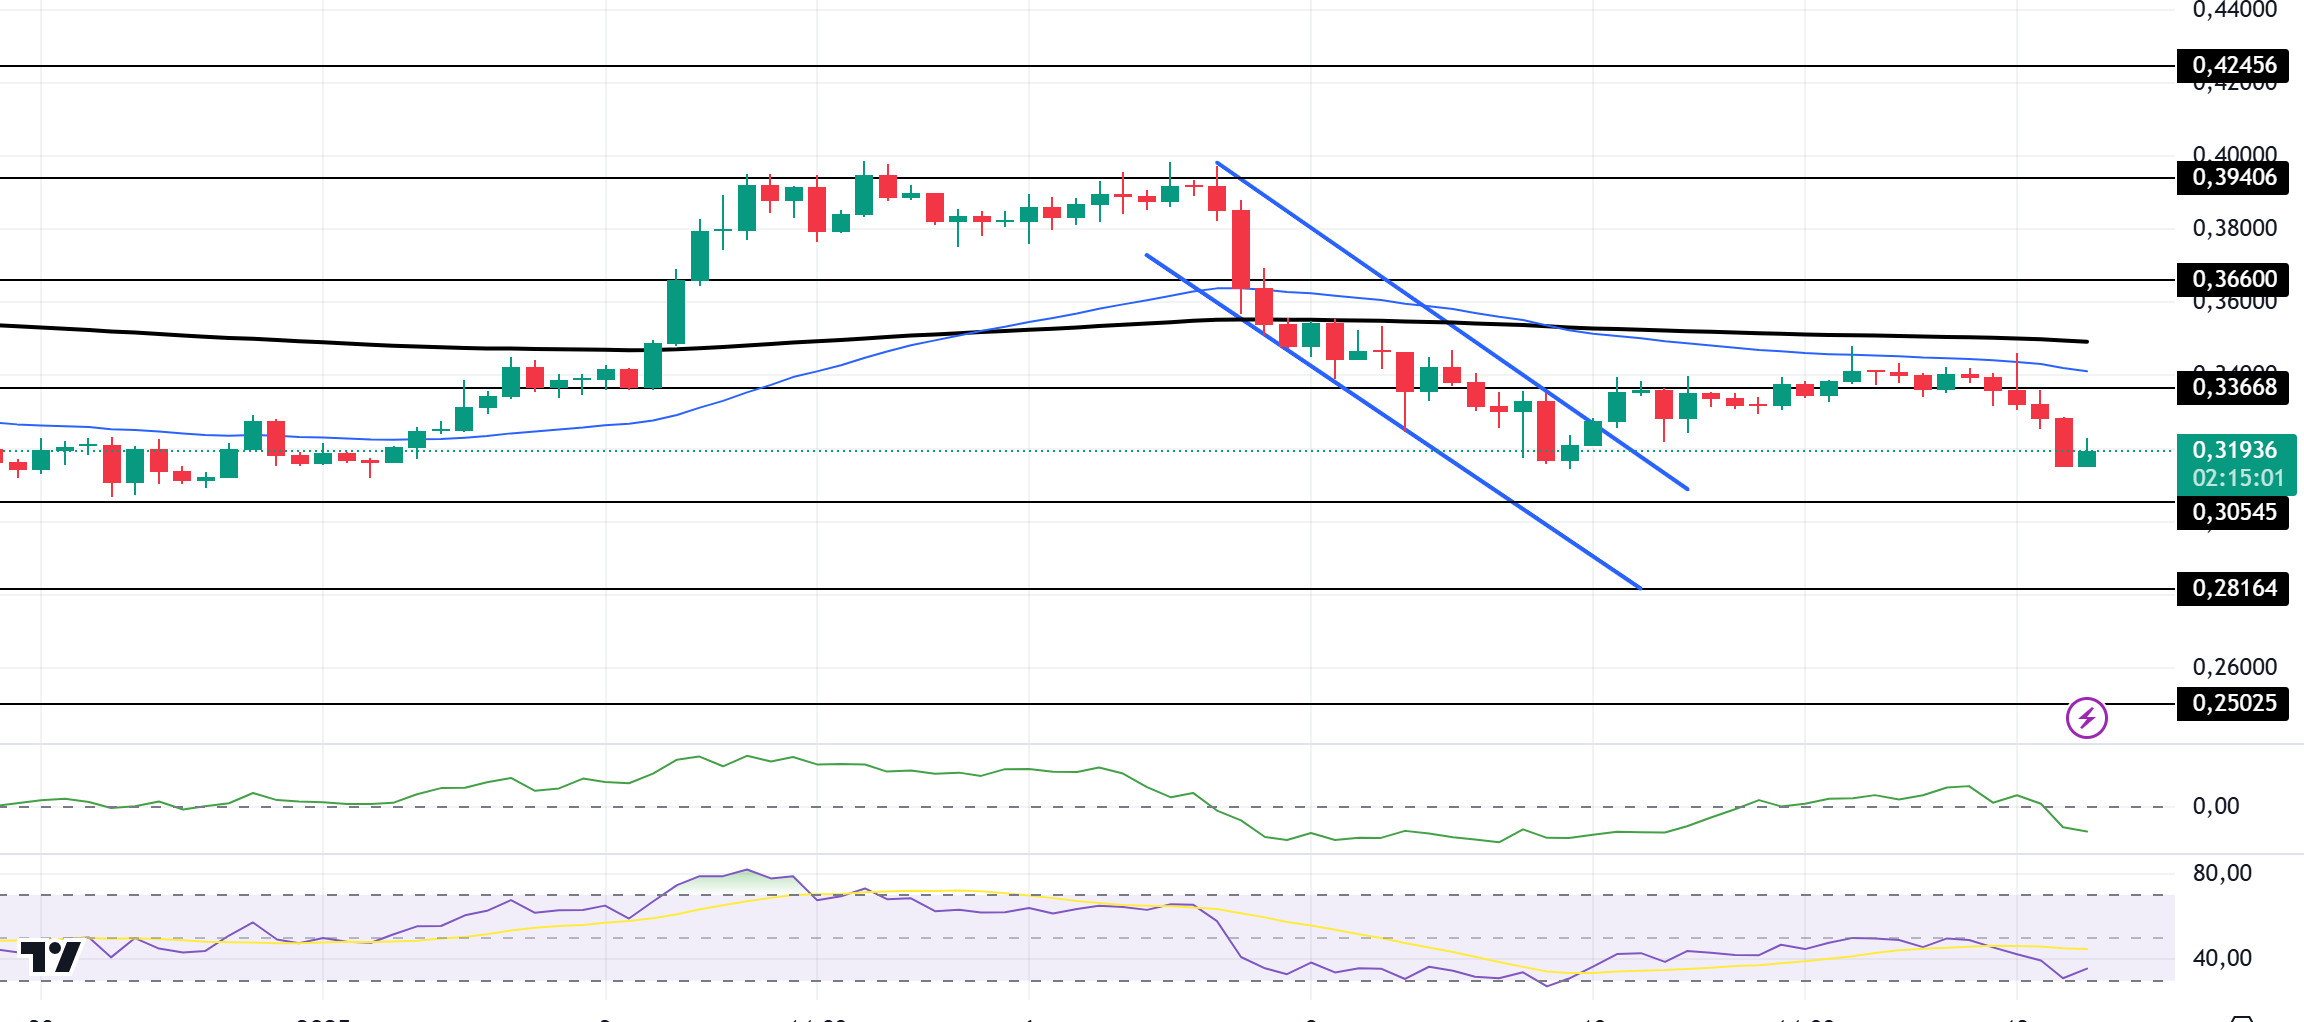
Doge has kept pace with the overall crypto market decline, falling 5.15% in the last 24 hours to price at 0.3200. Looking at the chart, the asset is below the 50 EMA (Blue Line) and 200 EMA (Black Line) on the 4-hour timeframe. At the same time, the price tested the 50 EMA as resistance but failed to break this level and retreated. This may increase bearish pressure. When we examine the Chaikin Money Flow (CMF)20 indicator, it seems that money outflows have increased by moving into the negative zone. However, Relative Strength Index (RSI)14 is positioned in the oversold zone. All these may increase the selling pressure. The 0.39406 level appears to be a very strong resistance point in the rises due to political reasons, macroeconomic data and innovations in the DOGE coin. In case of possible pullbacks due to political, macroeconomic reasons or negativities in the ecosystem, the 0.28164 level, which is the base level of the trend, is an important support. If the price reaches these support levels, a potential bullish opportunity may arise if momentum increases.
Supports 0.30545 – 0.28164 – 0.25025
Resistances 0.33668 – 0.36600 – 0.39406

LEGAL NOTICE
The investment information, comments and recommendations contained herein do not constitute investment advice. Investment advisory services are provided individually by authorized institutions taking into account the risk and return preferences of individuals. The comments and recommendations contained herein are of a general nature. These recommendations may not be suitable for your financial situation and risk and return preferences. Therefore, making an investment decision based solely on the information contained herein may not produce results in line with your expectations.


