MARKET SUMMARY
Latest Situation in Crypto Assets
| Assets | Last Price | 24h Change | Dominance | Market Cap |
|---|---|---|---|---|
| BTC | 96,526.45 | 3.03% | 56.13% | 1,91 T |
| ETH | 3,459.65 | 3.73% | 12.26% | 417,71 B |
| XRP | 2.393 | 10.69% | 4.05% | 137,83 B |
| SOLANA | 207.86 | 9.50% | 2.95% | 100,48 B |
| DOGE | 0.3386 | 6.79% | 1.47% | 50,06 B |
| CARDANO | 0.9644 | 11.77% | 1.00% | 33,93 B |
| TRX | 0.2630 | 3.73% | 0.67% | 22,74 B |
| AVAX | 39.90 | 11.30% | 0.48% | 16,41 B |
| LINK | 22.49 | 11.56% | 0.42% | 14,42 B |
| SHIB | 0.00002265 | 7.66% | 0.39% | 13,39 B |
| DOT | 7.231 | 8.25% | 0.33% | 11,15 B |
*Prepared on 1.2.2025 at 14:00 (UTC)
WHAT’S LEFT BEHIND
US jobless claims below expectations
Applications for unemployment benefits in the US were realized below expectations with 211 thousand in the week ending December 28. According to the seasonally adjusted data released by the US Department of Labor, the number of applications, which was previously announced as 219 thousand in the week ending December 21, was revised to 220 thousand. Economists participating in the Reuters survey estimated that jobless claims would be 222 thousand.
Bitfarms Produced 211 BTC in December, Holds 934 BTC in Reserves
Bitcoin mining company Bitfarms has released its December 2024 production report, according to Globenewswire. The company produced 211 BTC in December, compared to 207 BTC in November. This represents a 4% increase in average operating capacity and a 7% increase in Bitcoin mining difficulty. As of December 31, 2024, the company’s operational speed reached 12.8 EH/s, up 97% year-on-year. Bitfarms has produced a total of 4,928 BTC since the beginning of 2024.
Arbitrum Foundation to Fund Ethereum News Weekly
Ninal Rong, Arbitrum Foundation’s head of partnerships, announced on the X platform that the foundation plans to provide financial support to Ethereum News Weekly. It was also stated that foundation officials will contact Ethereum News Weekly founder Evan Van Ness via private message.
T3 Financial Crimes Unit Freezes 100 Million USDT in Tron
The T3 Financial Crimes Unit (T3 FCU), established in September 2024, has frozen a total of 100 million USDT used by illegal actors on the Tron network, CoinDesk reported. T3 uses blockchain monitoring tools provided by TRM Labs to help Tron and Tether detect illegal transactions. Tron follows Ethereum as the second largest USDT network, with nearly $60 billion in USDT issuance. Ethereum’s total USDT issuance is just over $75 billion.
HIGHLIGHTS OF THE DAY
Important Economic Calender Data
| Time | News | Expectation | Previous |
|---|---|---|---|
| 14:45 | US Final Manufacturing PMI (Dec) | 48.3 | 49.7 |
INFORMATION:
*The calendar is based on UTC (Coordinated Universal Time) time zone.
The economic calendar content on the relevant page is obtained from reliable news and data providers. The news in the economic calendar content, the date and time of the announcement of the news, possible changes in the previous, expectations and announced figures are made by the data provider institutions. Darkex cannot be held responsible for possible changes that may arise from similar situations
MARKET COMPASS
Wall Street is set to start the first trading day of the new year on a positive note. Futures contracts are pointing to a bullish start to the new day for all three major indices. Meanwhile, weekly jobless claims, the first employment data of the year for the US, were announced and we saw data below expectations last week. In this parallel, increases in the dollar index were observed. On the digital assets side, there was a positive start to the new year and we see that this continues but is somewhat limited due to the nature of the market. In the rest of the day, data from the US will continue to remain under the scrutiny of investors, and we think that the rise in cryptocurrencies may continue for now with intermediate respites. For the long term, we maintain our expectation that the main direction is up for the following reasons.
From the short term to the big picture.
The victory of former President Trump on November 5, which was one of the main pillars of our bullish expectation for the long-term outlook in digital assets, produced a result in line with our predictions. Afterwards, the appointments made by the president-elect and the increasing regulatory expectations for the crypto ecosystem in the US and the emergence of BTC as a reserve continued to take place in our equation as positive variables. Although it is expected to continue at a slower pace, the FED’s signal that it will continue its interest rate cut cycle and the volume in crypto asset ETFs indicating an increase in institutional investor interest (in addition to MicroStrategy’s BTC purchases, BlackRock’s BTC ETF options starting to trade…) support our upward forecast for the big picture for now. In the short term, given the nature of the market and pricing behavior, we think it would not be surprising to see occasional pauses or pullbacks in digital assets. However, at this point, it is worth emphasizing again that the fundamental dynamics continue to be bullish.
TECHNICAL ANALYSIS
BTC/USDT
Bitcoin, which followed a similar course to previous years, started 2025 with an upward trend in its price with the increasing risk perception in line with our expectations. With a relatively calm agenda, Bitcoin followed the US Unemployment applications today. Unemployment claims, which were announced as 211K below expectations, indicate that the improvement in the labor market continues. Although no interest rate cut is expected from the FED in January, improving data may increase the pace of interest rate cuts in the coming months.
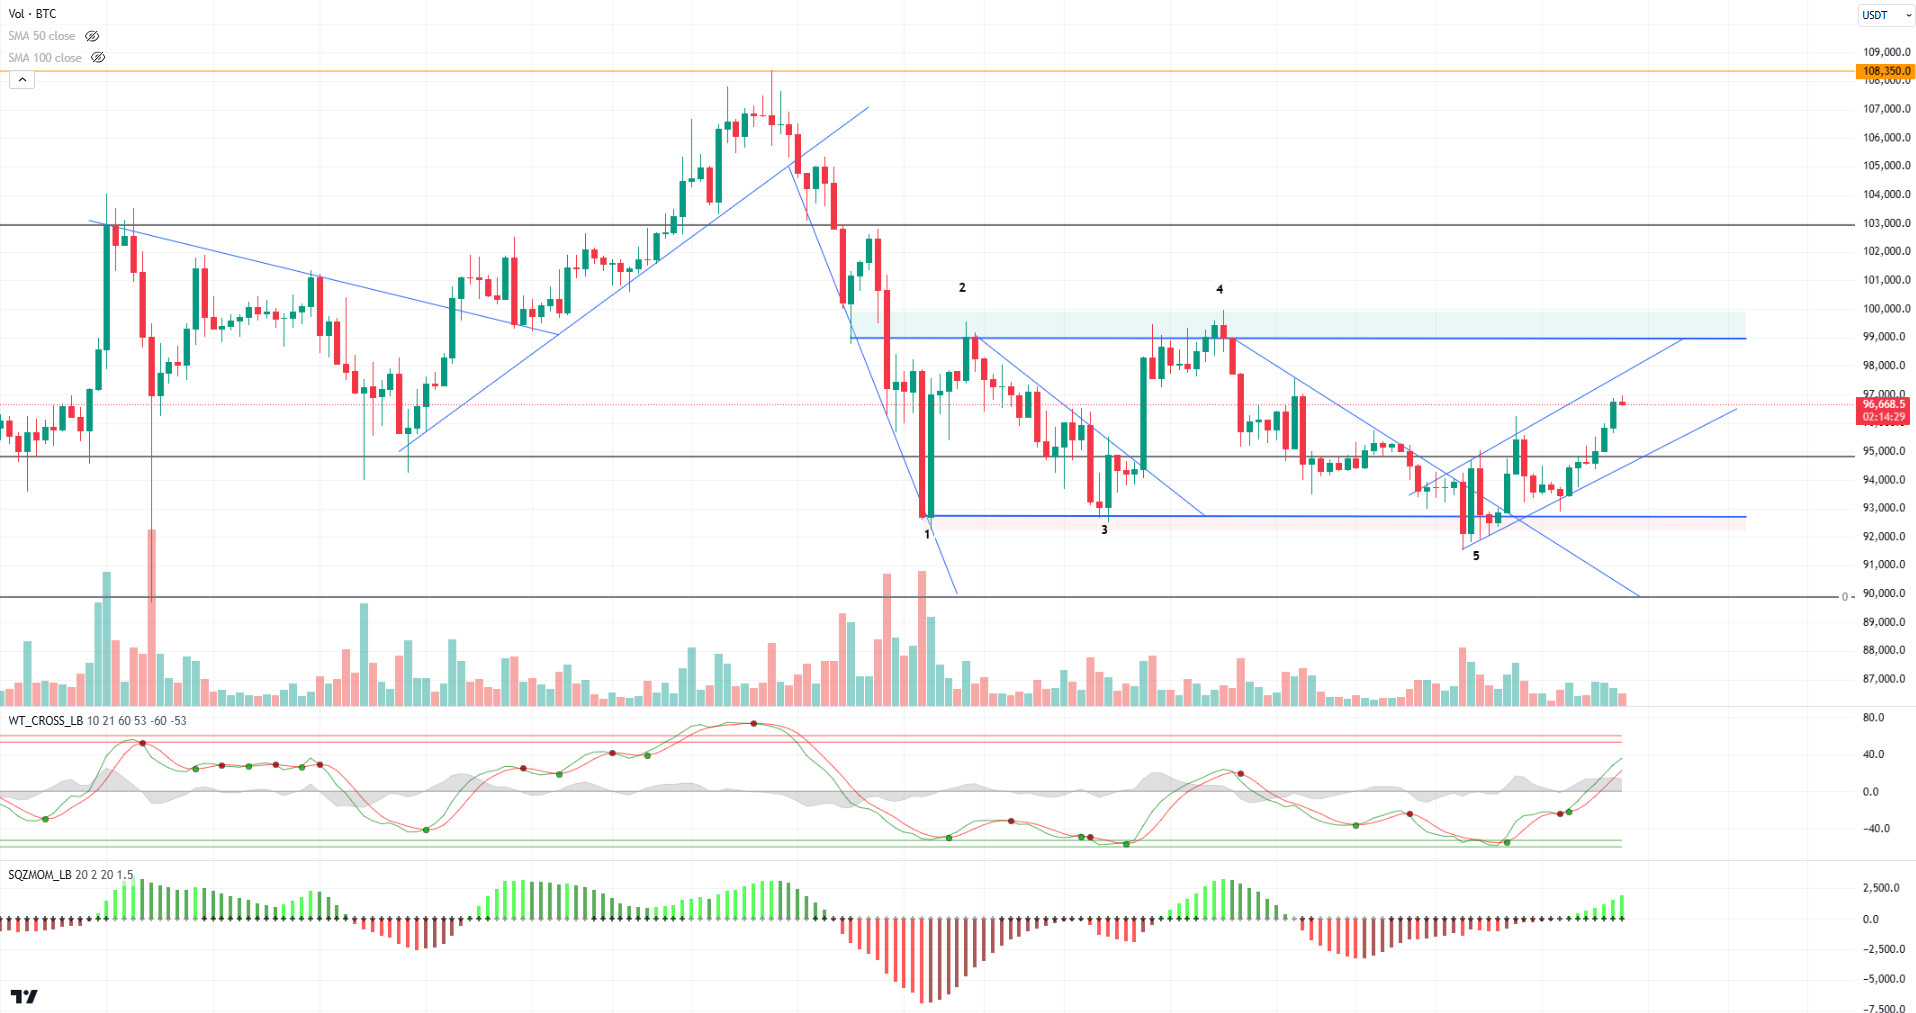
Looking at the technical outlook, BTC formed a bullish channel with the break of the falling trend structure. BTC, which continues pricing in a rectangle formation, is currently trading at 96,500. While technical oscillators continue to maintain their buying signal, the momentum indicator continues to gain strength. In the continuation of the rise, 97,200 is the intermediate resistance level, while the 99,100 level can be targeted if it is passed. In a possible pullback, we will follow the 95,000-level major support point.
Supports 95,000 – 92,800 – 90,000
Resistances:97,200 – 99,100 – 101,400
ETH/USDT
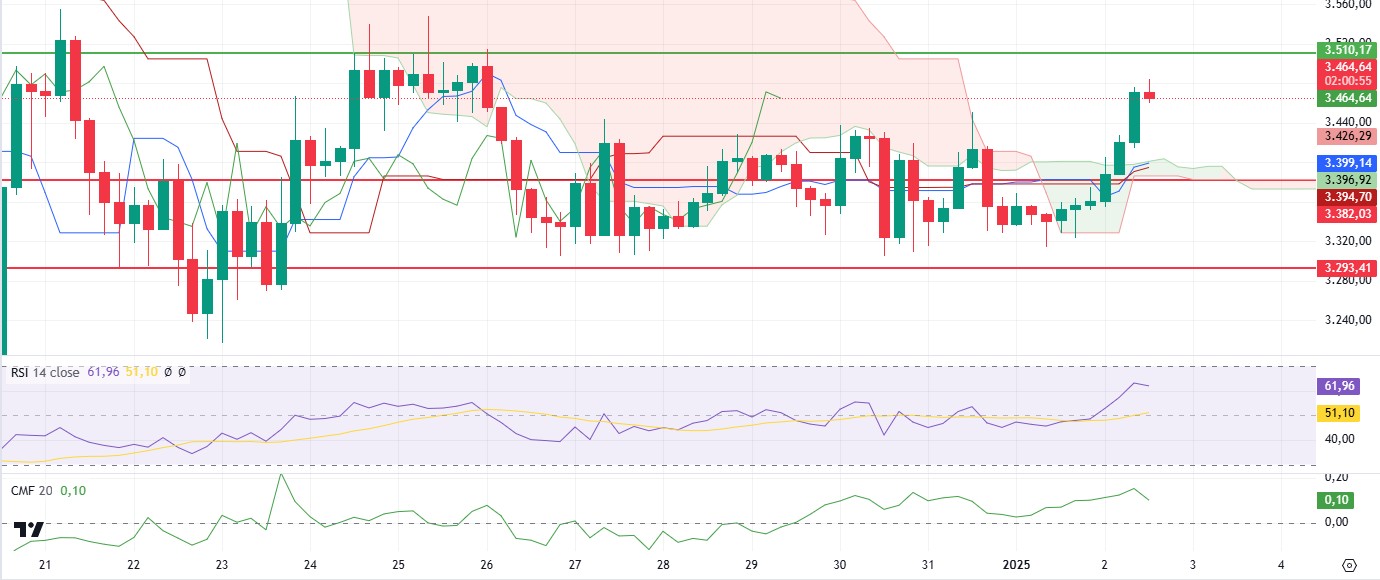
Ethereum continues to rally after managing to break above key resistance levels and the kumo cloud after its overnight rally. At 3,470 levels, the Cumulative Volume Delta (CVD) is facing selling pressure from the spot side.
When we look at the technical indicators, it is noticeable that a buy signal has been formed in the Ichimoku indicator as the tenkan level crosses the kijun level upwards. In addition, the Relative Strength Index (RSI) indicator continues to rise in a healthy way without showing negative divergence as the price has taken the previous peak level. Chaikin Money Flow (CMF), on the other hand, has not displayed a negative outlook in general, although it has experienced a slight pullback due to selling pressure from the spot side.
Considering all this technical data, Ethereum can be expected to continue its rise in the evening hours and test the resistance at 3,510. A break of this level could pave the way for higher highs. However, the kumo cloud level is critical as an important support point and the declines may deepen if this level is broken.
Supports 3,382 – 3,293- 3,131
Resistances 3,510 – 3,670 – 3,841
XRP/USDT
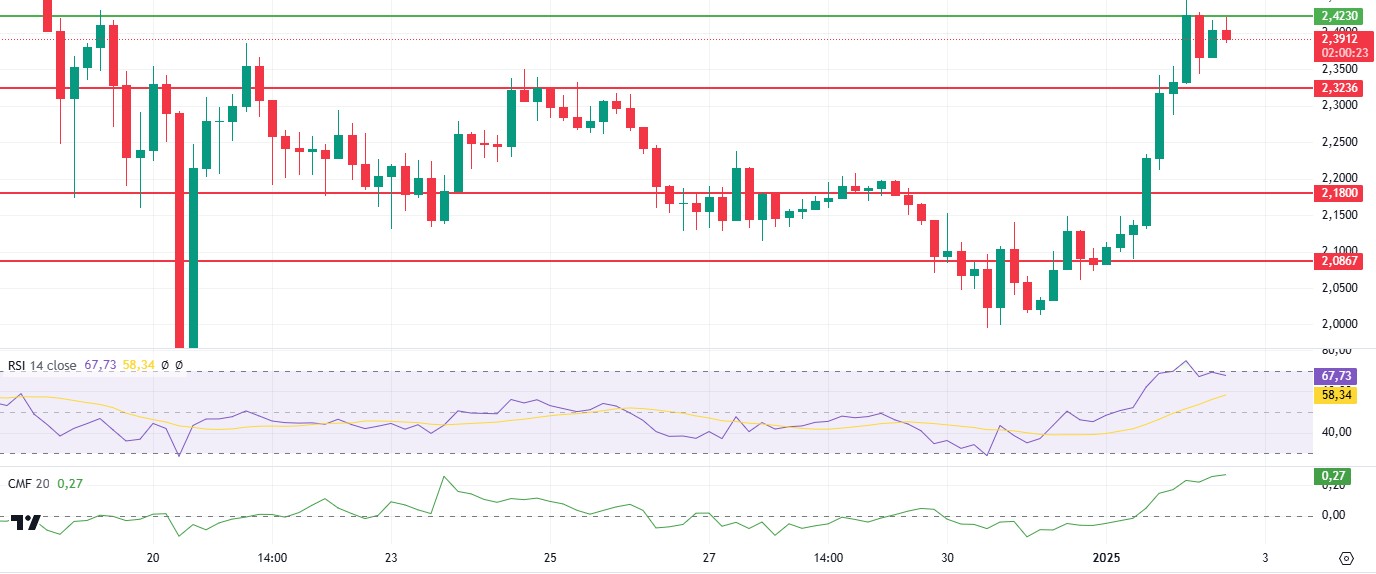
XRP rose as high as 2.42 on a bullish wave yesterday, but two rejections from this area suggest that the price’s upside momentum is weakening. The RSI indicator has moved out of the overbought zone and headed down, raising the possibility of a correction in the price action. On the other hand, Chaikin Money Flow (CMF) remains in positive territory, indicating that capital flows are still in favor of buyers.
In order for XRP to continue its rise, the 2.42 level needs to be broken in volume. Once this resistance level is breached, the upward movement can be expected to accelerate. However, two rejections from this region indicate that the price risks retracing in the evening hours. The 2.32 level is critical as an intermediate support point. If this level is lost, there is a risk of deepening declines.
As a result, if XRP fails to breach the 2.42 resistance, the price is likely to pull back towards the 2.32 support. However, the positive outlook of the CMF and the fact that the price is at critical levels signal that the upside is not completely over. Support and resistance levels need to be closely monitored.
Supports 2.3236 – 2.1800 – 2.0867
Resistances 2.4230 – 2.6180 – 2.8528
SOL/USDT
Two major airdrops are expected in the Solana ecosystem. Scheduled for January, hundreds of millions of dollars worth of tokens have been promised by project teams to eligible users.
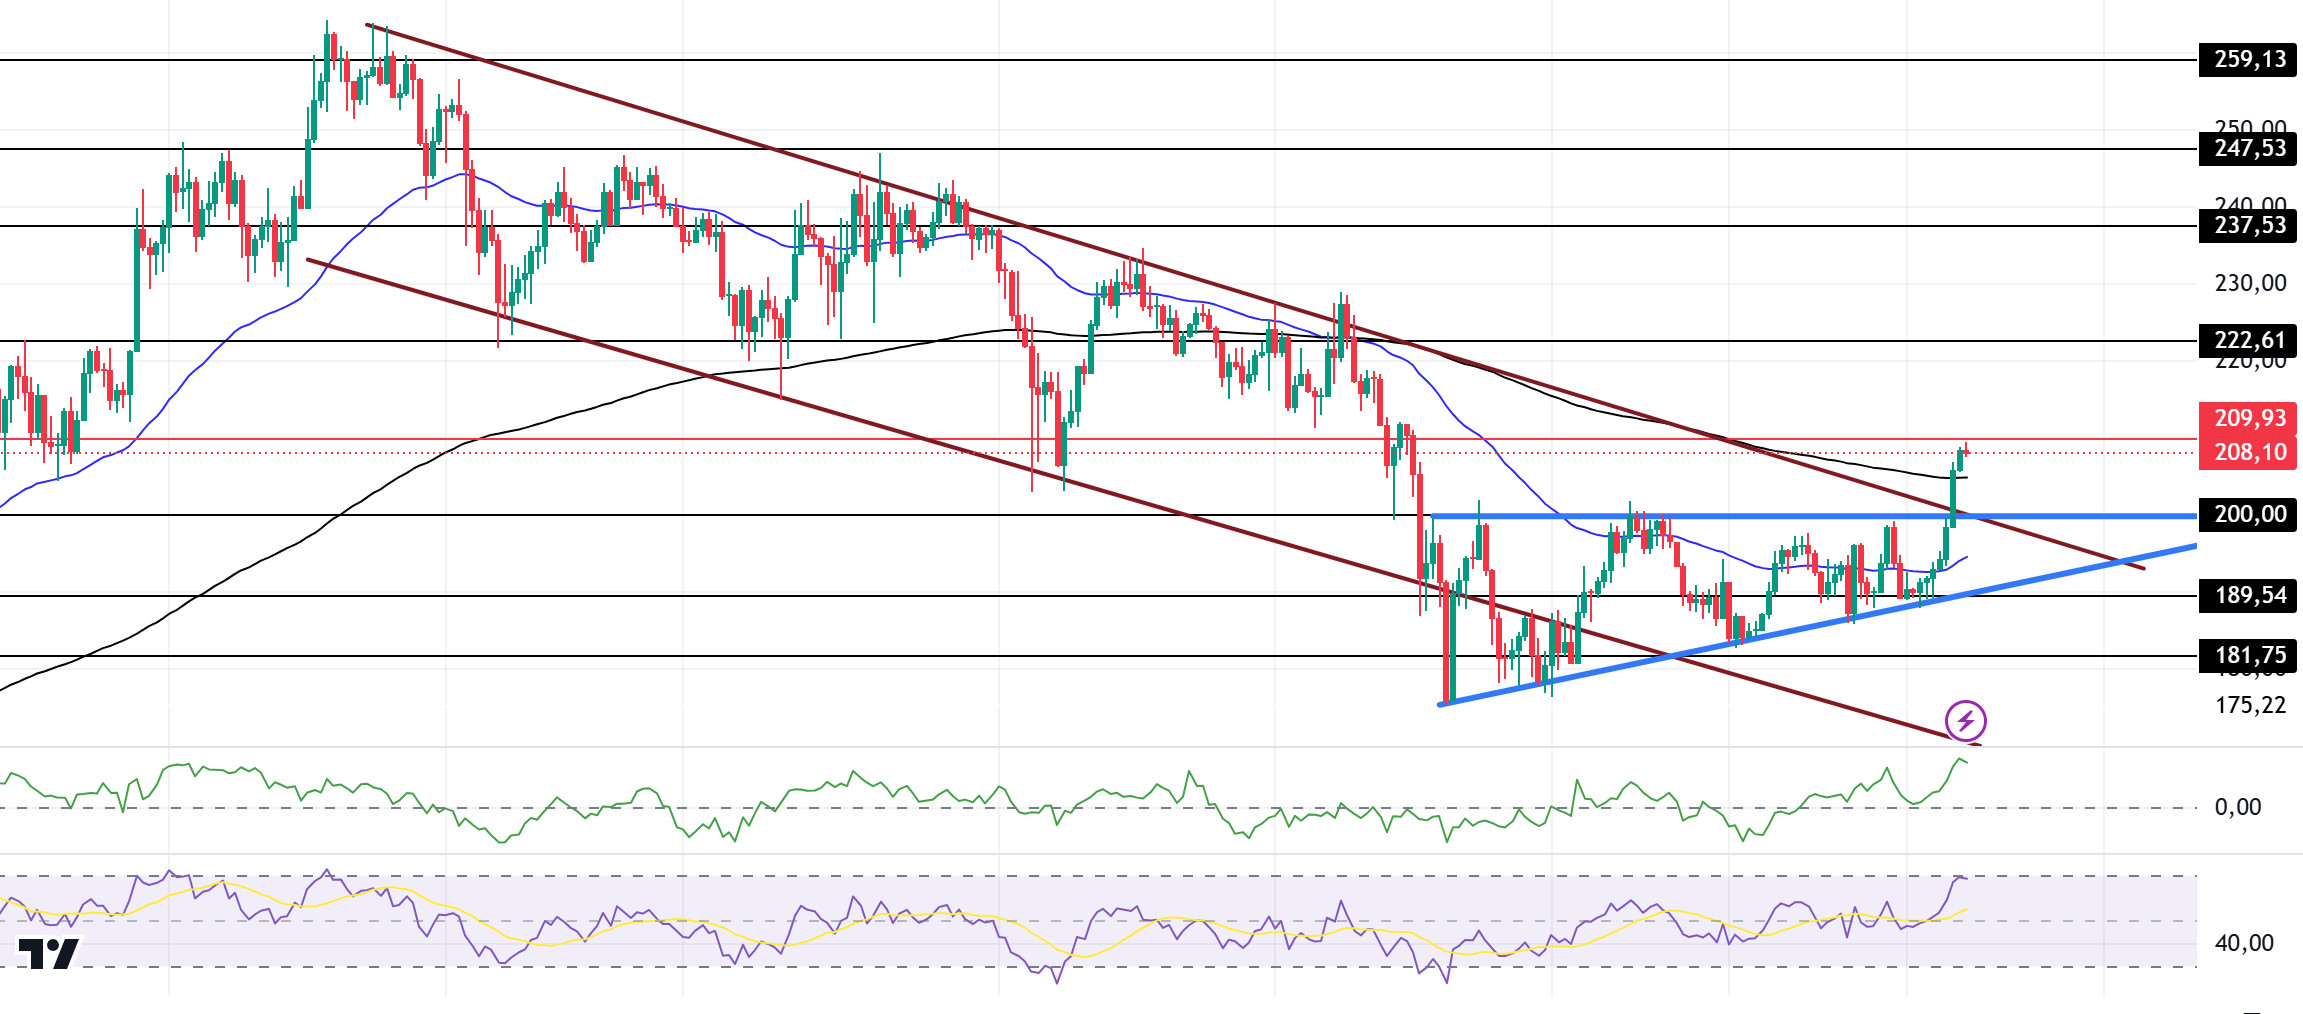
The LEFT has broken the ascending triangle pattern to the upside. This could be a bullish start. On the 4-hour timeframe, the 50 EMA (Blue Line) is below the 200 EMA (Black Line). The asset tested the 50 EMA resistance during the day and broke it to the upside and tested the 200 EMA, which could also break here and start a possible bull story. At the same time, it broke the downtrend that has been going on since November 22 to the upside and increased its momentum. When we examine the Chaikin Money Flow (CMF)20 indicator, it is in positive territory and money inflows are gradually increasing. However, the Relative Strength Index (RSI)14 indicator reached the overbought level. On the other hand, the 209.93 level appears as a very strong resistance place in the rises driven by both the upcoming macroeconomic data and the news in the Solana ecosystem. If it breaks here, the rise may continue. In case of retracements for the opposite reasons or due to profit sales, the 181.75 support level can be triggered. If the price reaches these support levels, a potential bullish opportunity may arise if momentum increases.
Supports 200.00 – 189.54 – 181.75
Resistances 209.93 – 222.61 – 237.53
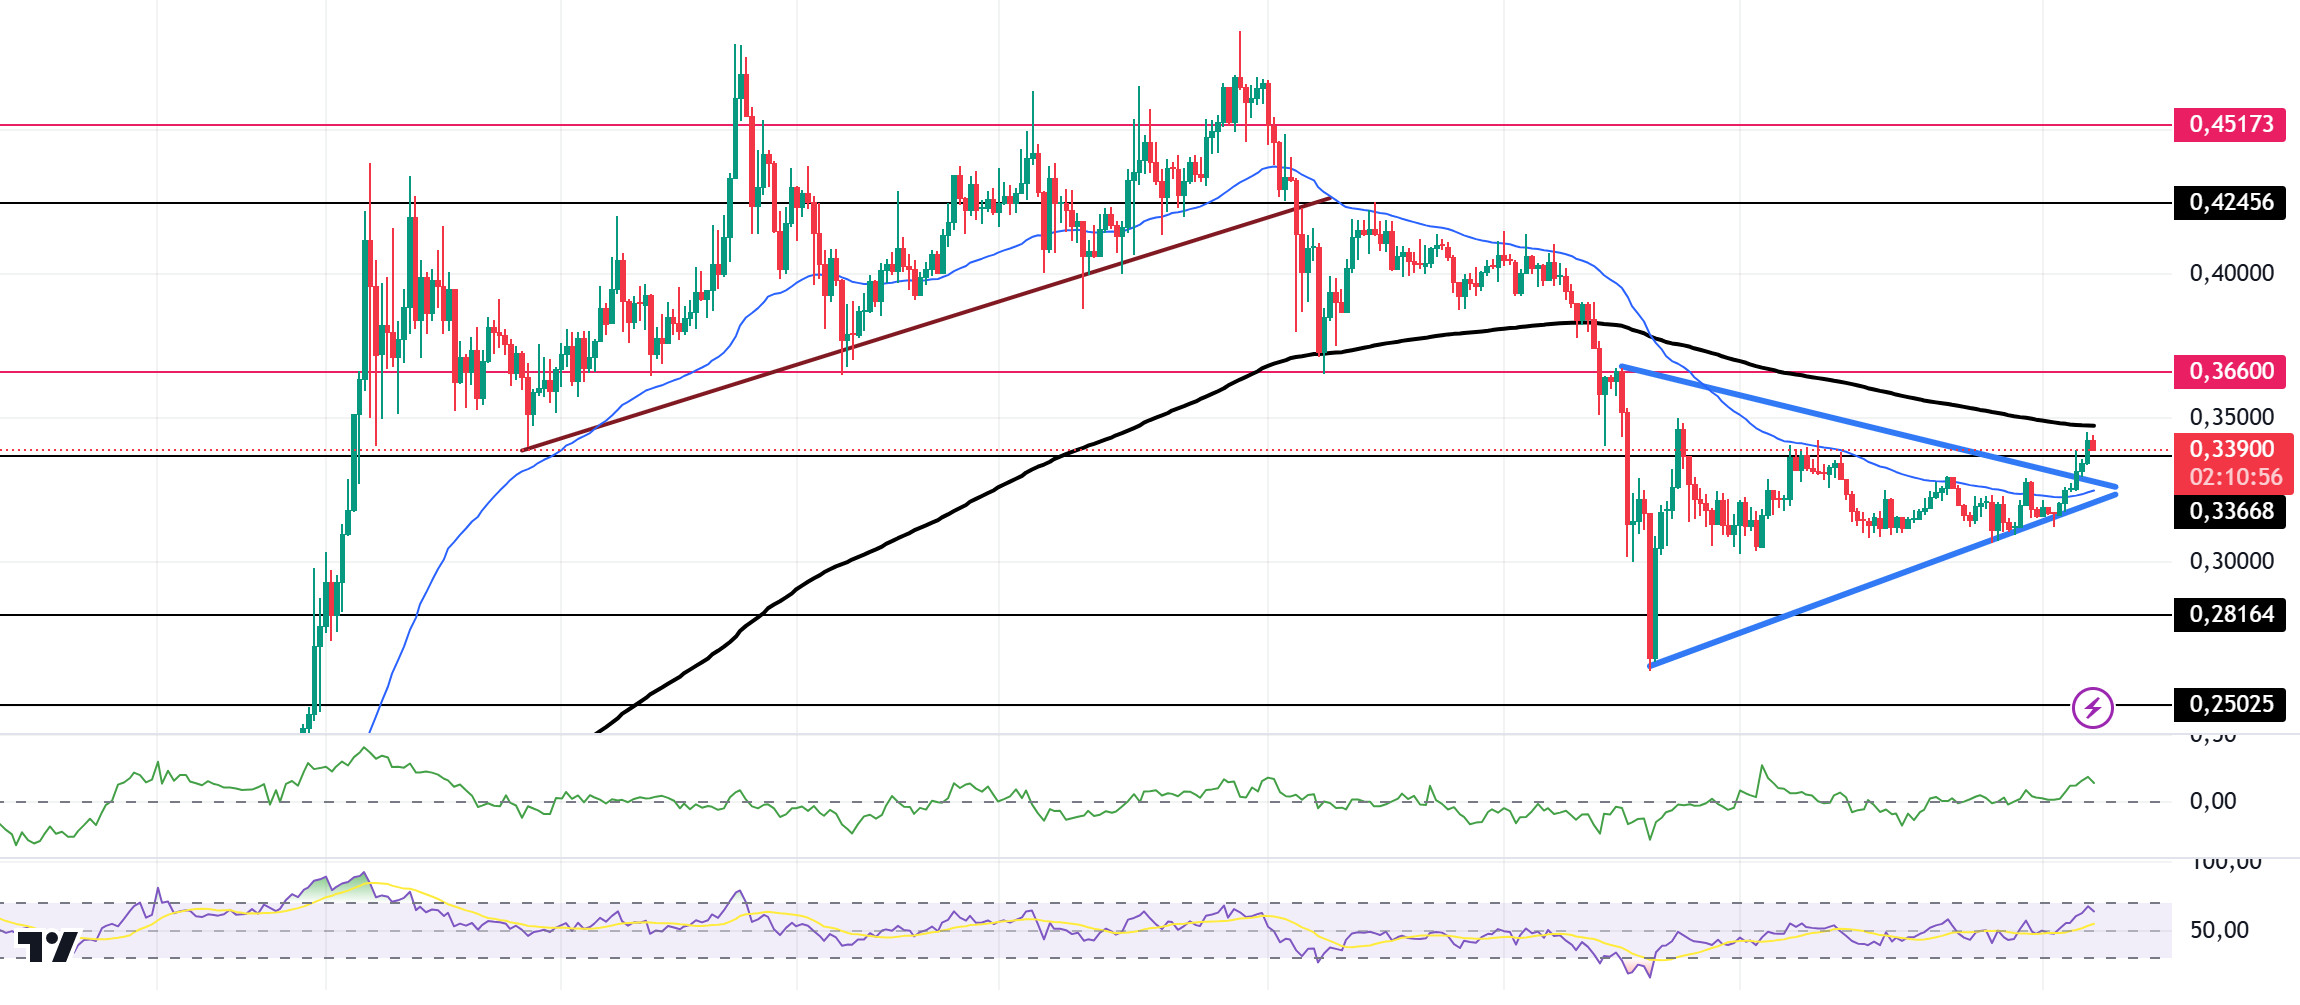
DOGE/USDT
When we look at the chart, the asset, which has been moving sideways since December 20, gained momentum with the increase in volume and broke both the 0.33668 resistance, which is the ceiling of the horizontal level, and the symmetrical triangle pattern upwards. The asset is currently testing the 200 EMA (Black Line) as resistance. If it breaks here, the uptrend may continue. On the 4-hour timeframe, the 50 EMA (Blue Line) continues to be below the 200 EMA. When we examine the Chaikin Money Flow (CMF)20 indicator, although it stands in the positive zone, money outflows are slightly higher. However, Relative Strength Index (RSI)14 is in the overbought zone. The 0.36600 level stands out as a very strong resistance point in the rises driven by both the upcoming macroeconomic data and the innovations in the Doge coin. If DOGE catches a new momentum and rises above this level, the rise may continue strongly. In case of possible pullbacks due to macroeconomic reasons or negativity in the ecosystem, the 0.28164 level, which is the base level of the trend, is an important support. If the price reaches these support levels, a potential bullish opportunity may arise if momentum increases.
Supports 0.33668 – 0.28164 – 0.25025
Resistances 0.36600 – 0.42456 – 0.45173
LEGAL NOTICE
The investment information, comments and recommendations contained herein do not constitute investment advice. Investment advisory services are provided individually by authorized institutions taking into account the risk and return preferences of individuals. The comments and recommendations contained herein are of a general nature. These recommendations may not be suitable for your financial situation and risk and return preferences. Therefore, making an investment decision based solely on the information contained herein may not produce results in line with your expectations.


