
MARKET SUMMARY
Latest Situation in Crypto Assets
| Assets | Last Price | 24h Change | Dominance | Market Cap. |
|---|---|---|---|---|
| BTC | 104,491.69 | -2.96% | 57.81% | 2,07 T |
| ETH | 3,298.56 | -0.99% | 11.10% | 398,28 B |
| XRP | 3.136 | -4.66% | 5.03% | 180,67 B |
| SOLANA | 241.52 | -5.71% | 3.27% | 117,61 B |
| DOGE | 0.3684 | -0.87% | 1.51% | 54,39 B |
| CARDANO | 0.9974 | -5.89% | 0.98% | 35,09 B |
| TRX | 0.2414 | -1.10% | 0.58% | 20,80 B |
| LINK | 25.66 | -1.08% | 0.46% | 16,44 B |
| AVAX | 36.54 | -2.69% | 0.42% | 15,02 B |
| SHIB | 0.00002068 | -1.76% | 0.34% | 12,16 B |
| DOT | 6.552 | -0.46% | 0.28% | 10,09 B |
*Prepared on 1.21.2025 at 14:00 (UTC)
WHAT’S LEFT BEHIND
Delayed Bitcoin Purchase from MicroStrategy
MicroStrategy, led by Michael Saylor, announced Bitcoin purchases for the 11th consecutive week. The company bought 11 thousand Bitcoins. 1.1 billion dollars was paid for BTCs. The average purchase was 101,191 dollars. With this purchase, the total number of BTC held by the company increased to 461 thousand.
2.2 billion Dollar Inflows to Crypto Funds
Last week, crypto funds saw net inflows of $2.2 billion as Donald Trump assumed the presidency. While Bitcoin remained the leader in these inflows, interest in XRP and other altcoins attracted attention.
Bitcoin Spot ETFs Net Inflows of $1.96 Billion
Bitcoin spot ETFs totalled $1.96 billion in net inflows last week. The single-day inflow of more than $ 1 billion on Friday broke a record.
BlackRock IBIT ETF: $746 million net inflows, historical cumulative net inflows: $38.41 billion.
Fidelity FBTC ETF: $680 million net inflows, historical cumulative net inflows: $12.84 billion.
Grayscale GBTC: $87.68 million net outflow, historical cumulative net outflow: $21.65 billion.
Trump’s CBDC Decree Awaited
Crypto policy leaders are waiting for Donald Trump to sign executive orders banning the creation of CBDCs (Central Bank Digital Currencies) and establishing a cryptocurrency committee. However, it is unclear when these decisions will be officially signed.
HIGHLIGHTS OF THE DAY
Important Economic Calender Data
*There are no important calendar developments for the rest of the day.
INFORMATION
*The calendar is based on UTC (Coordinated Universal Time) time zone.
The economic calendar content on the relevant page is obtained from reliable news and data providers. The news in the economic calendar content, the date and time of the announcement of the news, possible changes in the previous, expectations and announced figures are made by the data provider institutions. Darkex cannot be held responsible for possible changes that may arise from similar situations
MARKET COMPASS
Global markets, which are preparing for Trump’s second term, were partly relieved that the President spent his first day in the White House without taking any concrete action on tariffs. Still, Trump made references to tariffs on Canada and Mexico without mentioning China. Major digital assets, which declined after the new President’s speech yesterday, which ended without mentioning the word crypto, recovered slightly during European trading. Wall Street indices are expected to start the new day around 0.4% higher. In the rest of the day, under the assumption that there will be no surprise news flow, we think that the recent reaction rally may give way to horizontal price changes. However, it is worth noting that news flows from the Trump front should be closely monitored.
From the short term to the big picture.
The victory of former President Trump on November 5, which was one of the main pillars of our bullish expectation for the long-term outlook in digital assets, produced a result in line with our predictions. Afterwards, the appointments made by the president-elect and the increasing regulatory expectations for the crypto ecosystem in the US and the emergence of BTC as a reserve continued to take place in our equation as positive variables. Although Trump, who took over the presidency with the inauguration ceremony on January 20, did not say anything for the digital world, we maintain our expectations on the subject in the coming days. On the other hand, although it is expected to continue at a slower pace, the expectations that the FED will continue its interest rate cut cycle (for now) and the volume in ETFs based on crypto assets indicating an increase in institutional investor interest support our upward forecast for the big picture for now. In the short term, given the nature of the market and pricing behavior, we think it would not be surprising to see occasional pauses or pullbacks in digital assets. However, at this point, it is worth emphasizing again that we think that the fundamental dynamics continue to be bullish.
TECHNICAL ANALYSIS
BTC/USDT
Despite officially taking office today, Trump has yet to sign any executive order on cryptocurrencies. However, the market is still enthusiastically discussing the possibility of the US creating a Bitcoin strategic reserve. This possibility was raised by Trump last summer, sparking a great deal of speculation in the cryptocurrency market. At the time, the market placed the chances of this step being taken within the first hundred days of Trump’s inauguration at over 50%. However, according to Polymarket betting data, this rate has now dropped to 36%.
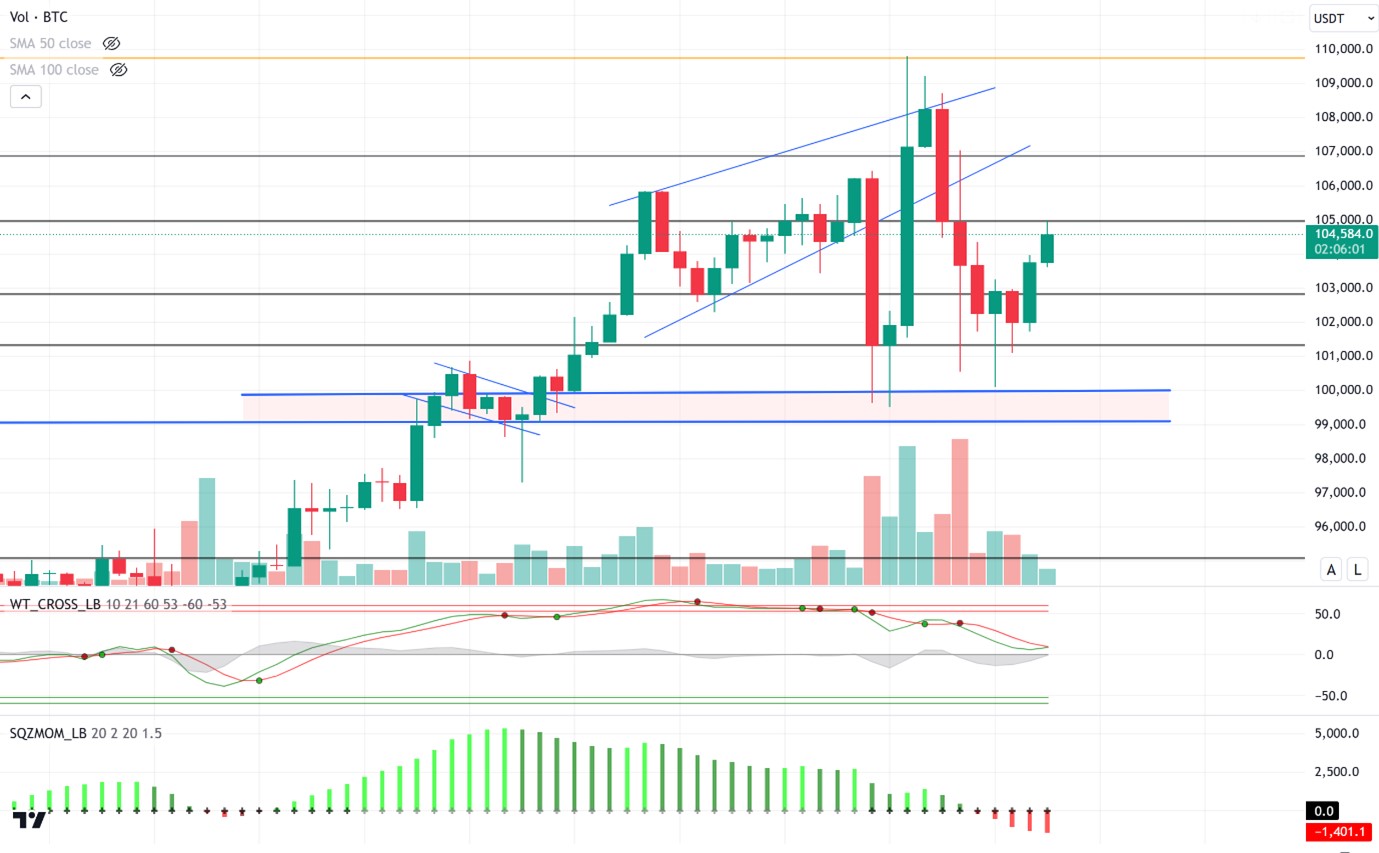
Looking at the technical outlook, the price, which fell to 101,700 during the day, managed to recover. Currently trading at 104,600, BTC tested the 105,000-resistance level. While the price, which could not exceed this level in the first attempt, is preparing for the second attempt, a weakening sales outlook is observed, although there is no buy signal from technical oscillators yet, while the momentum indicator is still gaining strength in the negative zone. The price, which gained bullish momentum before the D.Trump inauguration, managed to move the ATH level upwards. At the moment, we can say that the air of uncertainty prevails in the market and volatile movements can be observed in BTC. Hourly closes above 105,000 will be followed in the continuation of the rise, and in a possible pullback, 102,800 is an important support level to stay in the positive zone. It is worth noting that the long transactions between 95,000 and 100,000 levels on the liquidation weekly chart we mentioned earlier attracted attention.
Supports 102,800 – 101,400 – 100,000
Resistances 105,000 – 106,800 – 108,250
ETH/USDT
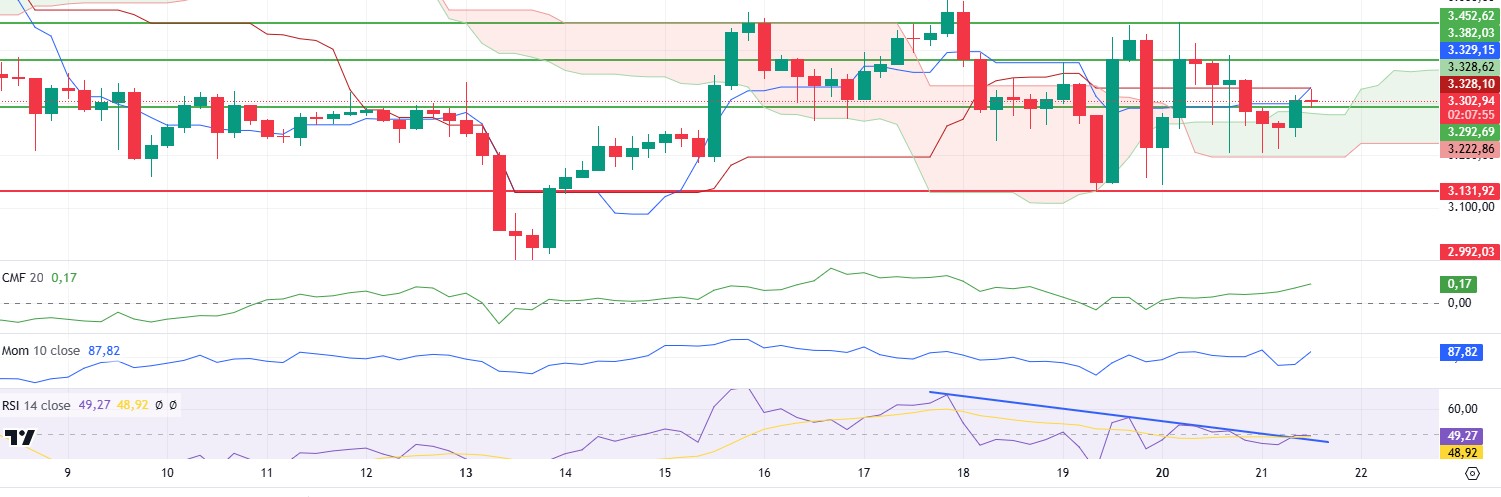
ETH regained the 3,292 level, reacting from the kumo cloud levels after the decline with the lack of mention of Bitcoin and cryptocurrencies at Donald Trump’s inauguration.
From a technical perspective, the intersection of tenkan-sen and kijun-sen levels on the Ichimoku indicator offers a potential buy signal. The fact that the price is trading above the kumo cloud supports the positive outlook and suggests that the trend is strengthening. Momentum is on the rise again and this is an important factor supporting the market’s upward movement. Moreover, the aggressive rise in the Chaikin Money Flow (CMF) indicator clearly shows that buyers are dominating the market. This stands out as a strong sign supporting price movements to the upside. The positive divergence in the RSI indicator acts as a catalyst for the upward movement of the price. However, there are signs of a slight weakening in the RSI and it is important that the trend line on the chart is not broken at this point.
In the light of this data, it is likely to see rises up to 3,382 in the evening and morning hours. However, closes below the 3,292 level may cause momentum to weaken and the price to retreat.
Supports 3,292 – 3,131 – 2,992
Resistances 3,382 – 3,452 – 3,565
XRP/USDT
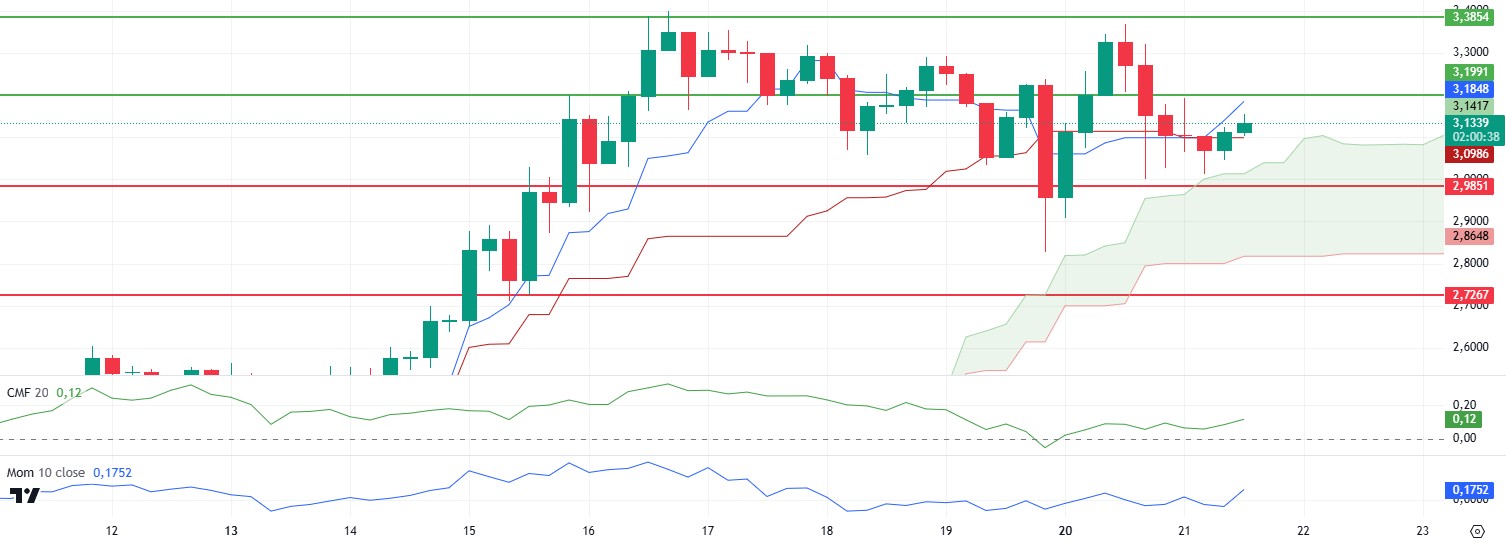
XRP, which fell to the upper band of the kumo cloud after yesterday’s decline, managed to rise above the 3.10 level again with the support it received from this region. Technical indicators for XRP, which is momentarily pricing in this region, are starting to look positive.
As mentioned in the morning analysis, the recovery in Momentum and Chaikin Money Flow (CMF) indicators after the purchases from these regions for XRP, which is pricing in critical support zones, looks very positive. The buy signal coming from the intersection of kijun and tenkan levels in the Ichimoku indicator also contributes to the positive outlook.
As a result, the price is likely to reach 3.19 resistance again. Exceeding this zone could start a new uptrend. However, the breakouts of the kumo cloud upper level and 2.98 support may reverse the trend and bring deep declines.
Supports 2.9851 – 2.7268 – 2.5500
Resistances 3.1991 – 3.3854 – 3.5039
SOL/USDT
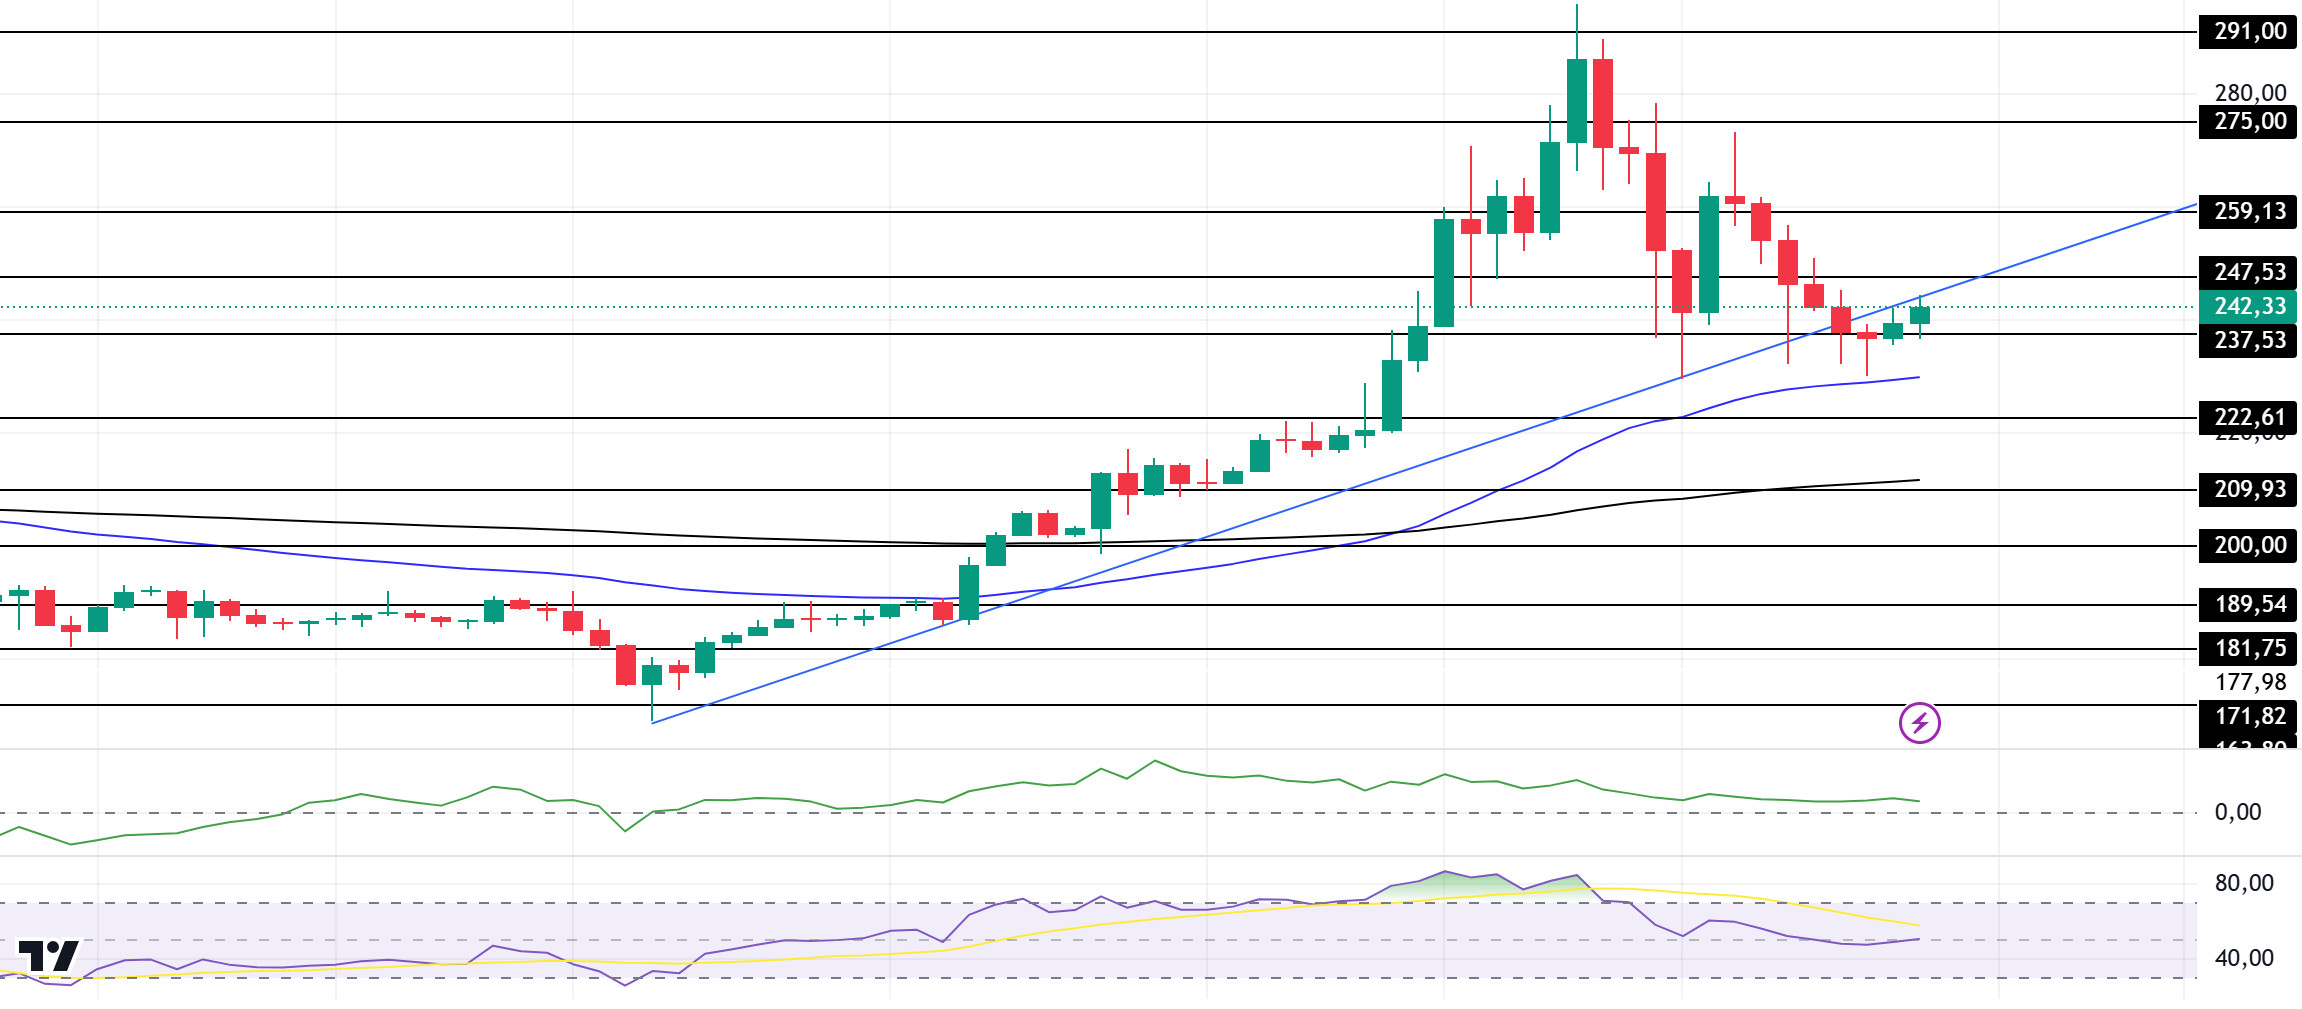
The asset, which tested the 50 EMA (Blue Line) as support in our morning analysis, rose slightly from there and started to test the base of the uptrend since January 13 as resistance. On the 4-hour timeframe, the 50 EMA (Blue Line) continues to be above the 200 EMA (Black Line). This could mean that the uptrend will continue in the medium term. At the same time, the asset is above the 50 EMA and 200 EMA. When we examine the Chaikin Money Flow (CMF)20 indicator, it is in positive territory and inflows have started to decrease. This may cause a further pullback. However, the Relative Strength Index (RSI)14 indicator moved from negative to positive territory. The 291.00 level appears to be a very strong resistance point in the rises driven by both the upcoming macroeconomic data and the news in the Solana ecosystem. If it breaks here, the rise may continue. In case of retracements for the opposite reasons or due to profit sales, the 209.93 support level can be triggered. If the price reaches these support levels, a potential bullish opportunity may arise if momentum increases.
Supports 237.53 – 222.61 – 209.93
Resistances 247.53 – 259.13 – 275.00
DOGE/USDT
Elon Musk recently sparked controversy with his “DOGE to Mars” statement. At the same time, Musk’s optimistic comment and the United States government’s prominent display of the Dogecoin logo on the official website for the Department of Government Efficiency (DOGE) has boosted the Dogecoin price by about 3.12% today. On the other hand, a Dogecoin whale may cause serious concerns in the market today by disposing of approximately $140 million worth of tokens. Recent on-chain data showed that 400 million DOGE were sent to a centralized exchange.
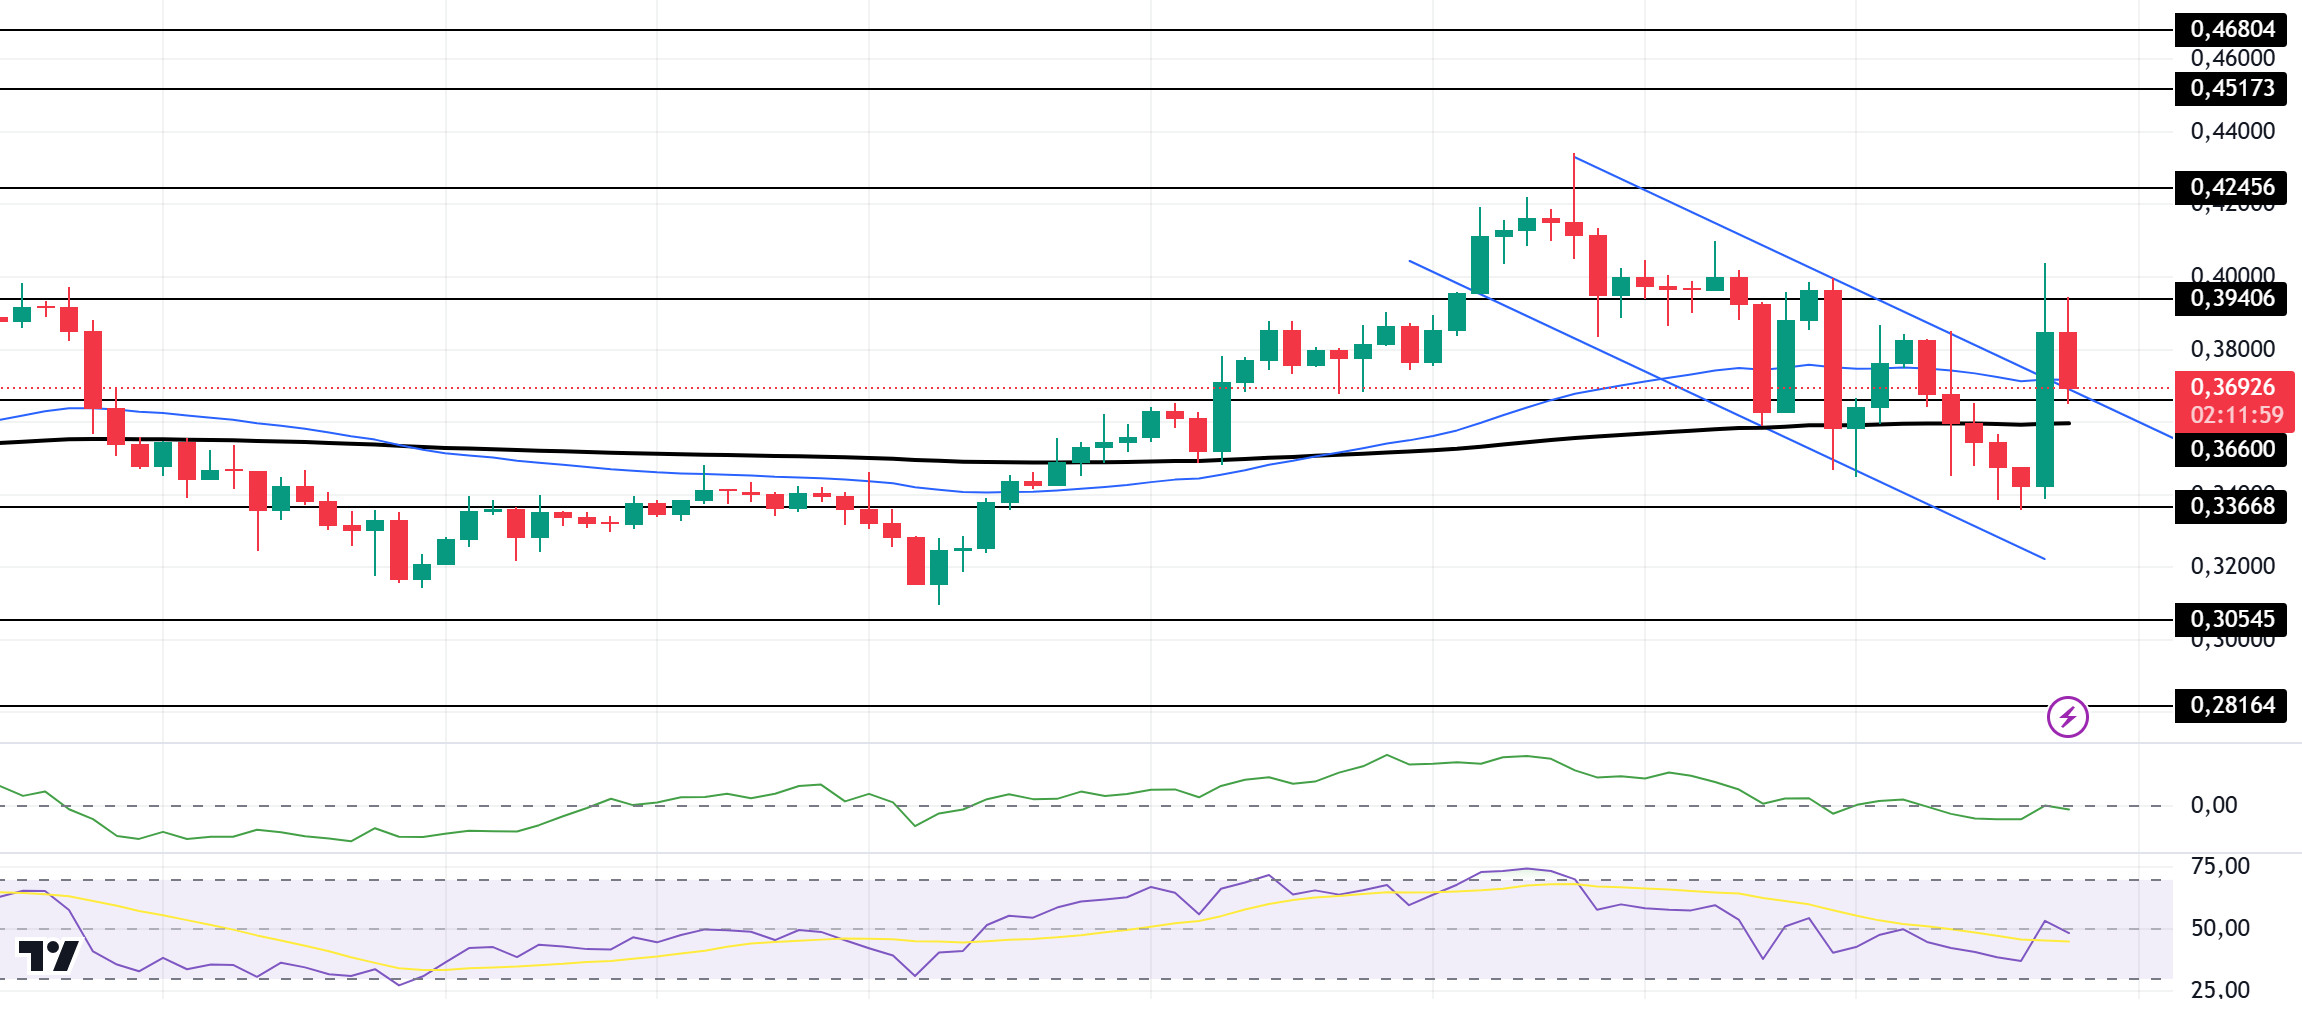
Doge broke the downtrend that has been in place since January 18. On the 4-hour timeframe, the asset is above the 50 EMA (Blue Line) and the 200 EMA (Black Line). At the same time, the price is testing the top of the downtrend with the 50 EMA as support at the time of writing. The 50 EMA continues to hover above the 200 EMA. This could be the start of a medium-term uptrend. When we examine the Chaikin Money Flow (CMF)20 indicator, it has risen from the negative zone to the neutral zone and money inflows are increasing. However, Relative Strength Index (RSI)14 is in the neutral zone. The 0.42456 level appears as a very strong resistance point in the rises due to political reasons, macroeconomic data and innovations in the DOGE coin. In case of possible pullbacks due to political, macroeconomic reasons or negativities in the ecosystem, the 0.33668 level, which is the base level of the trend, is an important support. If the price reaches these support levels, a potential bullish opportunity may arise if momentum increases.
Supports 0.36600 – 0.33668 – 0.30545
Resistances 0.39406 – 0.42456 – 0.45173
LEGAL NOTICE
The investment information, comments and recommendations contained herein do not constitute investment advice. Investment advisory services are provided individually by authorized institutions taking into account the risk and return preferences of individuals. The comments and recommendations contained herein are of a general nature. These recommendations may not be suitable for your financial situation and risk and return preferences. Therefore, making an investment decision based solely on the information contained herein may not produce results in line with your expectations.

