MARKET SUMMARY
Latest Situation in Crypto Assets
| Assets | Last Price | 24h Change | Dominance | Market Cap. |
|---|---|---|---|---|
| BTC | 100,751.10 | 1.53% | 56.18% | 2,00 T |
| ETH | 3,639.854 | -0.14% | 12.35% | 438,53 B |
| XRP | 2.428 | 1.34% | 3.93% | 139,45 B |
| SOLANA | 214.15 | -1.76% | 2.92% | 103,59 B |
| DOGE | 0.3865 | 0.35% | 1.61% | 57,07 B |
| CARDANO | 1.131 | 5.34% | 1.12% | 39,80 B |
| TRX | 0.2695 | 1.38% | 0.65% | 23,25 B |
| AVAX | 43.04 | -2.10% | 0.50% | 17,67 B |
| LINK | 23.34 | -2.14% | 0.42% | 14,90 B |
| SHIB | 0.00002381 | -1.36% | 0.40% | 14,04 B |
| DOT | 7.830 | 1.80% | 0.34% | 12,04 B |
*Prepared on 1.7.2025 at 14:00 (UTC)
WHAT’S LEFT BEHIND
Bitcoin and Ethereum ETFs Started the Year Strong: $1.1 Billion Daily Inflows
US spot Bitcoin and Ethereum exchange-traded funds (ETFs) attracted a lot of interest from investors at the beginning of the year. This interest resulted in net inflows totaling $1.1 billion. This development contributed to Bitcoin surpassing the $100,000 level again.
Czech National Bank Governor Considers Including Bitcoin in Future Reserve Strategy
According to Cointelegraph, Aleš Michl, President of the Czech National Bank (CNB), announced that they are considering using Bitcoin as part of a strategy to diversify their foreign exchange reserves. However, the CNB has no immediate plans to buy crypto assets and this decision is subject to the approval of the board of directors. The bank also continues to promote reserve diversification through gold purchases, aiming to hold 5% of its total assets in gold by 2028.
JPMorgan: Bitcoin Mining Profitability Increased for the Second Month in a Row in December
Bitcoin mining profitability increased in December 2024, reaching the highest level since April 2024, according to a JPMorgan report reported by CoinDesk. However, miners’ daily revenues and gross margins remain 43% and 52% lower than pre-halving levels, respectively.
HIGHLIGHTS OF THE DAY
Important Economic Calender Data
| Time | News | Expectation | Previous |
|---|---|---|---|
| 15:00 | US ISM Services PMI (Dec) | 53.5 | 52.1 |
| 15:00 | US JOLTS Job Openings (Nov) | 7.73M | 7.74M |
INFORMATION
*The calendar is based on UTC (Coordinated Universal Time) time zone.
The economic calendar content on the relevant page is obtained from reliable news and data providers. The news in the economic calendar content, the date and time of the announcement of the news, possible changes in the previous, expectations and announced figures are made by the data provider institutions. Darkex cannot be held responsible for possible changes that may arise from similar situations
MARKET COMPASS
Continuing an important week in which we expect volumes to normalize and important macro indicators to be announced, global markets continue to present a mixed picture with the impact of news flows. The main issues are the interest rate cut cycle of central banks and the policies to be implemented by Donald Trump, who will take over the presidency on January 20. In addition, the news of the resignation of the Vice Chairman of the US Federal Reserve (FED) and the interest of institutional investors in digital assets are on the agenda. European stock markets are trying to hold on to positive territory and Wall Street index futures are pointing to a bullish opening.
We maintain our expectation that “digital assets will continue to rise with intermediate respites”, which we mentioned in our previous analysis. Later in the day, the dynamics that may change or support this outlook may be the US macro indicators. The Purchasing Managers’ index (PMI) and Job Openings and Labor Turnover Survey (JOLTS) data for the service sector will be under the scrutiny of investors ahead of Friday’s critical employment figures. Especially if JOLTS comes in far away from expectations of 7.73 million, we may see increased volatility. A higher-than-expected JOLTS data may have a negative impact on digital assets, while lower numbers may have a positive impact.
From the short term to the big picture.
The victory of former President Trump on November 5, which was one of the main pillars of our bullish expectation for the long-term outlook in digital assets, produced a result in line with our predictions. Afterwards, the appointments made by the president-elect and the increasing regulatory expectations for the crypto ecosystem in the US and the emergence of BTC as a reserve continued to take place in our equation as positive variables. Although it is expected to continue at a slower pace, the FED’s signal that it will continue its interest rate cut cycle and the volume in crypto asset ETFs indicating an increase in institutional investor interest (in addition to MicroStrategy’s BTC purchases, BlackRock’s BTC ETF options starting to trade…) support our upward forecast for the big picture for now. In the short term, given the nature of the market and pricing behavior, we think it would not be surprising to see occasional pauses or pullbacks in digital assets. However, at this point, it is worth emphasizing again that the fundamental dynamics continue to be bullish.
TECHNICAL ANALYSIS
BTC/USDT
On the onchain side, the Coinbase index moved into positive territory after about a month in the first week of the new year, with Bitcoin testing the 102K level. This data shows that US investor behavior is once again shifting towards buying ahead of the swearing-in ceremony on January 20. In addition, the fact that Spot ETFs support this data may bring a movement towards the ATH level in Bitcoin in the medium term.
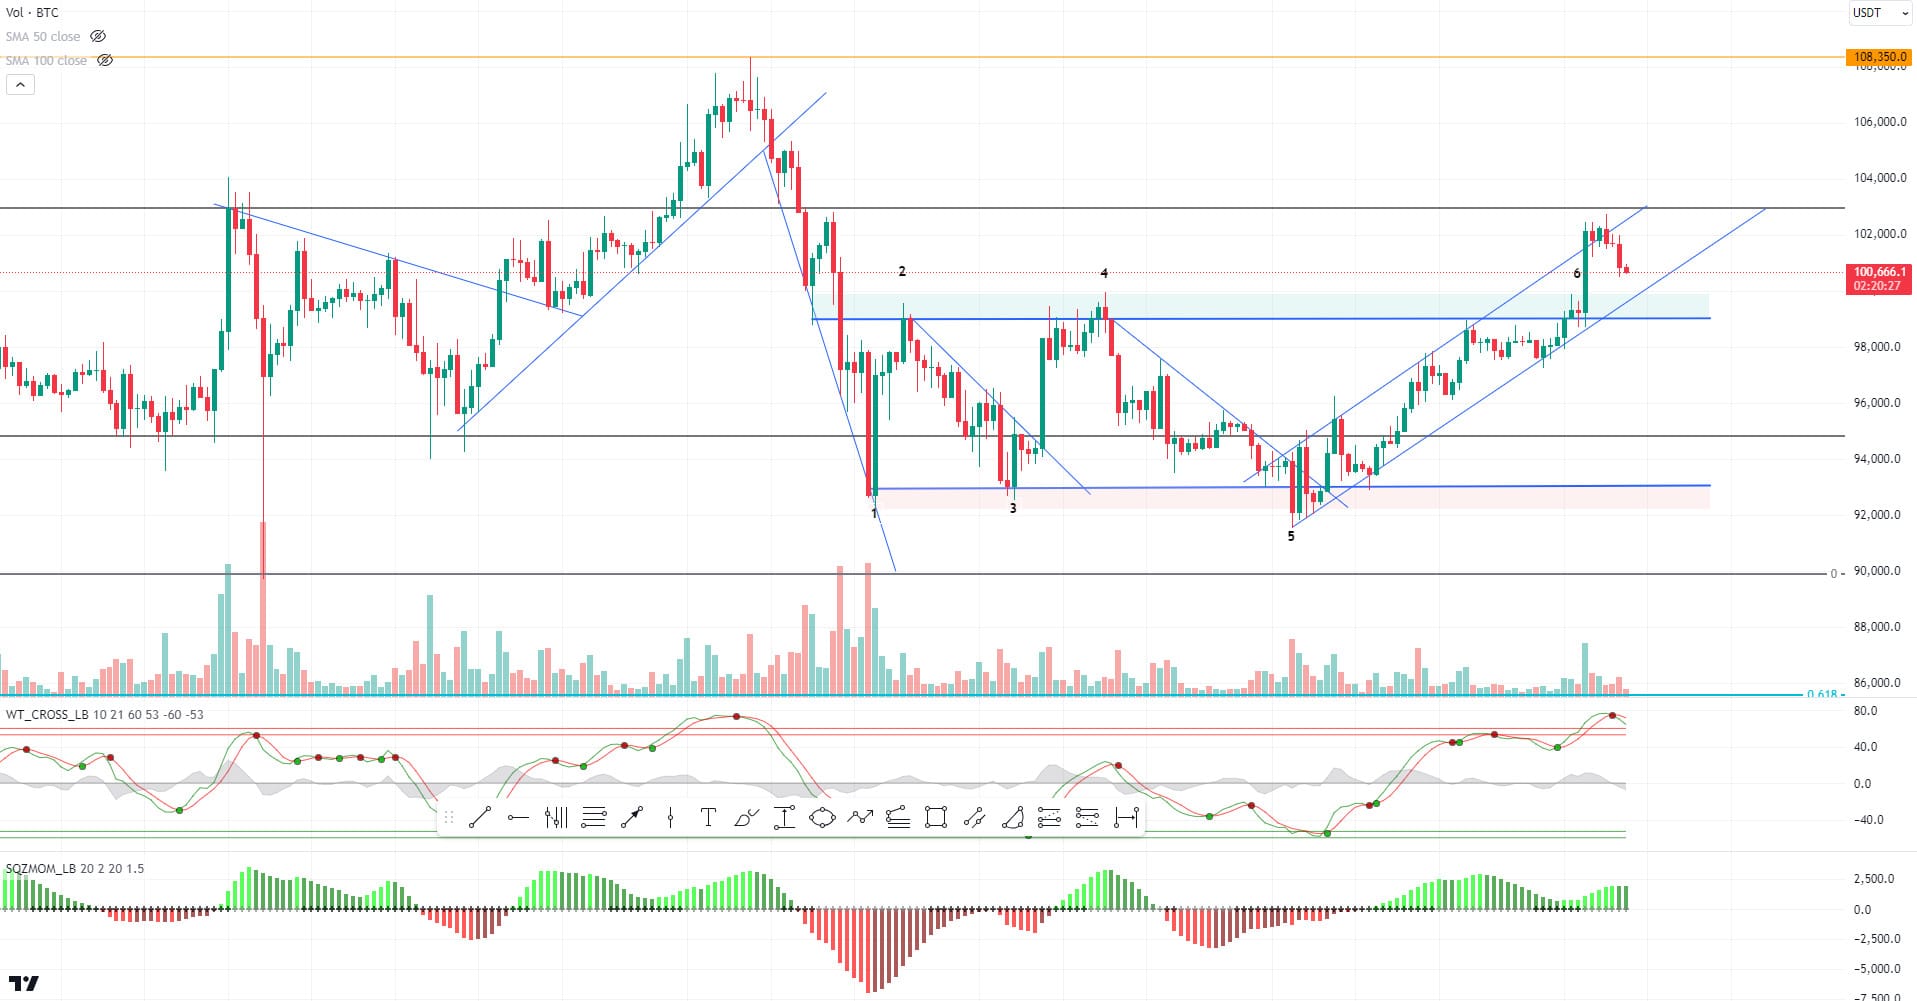
Looking at the technical outlook, the price that crossed the upper line of the rising trend channel could not stay above this level and returned back to the trend channel. BTC, which broke the resistance it encountered at levels 2 and 4 at level 6, provided the liquidation of short transactions opened in the 102,000 band. When we look at the liquidation weekly chart, the weight of long transactions at 96,000 and 97,000 stands out. With a needle to be thrown to this level, we can confirm the price’s willingness to go up. When we look at the technical oscillators, besides maintaining the sales signal, a weak image is also displayed on the momentum side. With the deepening of the retracement, the persistence above the green zone will be followed and in case of a break, we can expect the rectangle pattern to be active again. In the continuation of the rise without a correction movement, we will follow the 103,000 resistance level.
Supports 99,100 – 98,000 – 97,200
Resistances 101,400 – 103,000 – 105,000
ETH/USDT
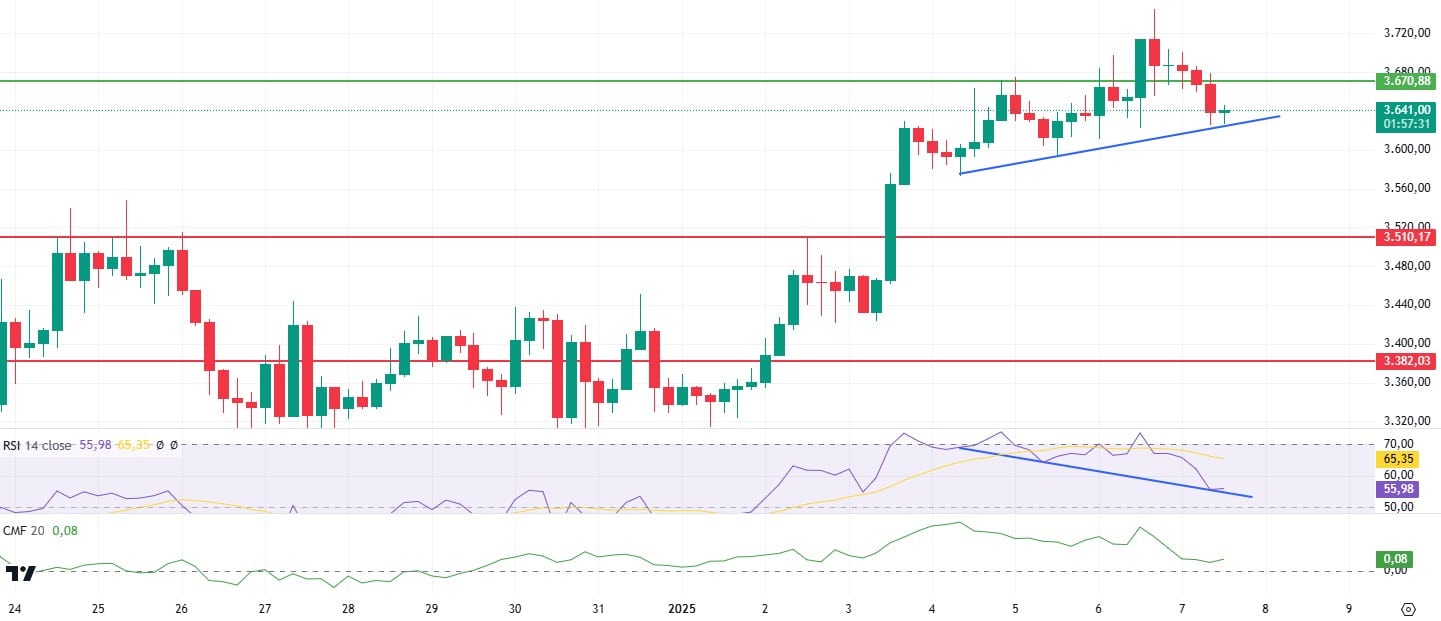
As highlighted in the morning analysis, Ethereum has entered a retracement process, breaking the 3,670 level to the downside amid weakness in indicators. This movement indicates that the loss of momentum in the market has become evident. Analyzing the technical indicators, there are several important signals that support the downward trend of the price action.
First of all, the Relative Strength Index (RSI) continues its downtrend, putting pressure on the price. However, another noteworthy element in the chart is that a positive divergence has started to form despite the bearish trend. This may be considered as a potential recovery signal in the coming period. On the other hand, Chaikin Money Flow (CMF) has reacted upwards, showing a slight recovery after the downward pressures. Although this recovery indicates that capital flows have partially improved, it has not completely eliminated the weakness in the overall outlook. Another factor supporting the negative picture is the loss of the critical tenkan level on the Ichimoku indicator. A break below this level raises the possibility of Ethereum retreating towards kijun support at 3,584. This area stands out as an important support level for price action and a loss of it could lead to a deeper pullback.
Overall, the negative outlook on the indicators has partially diminished but has not completely disappeared. Considering that momentum continues to weaken, it can be said that Ethereum has the potential to retreat to 3,584 – 3,510 levels. However, it is evaluated that if the 3,670 level is regained, the selling pressure will decrease and a positive outlook will gain strength. In this scenario, a retest of upside targets may become possible.
Supports 3,510 – 3,382- 3,293
Resistances 3,670 – 3,841 – 4,001
XRP/USDT
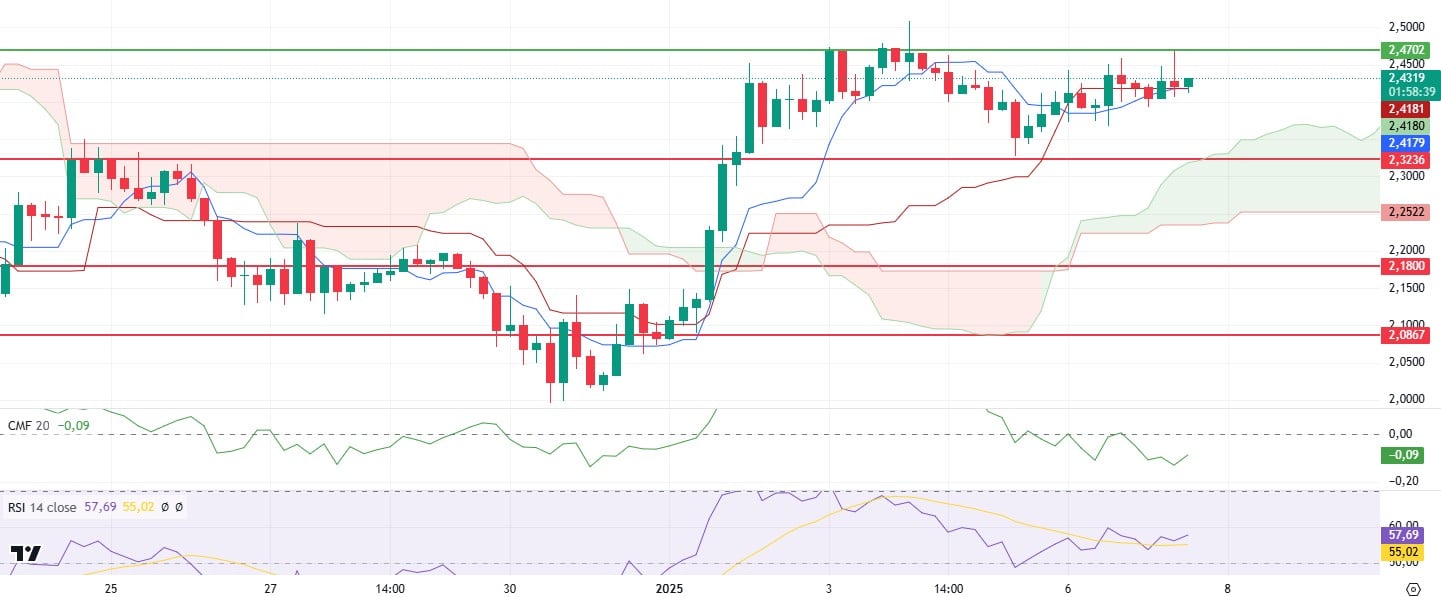
XRP tested the 2.47 level once again in the morning hours, but failed to hold in this region and experienced a slight retracement.
While the technical indicators generally maintain a negative outlook, the positive divergence on Chaikin Money Flow (CMF) stands out. Although this indicates a partial recovery in capital flows, it does not yet have a significant impact on the price. On the Ichimoku indicator, the intersection of Tenkan and Kijun levels indicates that the previous sell signal has turned into a neutral outlook. However, the price has still not made a meaningful rise. This reveals that the upside potential remains limited.
While the 2.47 level stands out as a critical resistance, a positive momentum can be expected if this level is exceeded. In downward movements, 2.32 support seems important. A decline below this level may cause the price to retreat to lower support points.
Supports 2.3236 – 2.1800 – 2.0867
Resistances 2.4702 – 2.6180 – 2.8528
SOL/USDT
In a recent post on platform X, Nick Ducoff, Head of Corporate Growth at the Solana Foundation, warned the banking establishment that banks are at risk of losing out in the “internet financial revolution” if they fail to embrace innovation for the benefit of their customers. Grayscale recently announced its top tokens for 2025, and as expected, the list is making waves within the crypto community. Grayscale’s list shows a focus on emerging trends such as artificial intelligence (AI) and the Solana ecosystem. We’ve seen several Solana tokens launch in 2024, and Grayscale’s list points to a potential boom in the Solana ecosystem. Solana, on the other hand, has experienced a surge in trading activity, with open interest reaching $6.68 billion, setting a historic record.
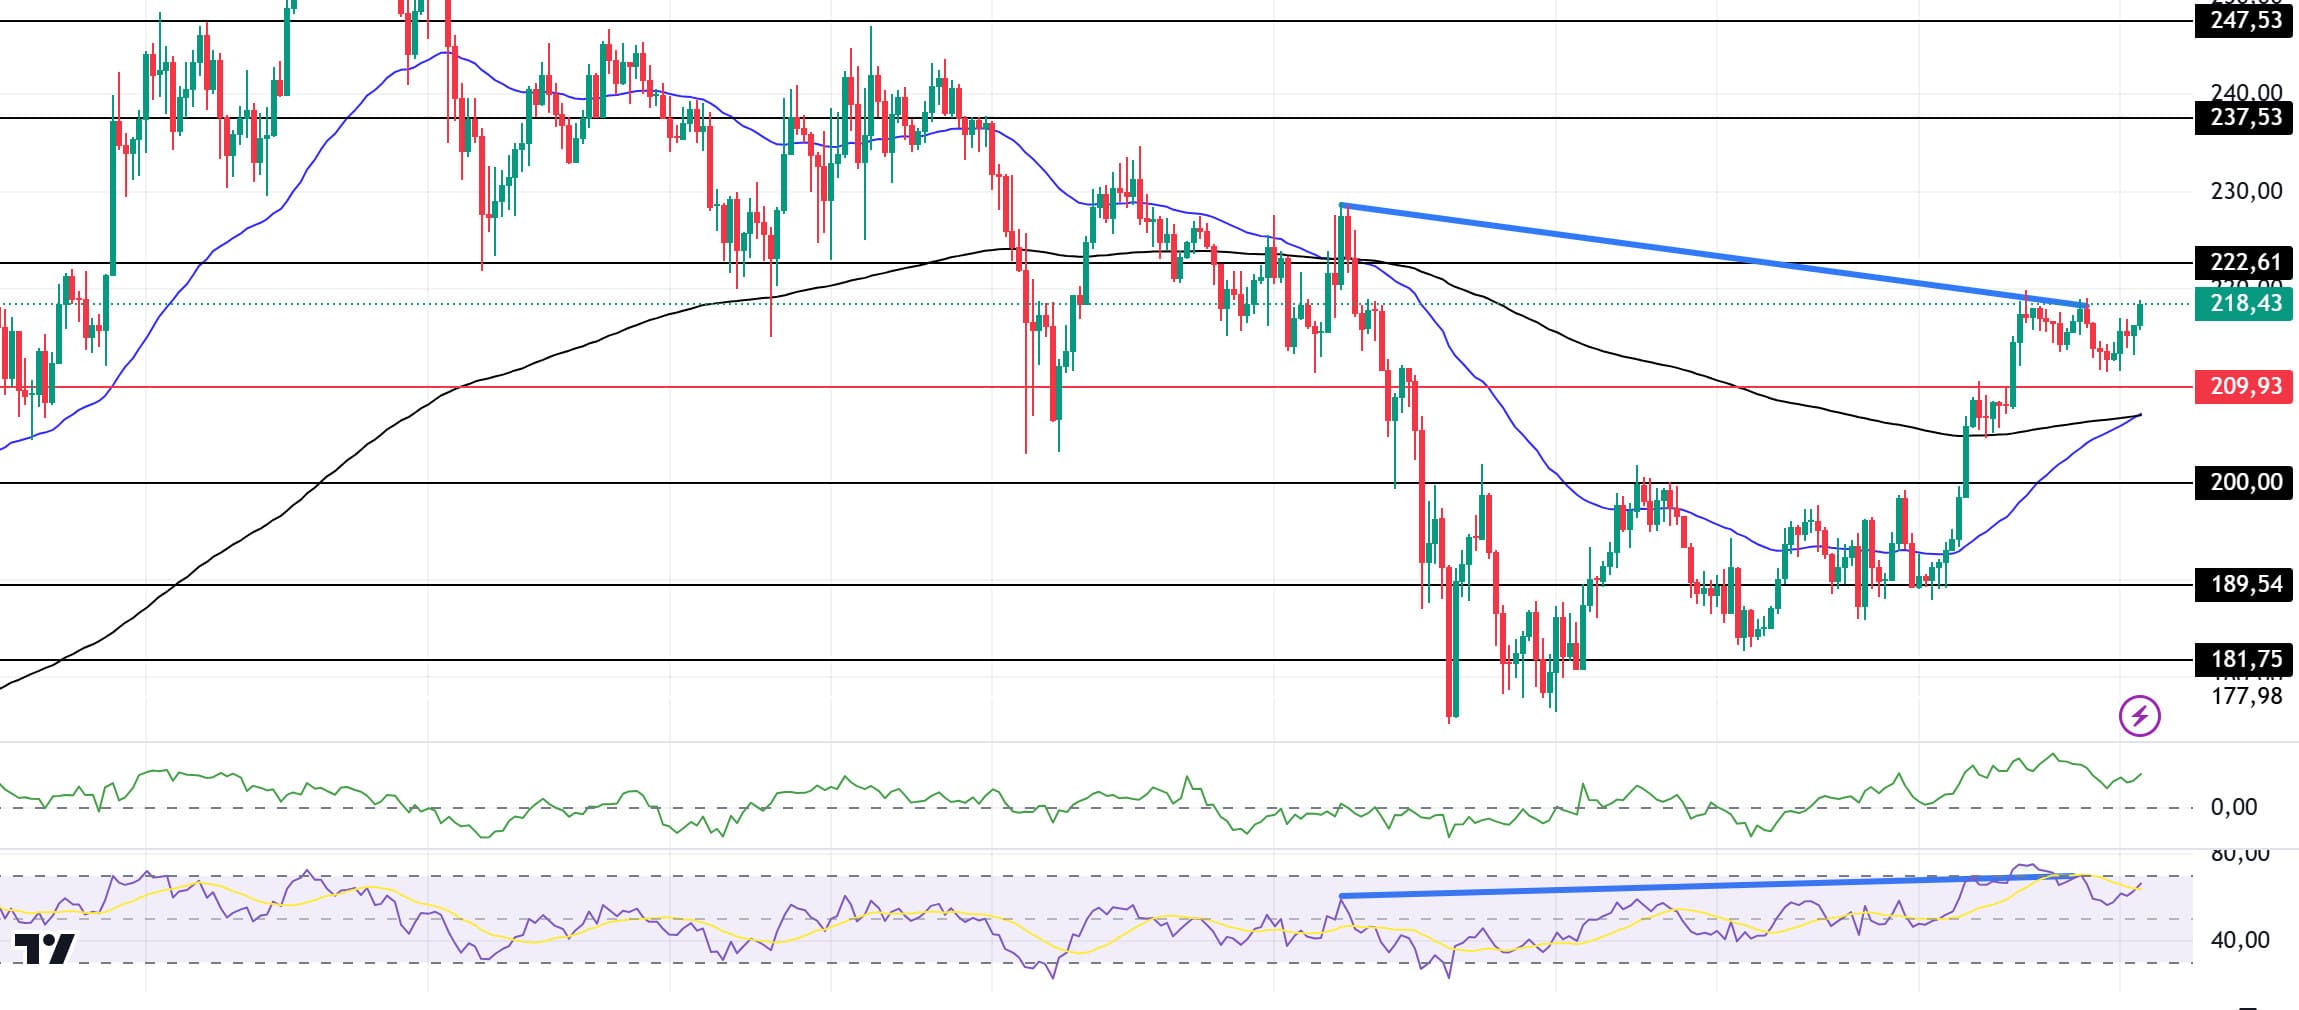
SOL has continued to decline slightly since our analysis in the morning. On the 4-hour timeframe, the 50 EMA (Blue Line) continues to be positioned above the 200 EMA (Black Line). This could start a medium-term uptrend. When we examine the Chaikin Money Flow (CMF)20 indicator, money outflows seem to have increased, albeit in positive territory. However, the Relative Strength Index (RSI)14 indicator reached the neutral zone from the overbought level. At the same time, bearish divergence should be taken into account. This may start a decline again. The 247.53 level appears to be a very strong resistance point in the rises driven by both the upcoming macroeconomic data and the news in the Solana ecosystem. If it breaks here, the rise may continue. In case of retracements for the opposite reasons or due to profit sales, the 200.00 support level can be triggered. If the price reaches these support levels, a potential bullish opportunity may arise if momentum increases.
Supports 209.93 – 200.00 – 189.54
Resistances 222.61 – 237.53 – 247.53
DOGE/USDT
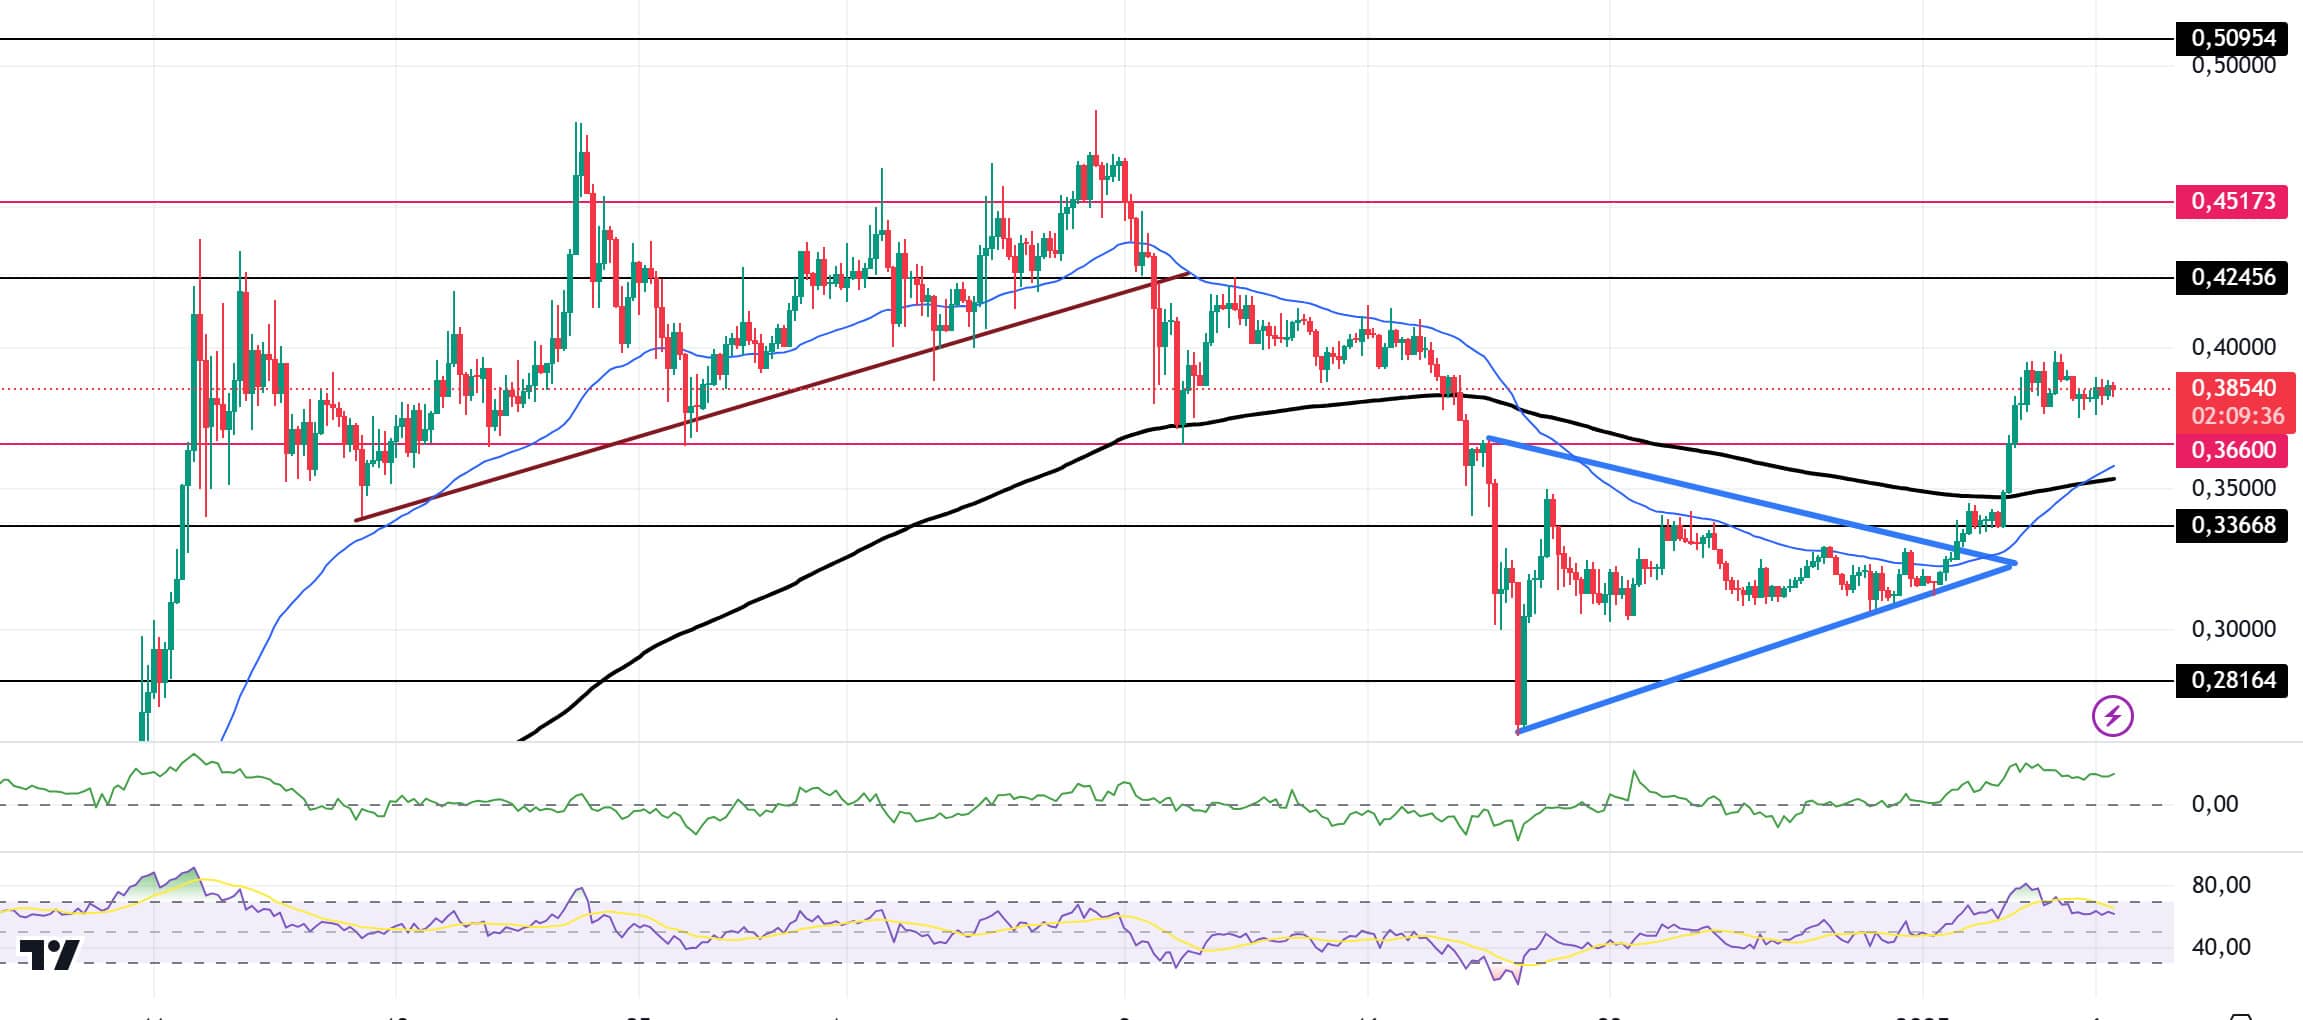
When we look at the chart, it is moving horizontally at the morning levels. The horizontal asset accumulated the swelling RSI indicator and moved it away from the overbought zone. This could be a bullish harbinger. At the same time, the Relative Strength Index (RSI)14 indicator shows a bearish mismatch. This should be taken into consideration. On the 4-hour timeframe, the 50 EMA (Blue Line) broke the 200 EMA to the upside. This may reinforce the uptrend. When we examine the Chaikin Money Flow (CMF)20 indicator, it is in the neutral zone but money outflows are increasing. However, Relative Strength Index (RSI)14 is in positive territory. On the other hand, a flag pennant pattern has formed. In case of an upward movement of the asset, the pennant may break upwards and trigger a price increase. The 0.42456 level stands out as a very strong resistance point in the uptrend driven by both the upcoming macroeconomic data and the innovations in the Doge coin. If DOGE catches a new momentum and rises above this level, the rise may continue strongly. In case of possible pullbacks due to macroeconomic reasons or negativity in the ecosystem, the 0.33668 level, which is the base level of the trend, is an important support. If the price reaches these support levels, a potential bullish opportunity may arise if momentum increases.
Supports 0.36600 – 0.33668 – 0.28164
Resistances 0.42456 – 0.45173 – 0.50954
LEGAL NOTICE
The investment information, comments and recommendations contained herein do not constitute investment advice. Investment advisory services are provided individually by authorized institutions taking into account the risk and return preferences of individuals. The comments and recommendations contained herein are of a general nature. These recommendations may not be suitable for your financial situation and risk and return preferences. Therefore, making an investment decision based solely on the information contained herein may not produce results in line with your expectations.


