
MARKET SUMMARY
Latest Situation in Crypto Assets
| Assets | Last Price | 24h Change | Dominance | Market Cap. |
|---|---|---|---|---|
| BTC | 90,396.22 | -0.43% | 59.92% | 1,79 T |
| ETH | 3,102.62 | -2.17% | 12.54% | 373,56 B |
| SOLANA | 214.72 | 0.17% | 3.39% | 101,34 B |
| DOGE | 0.3722 | -7.81% | 1.84% | 54,67 B |
| XRP | 0.8811 | 21.33% | 1.68% | 50,13 B |
| CARDANO | 0.6544 | 15.82% | 0.77% | 22,91 B |
| TRX | 0.1878 | 2.93% | 0.54% | 16,22 B |
| SHIB | 0.00002424 | -5.71% | 0.48% | 14,32 B |
| AVAX | 32.58 | 0.82% | 0.45% | 13,31 B |
| LINK | 13.62 | 1.98% | 0.29% | 8,53 B |
| DOT | 5.028 | 1.37% | 0.26% | 7,65 B |
*Prepared on 11.15.2024 at 13:30 (UTC)
WHAT’S LEFT BEHIND
VanEck executive expects $180k for Bitcoin in 2025
Matthew Sigel, head of digital assets at VanEck, which also has a Bitcoin spot ETF product, said he expects Bitcoin to reach $180,000 in 2025. “Everything is just beginning,” Sigel said.
Michael Saylor: Getting ready for the $100k in Bitcoin party
MicroStrategy founder Michael Saylor stated that he expects a price of 100 thousand dollars in Bitcoin by the end of December at the latest. Saylor was asked in a program he participated in, “Will there be a drop to $ 60 or $ 30,000?” To the question, “I think so. I am preparing for a $ 100,000 party in my own home. I think this will happen by Christmas at the latest,” he said.
Goldman Sachs announced that Bitcoin spot ETF assets were worth more than $710 million at the end of the third quarter
According to the official website of the Securities and Exchange Commission (SEC), Goldman Sachs Group (Goldman Sachs) has filed 13F documents disclosing that as of September 30, Bitcoin spot ETF assets were worth more than $710 million.
HIGHLIGHTS OF THE DAY
Important Economic Calender Data
| Time | News | Expectation | Previous |
|---|---|---|---|
| 18:15 | FOMC Member Williams Speaks |
INFORMATION
*The calendar is based on UTC (Coordinated Universal Time) time zone.
The economic calendar content on the relevant page is obtained from reliable news and data providers. The news in the economic calendar content, the date and time of the announcement of the news, possible changes in the previous, expectations and announced figures are made by the data provider institutions. Darkex cannot be held responsible for possible changes that may arise from similar situations.
MARKET COMPASS
Yesterday, the pressure on digital assets during European trading continued in Asia. Today, we saw some of the losses recovered in Europe and this was despite macro indicators from the US pointing to a buoyant economy. Retail sales in the world’s largest economy increased by 0.4% (Expectation: 0.3%) in October, while core retail sales, which excludes automobile sales, increased by 0.1% (Expectation: 0.3%). However, the previously announced data for September was revised upwards, which was in line with US Federal Reserve Chairman Powell’s statements that they would not be in a hurry to cut interest rates. Again, it would not be correct to say that we have seen a directional set of figures on the pricing side.
For the rest of the day, assuming that there are no new surprise dynamics, we think that we may see price changes in a relatively narrow area in digital assets. In addition, position adjustments by institutional investors in order to adapt to new economic conditions (Trump presidency and FED’s interest rate cut course) may cause sharp changes from time to time. However, we believe that these volatile and large waves can be absorbed by the depth of the market.
From the short term to the big picture.
The victory of former President Trump, one of the main pillars of our bullish expectation for the long-term outlook in digital assets, produced a result in line with our forecasts. The continuation of the Fed’s rate-cutting cycle (albeit with cautious messages from Powell…) and the inflows into BTC ETFs, indicating increased institutional investor interest (in addition to MicroStrategy’s BTC purchases, Microsoft starting to consider a purchase…), support our upside forecast for the big picture for now.
In the short term, given the nature of the market and pricing behavior, we think it would not be surprising to see occasional respite or pullbacks in digital assets. At this point, it is worth reiterating that fundamental dynamics remain bullish. While Bitcoin, the largest digital currency, has extended its record highs several times, which may encourage buyers to take new, upside positions, we will watch this group struggle with the masses who may want to take profit realizations. Volatility is likely to increase during this struggle.
TECHNICAL ANALYSIS
BTC/USDT
After FED chairman Powell’s abstaining messages on interest rate cuts next month, Bitcoin continues on its way with confident steps. We see that the market, which does not like uncertainty, has left the busy agenda behind after Powell’s speech. New ones are added every day to the Bitcoin reports of corporate companies and six-digit forecasts of asset managers. VanEck manager Matthew Sigel expects Bitcoin to reach 180 thousand dollars in 2025, while Michael Saylor targets a price of 100 thousand dollars by the end of the year.
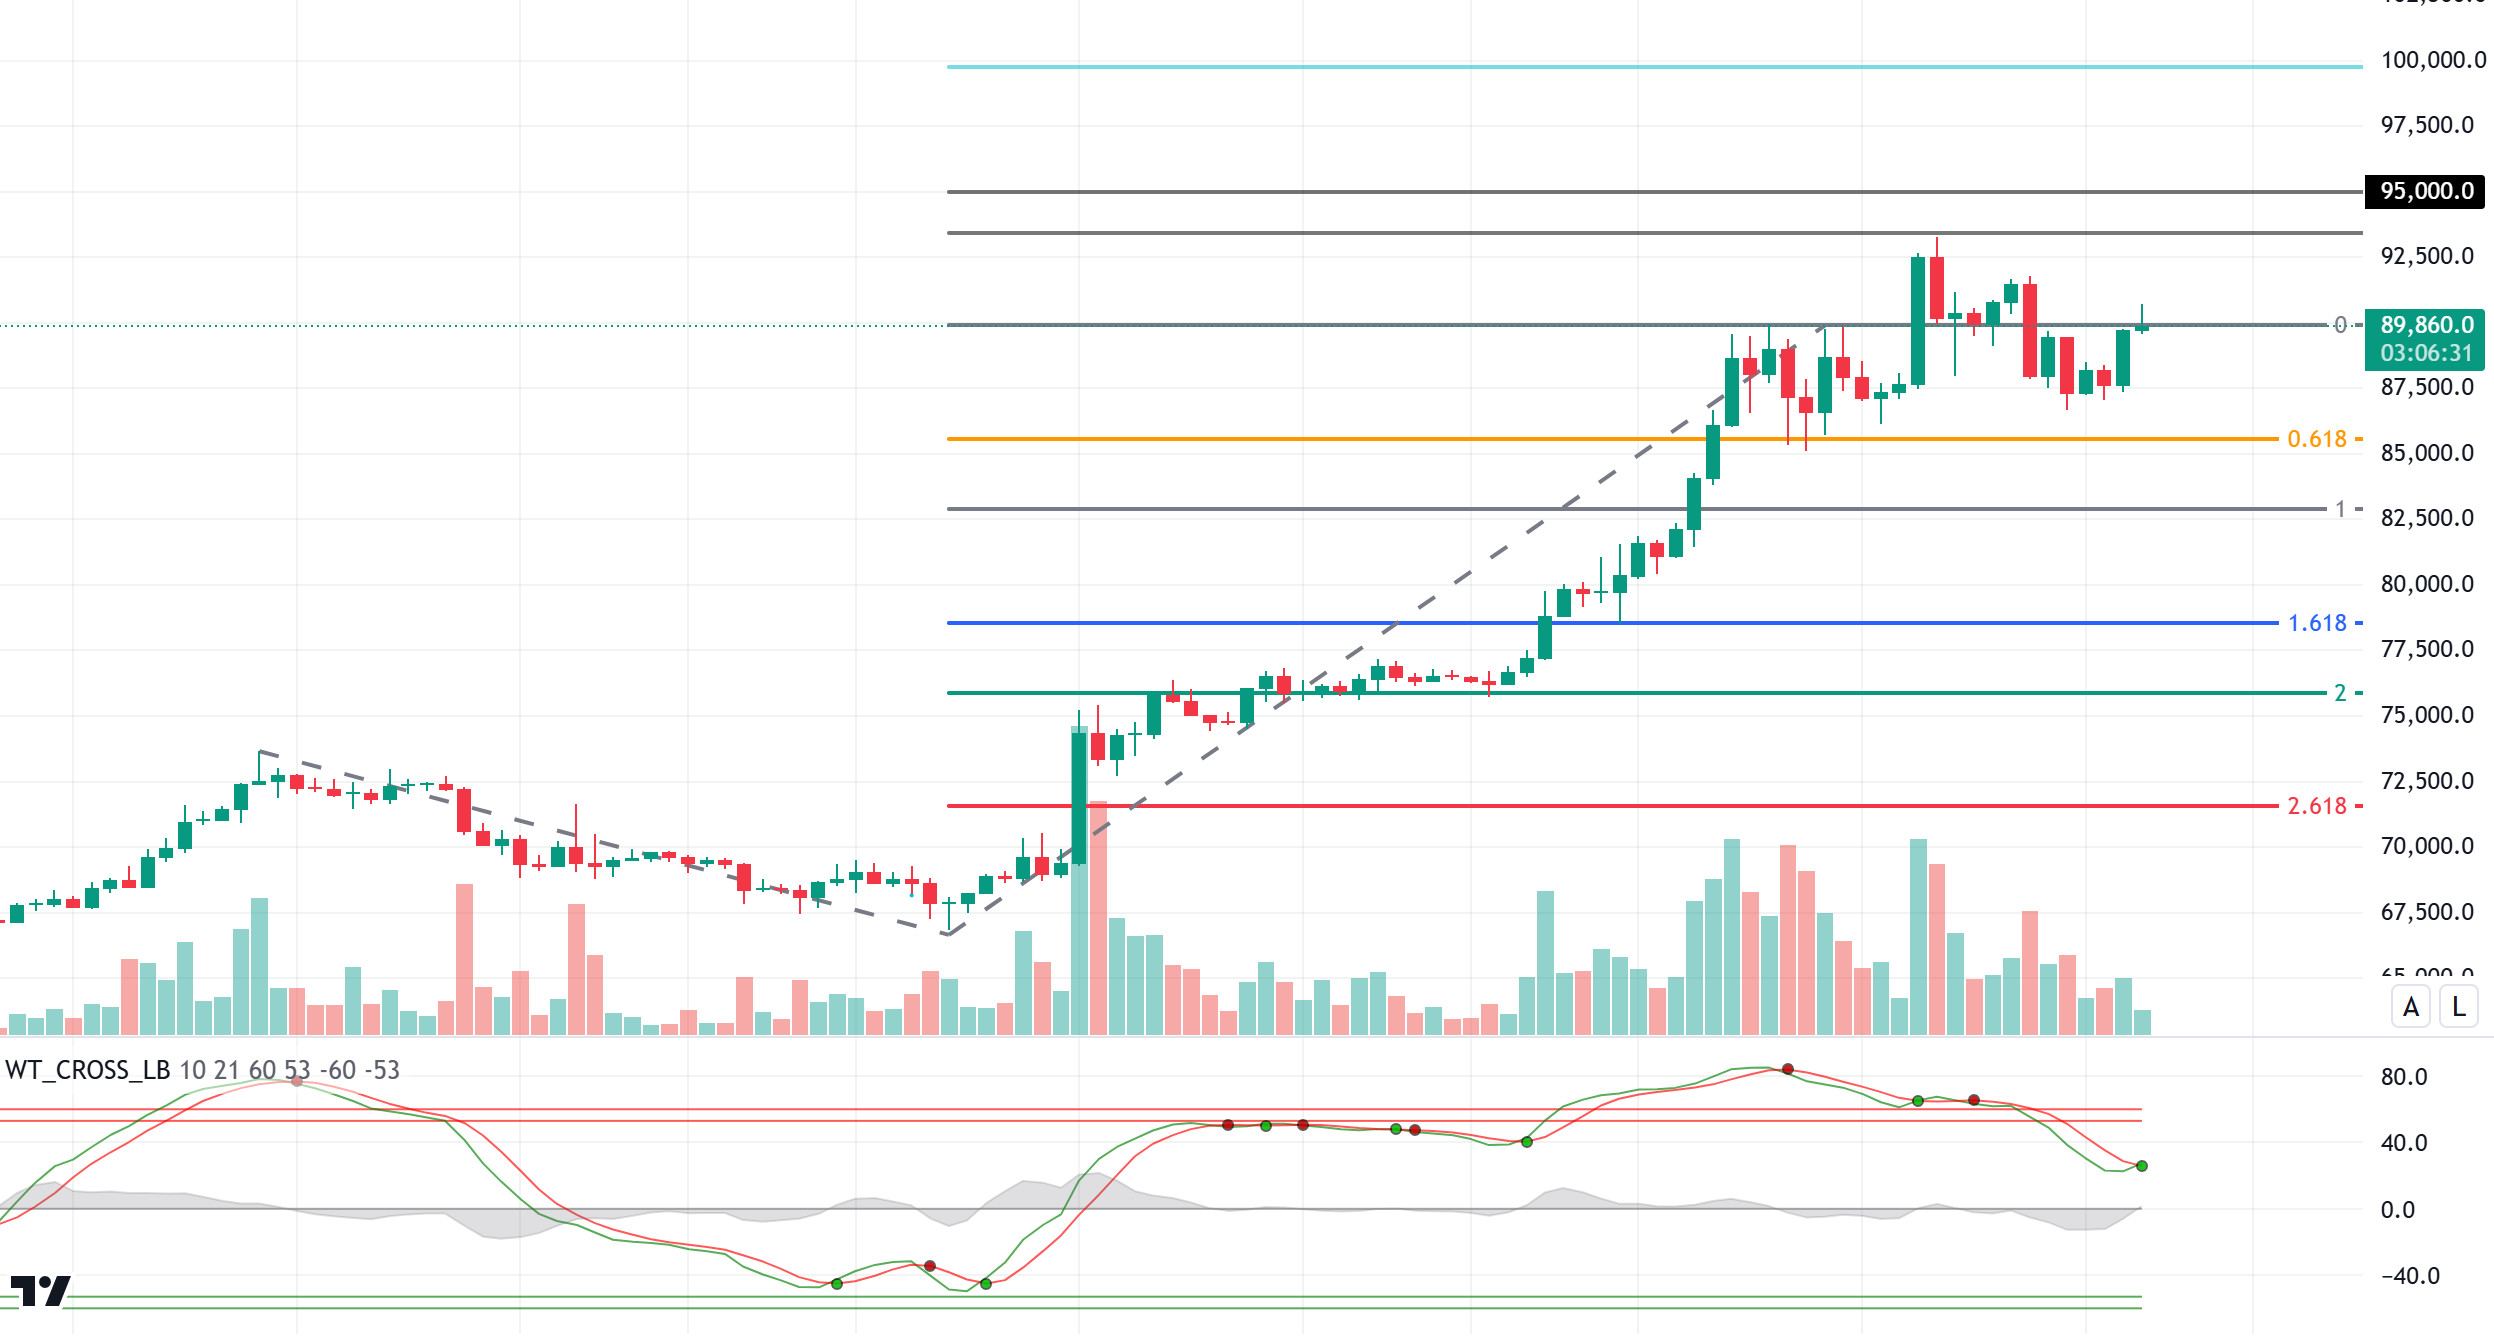
When we look at the technical outlook in the light of all these developments, BTC, which tested 86,000 levels, continues its bull run again. BTC, which is currently priced above the Fibonacci 0 (90,000) level, can attempt a new ATH with persistence above this level. When we look at the technical oscillator, it supports the rise with the buy signal it gives on hourly charts. In case of a pullback, we observed that the 87,000 level serves as support.
Supports 87,000 – 85,500 – 83,000
Resistances 90,000 – 93,000 – 95,000
ETH/USDT
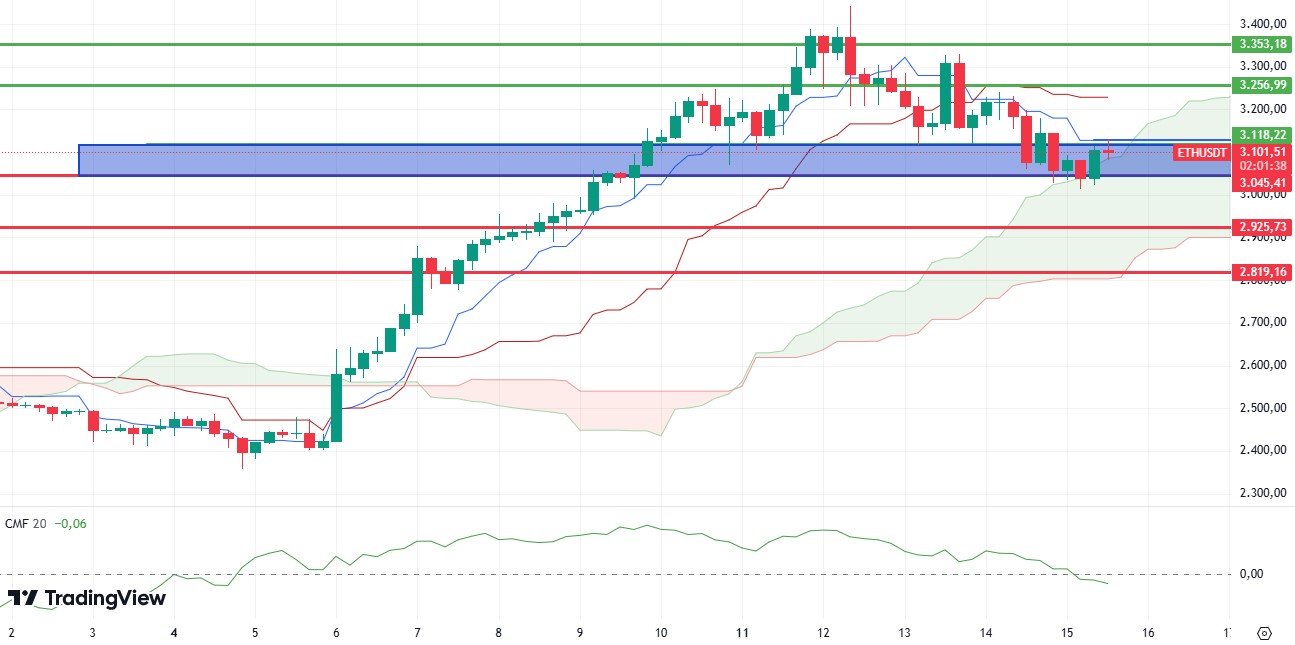
ETH regained the $3,100 level after falling below the $3,045 level with its decline. Trying to overcome the 3,118 resistance, it is seen that the volume has dropped considerably in ETH. In particular, the Chaikin Money Flow (CMF) level falling below zero, creating a clear sell signal, shows that investors have entered a time period that requires investors to be careful. At the same time, looking at the Ichimoku indicator, we see that the price is stuck between the tenkan and kumo cloud levels. It can be said that ETH needs to close above the tenkan level in order to break the sell signal previously formed on the indicator. If this level is not exceeded and especially in the closes below the 3,045 level, it seems likely that the declines will continue until the 2,925 level. The gain of the 3,118 level may trigger rises up to 3,256 levels again after the re-test.
Supports 3,045 – 2,925 – 2,819
Resistances 3,118 – 3,256 – 3,353
XRP/USDT
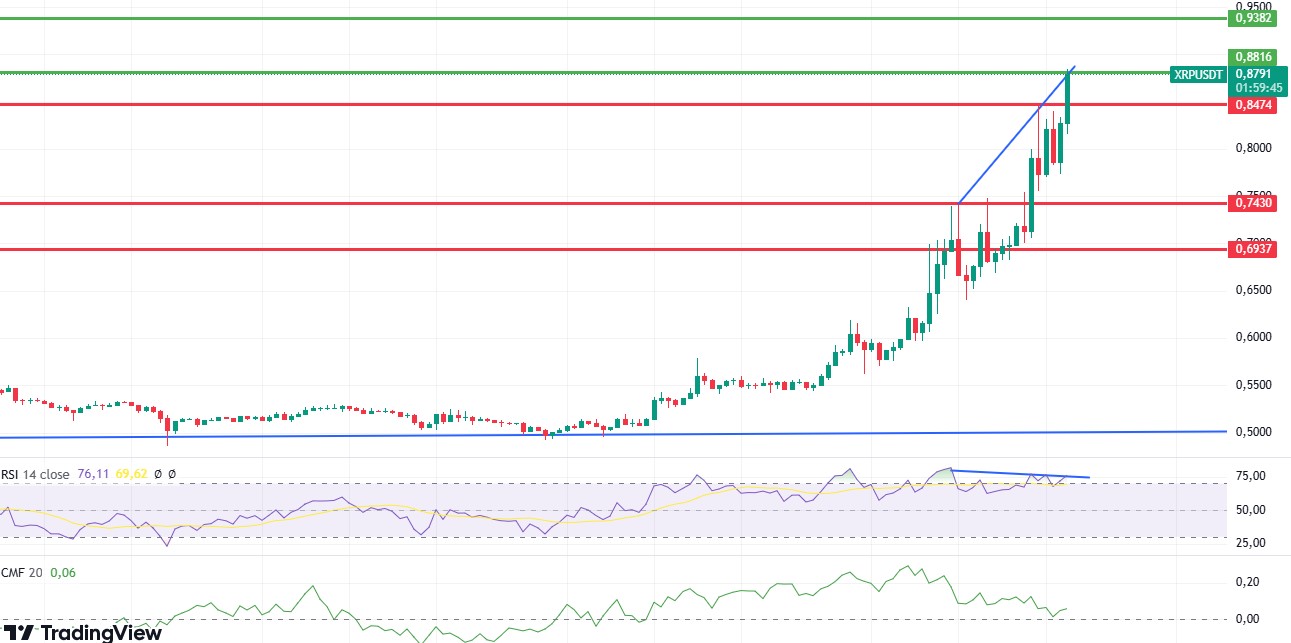
XRP made a new attack during the day and exceeded the 0.8473 level. The rise in Chaikin Money Flow (CMF) in the positive area with support from the zero level is seen as an important indicator for the continuity of the rise on XRP. Momentum also supports this rise. However, the fact that the Relative Strength Index (RSI) progressed with negative divergences during the rise and remained in the overbought zone can be listed as negative factors. In this context, the price staying above the 0.8816 level indicates that the rise may continue, while the loss of the 0.8473 level may cause the sell signal on the RSI to work and cause the correction movement to begin.
Supports 0.8474 – 0.7430 – 0.6937
Resistances 0.8816 – 0.9382 – 0.9866
SOL/USDT
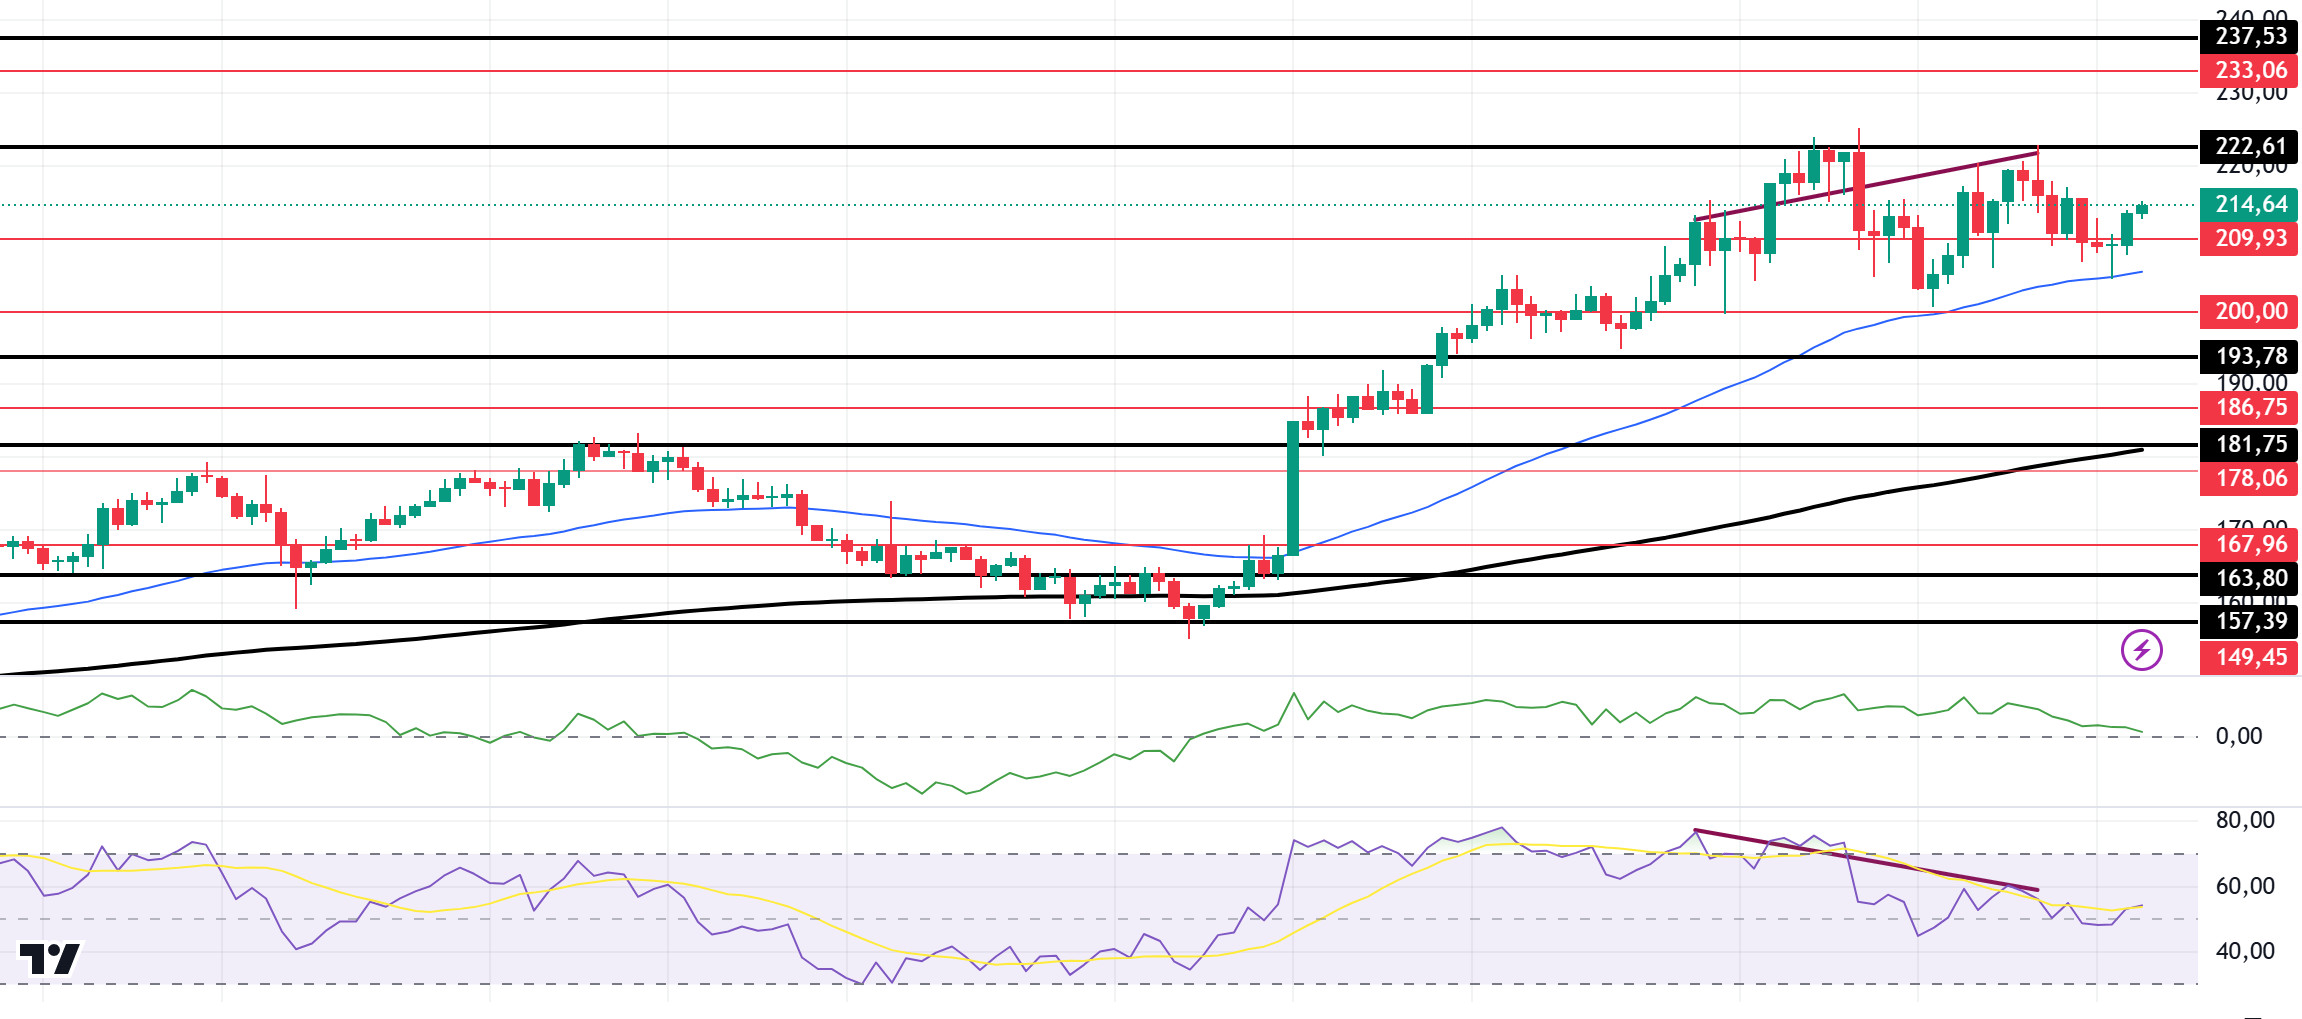
Although BTC is back to the $90K levels, SOL is moving sideways, failing to break the strong resistance at 222.61. On the other hand, the long/short ratio stood at 1.0446 for the last 12 hours, with 51.09% of positions long and 48.91% short. Although this slight trend towards long positions suggests that more traders are leaning towards a price increase, investors seem to be cautious. As a result, while traders expect SOL’s price to rise, they are also ready for possible resistance. On the 4-hour timeframe, the 50 EMA (Blue Line) continues to be above the 200 EMA (Black Line). This could mean that the uptrend will continue. However, when we examine the Chaikin Money Flow (CMF)20 indicator, money inflows are positive, but inflows have started to approach neutral. At the same time, there is a mismatch between the Relative Strength Index (RSI)14 chart and the RSI. This may bring a continuation of sales. The price has rallied about 4.82% with support from the 50 EMA. The 222.61 level is a very strong resistance point in the uptrend driven by both macroeconomic conditions and innovations in the Solana ecosystem. SOL, which has tested here twice, has lost its momentum and has broken the downward uptrend that has formed since November 5. If it starts rising again and rises above the 222.61 level, the rise may continue strongly. In case of retracements due to possible macroeconomic reasons or profit sales, support levels of 193.78 and 181.75 may be triggered again. If the price hits these support levels, a potential bullish opportunity may arise if momentum increases.
Supports 209.93 – 200.00 – 193.78
Resistances 222.61 – 233.06 – 237.53
DOGE/USDT
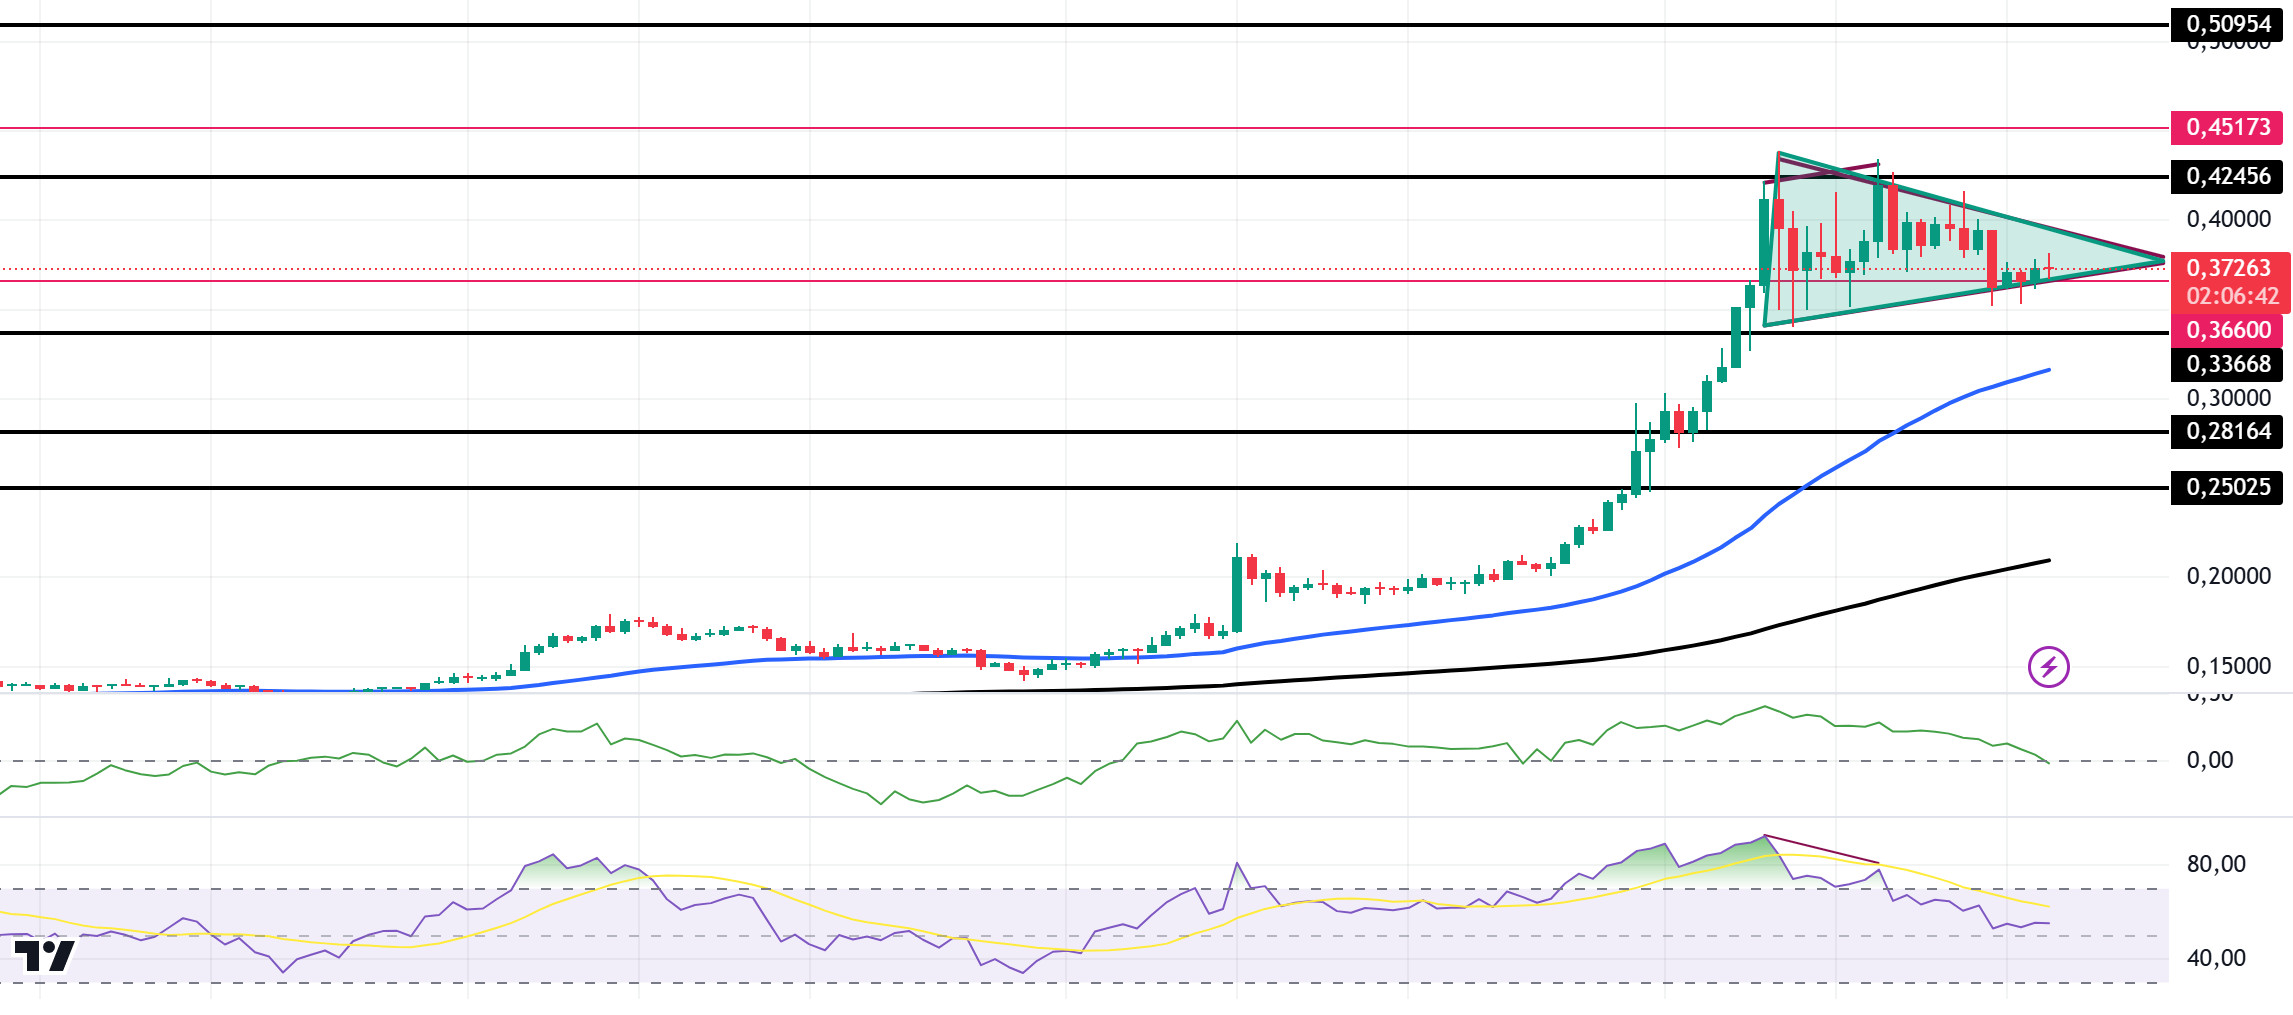
Dogecoin co-founder Billy Markus announced a potential deflationary model for DOGE on GitHub. To implement deflationary changes, the community needs to reach a consensus and gain miner support. Dogecoin’s current design includes an intentional inflation rate, with 5 billion DOGE added each year. Dogecoin’s supply currently stands at 146.78 billion units and increases by 5 billion every year. While this may sound inflationary, Markus said that the actual inflation rate decreases inversely proportional to the increasing supply of the coin. For Dogecoin to adopt a deflationary model, the community will need to support the proposed changes. On the 4-hour timeframe, the 50 EMA (Blue Line) continues to be above the 200 EMA (Black Line). This could mean that the uptrend will continue. However, the gap between the two averages has widened too much to 49.85%. This could cause pullbacks. At the same time, the Relative Strength Index (RSI)14 has moved from overbought to neutral territory. Also, there is a mismatch between the chart and the RSI. This is a bearish signal. However, when we examine the Chaikin Money Flow (CMF)20 indicator, money inflows seem to have turned negative. On the other hand, a flag pennant pattern has formed. In a scenario where this pattern works, DOGE may reach an all-time high. The 0.42456 level appears to be a very strong resistance point in the rises driven by both macroeconomic conditions and innovations in the Doge coin. If DOGE, which tested here, maintains its momentum and rises above this level, the rise may continue strongly. In case of retracements due to possible macroeconomic reasons or profit sales, the support levels of 0.33668 and 0.28164 can be triggered again. If the price hits these support levels, a potential bullish opportunity may arise if momentum increases.
Supports 0.36600 – 0.33668 – 0.28164
Resistances 0.42456 – 0.45173 – 0.50954
LEGAL NOTICE
The investment information, comments and recommendations contained herein do not constitute investment advice. Investment advisory services are provided individually by authorized institutions taking into account the risk and return preferences of individuals. The comments and recommendations contained herein are of a general nature. These recommendations may not be suitable for your financial situation and risk and return preferences. Therefore, making an investment decision based solely on the information contained herein may not produce results in line with your expectations.
