MARKET SUMMARY
Latest Situation in Crypto Assets
| Assets | Last Price | 24h Change | Dominance | Market Cap. |
|---|---|---|---|---|
| BTC | 89,753.13 | -0.87% | 58.73% | 1,78 T |
| ETH | 3,076.13 | -0.83% | 12.25% | 370,90 B |
| SOLANA | 239.50 | 3.78% | 3.76% | 113,78 B |
| DOGE | 0.3618 | -0.28% | 1.76% | 53,17 B |
| XRP | 1.138 | 1.64% | 2.14% | 64,84 B |
| CARDANO | 0.7319 | 0.84% | 0.85% | 25,65 B |
| TRX | 0.2019 | 2.70% | 0.58% | 17,45 B |
| SHIB | 0.00002434 | -0.82% | 0.47% | 14,35 B |
| AVAX | 34.35 | -5.53% | 0.47% | 14,08 B |
| LINK | 14.35 | 1.97% | 0.30% | 9,04 B |
| DOT | 5.710 | 2.31% | 0.29% | 8,71 B |
*Prepared on 11.18.2024 at 13:30 (UTC)
WHAT’S LEFT BEHIND
Weekly Crypto Fund Report: $2.2 Billion Net Investment
According to CoinShares’ weekly crypto fund report, there was a net investment inflow of $2.2 billion into crypto funds last week. Total crypto fund value under management reached an all-time high of $138 billion. During this period, $1.4 billion was invested in Bitcoin funds, while Ethereum funds broke their long stagnation and recorded an inflow of $646 million. This inflow to Ethereum funds corresponds to 5% of the total Ether funds under management.
Elon Musk: “I Still Own Too Much Dogecoin”
On November 18, Dogecoin user interface designer DogeDesigner shared an audio recording of Elon Musk. “I still have a lot of Dogecoin and SpaceX has a lot of Bitcoin,” Musk said in this recording. This statement once again emphasized Musk’s support for cryptocurrencies.
Two New Stablecoins from Tether for the European Market
Tether took an important step for the European market and introduced two new stablecoins, USDQ and EURQ, which are compliant with MiCA regulations. These stablecoins, which will run on the Ethereum network, will be backed by fiat currencies and will be listed on the Bitfinex and Kraken exchanges on November 21st. By partnering with Quantoz, Tether aims to gain a strong position in the European stablecoin market.
Giant Bitcoin Purchase from MicroStrategy
MicroStrategy bought an additional 51,780 Bitcoin with proceeds from share sales between November 11 and 17, 2024. The company spent $4.6 billion on this purchase. This large investment once again demonstrated MicroStrategy’s commitment to its Bitcoin strategy.
HIGHLIGHTS OF THE DAY
Important Economic Calender Data Time
| Time | News | Expectation | Previous |
|---|---|---|---|
| 15:00 | FOMC Member Goolsbee Speaks | – | – |
| 16:00 | Oasis (ROSE) 176MM Token Unlock | – | – |
INFORMATION
*The calendar is based on UTC (Coordinated Universal Time) time zone.
The economic calendar content on the relevant page is obtained from reliable news and data providers. The news in the economic calendar content, the date and time of the announcement of the news, possible changes in the previous, expectations and announced figures are made by the data provider institutions. Darkex cannot be held responsible for possible changes that may arise from similar situations.
MARKET COMPASS
Wall Street indices are expected to make a horizontal start to the new day after European stock markets traded on the negative side. While the dollar index could not maintain its intraday gains, it remains at the highest levels in the last two years. Digital assets declined during European trading as investors looked to take some money off the table. We find the news about MicroStrategy’s BTC holdings important, but the fact that the company will make these investments may be largely in the price. There are no major developments that could have an impact to change the current situation later in the day. However, we can say that investors will be more careful about geopolitical risks. Also, Federal Open Market Committee (FOMC) member Goolsbee’s statements will be under scrutiny.
From the short term to the big picture.
The victory of former President Trump, one of the main pillars of our bullish expectation for the long-term outlook in digital assets, produced a result in line with our forecasts. The continuation of the Fed’s rate-cutting cycle (albeit with cautious messages from Powell…) and the inflows into BTC ETFs, indicating an increase in institutional investor interest (in addition to MicroStrategy’s BTC purchases, Microsoft starting to consider a purchase…), support our upside forecast for the big picture for now.
In the short term, given the nature of the market and pricing behavior, we think it would not be surprising to see occasional respite or pullbacks in digital assets. At this point, it is worth reiterating that fundamental dynamics remain bullish. While the fact that Bitcoin, the largest digital currency, has extended its record highs several times may continue to whet the appetite of buyers to take new, upside positions, we will watch this group struggle with the masses who may want to take profit realizations and speculators who want to take advantage of potential declines after rapid rises. During this struggle, volatility is likely to increase, as it has so far.
TECHNICAL ANALYSIS
BTC/USDT
US-based spot Bitcoin ETFs continue to lead to a decline in Bitcoin supply. Research shows that ETFs have increased their share of total Bitcoin supply from 3.15% to 5.33% in 10 months, representing a significant increase in accumulation. This increase coincided with the rises in Bitcoin prices in March and November. It is also predicted that President D. Trump’s steps regarding reserve assets will continue the upward trend in ETFs.
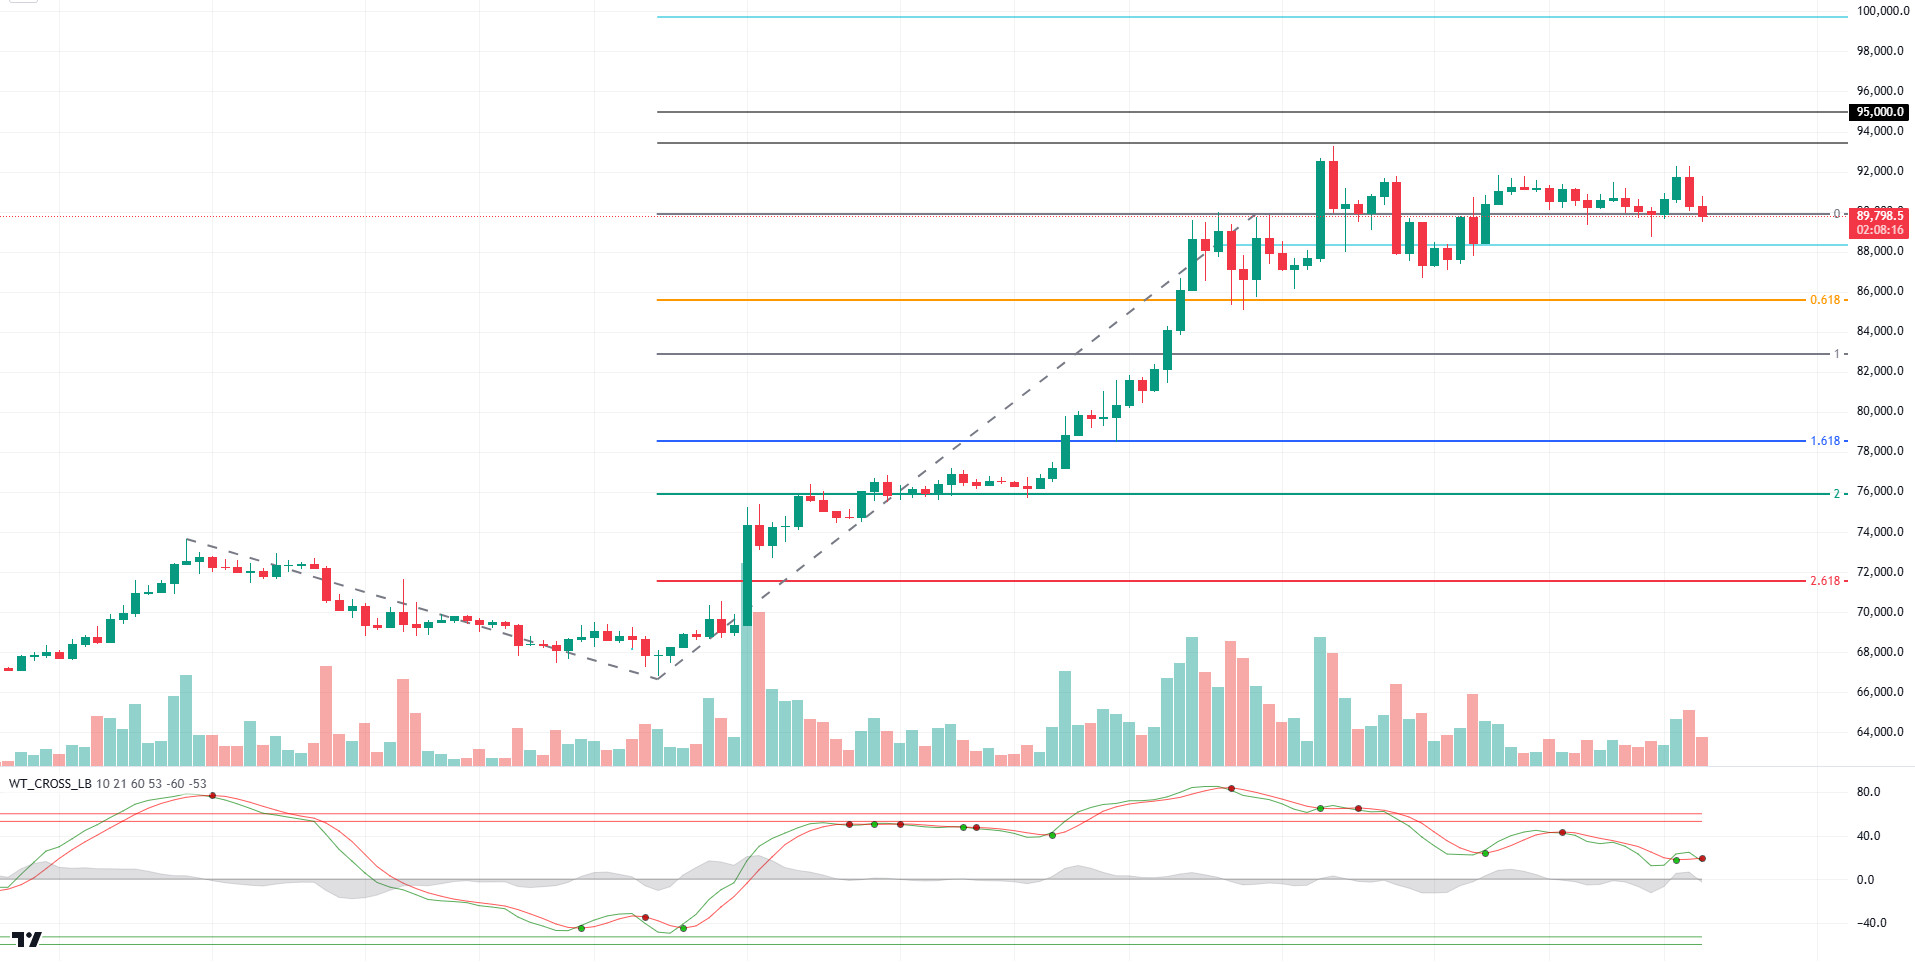
When we look at the BTC technical outlook, the price, which tested the 92,250 level during the day, turned its direction down again and is currently pricing at 89,500 just below the support level of 90,000. The price, which does not have enough momentum towards the ATH level, is seen to give a sell signal on the technical oscillator. BTC, which forms a horizontal trend channel within the major uptrend, displays a parallel image with the negative inflows on the spot ETF side in the last two days. Re-establishing positive inflows on the spot ETF side may cause a new uptrend in BTC price. Otherwise, hourly closes below the 90,000 level could lead to a retest of the 87,000 level.
Supports 90,000 – 87,000 – 85,500
Resistances 91,350 – 93,000 – 95,000
ETH/USDT
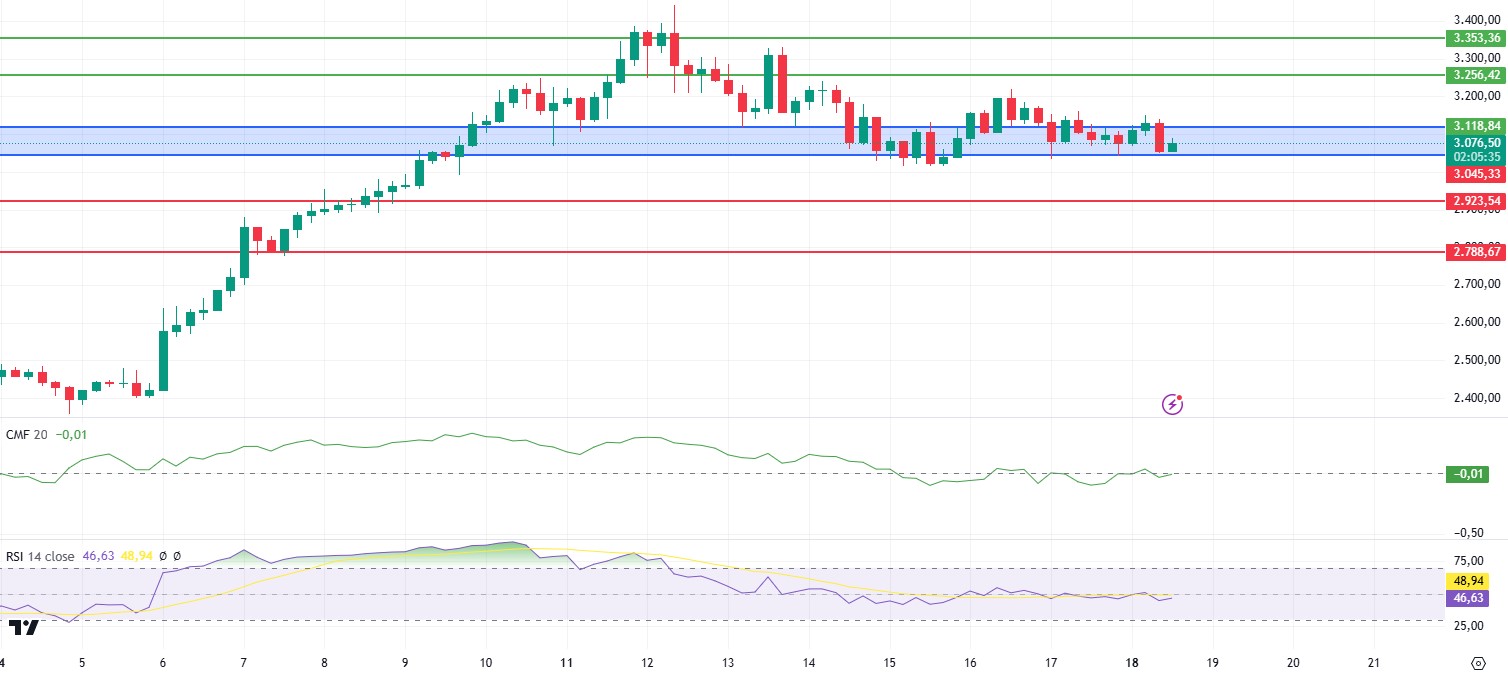
ETH failed to hold above the 3,118 level and fell back to the area indicated by the blue box on the chart. Finding support from the 3.045 lower band, ETH continues to accumulate. The horizontal movement of the Chaikin Money Flow (CMF) value in the zero band also indicates that the horizontal movement may continue. It can be said that the direction can be determined according to the breakouts of the blue area. According to this idea, ETH, which we can see retracements to 2.923 levels below the 3.045 level, can rise up to the 3.256 region if it persists above the 3.118 level.
Supports 3,045 – 3,923 – 2,788
Resistances 3,118 – 3,256 – 3,353
XRP/USDT
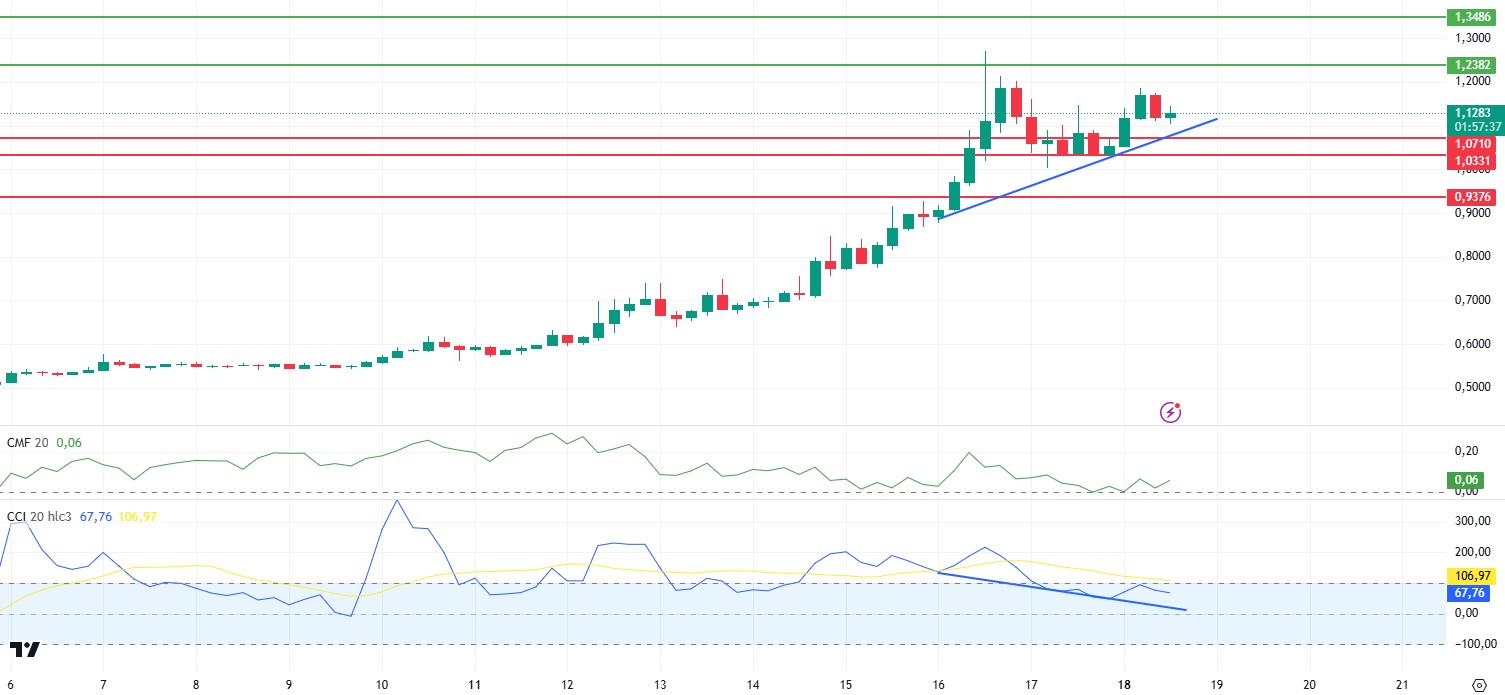
XRP continues to accumulate in a wide range between 1.03 and 1.23 levels after the rally. The positive structure on the Commodity Channel Index (CCI) and the Chaikin Money Flow (CMF) value remaining positive may enable a retest of 1.23 levels. In the region between 1.07 intermediate support and 1.03 key support level, it can be said that reaction purchases may come in possible declines. A loss of this range could start a downtrend.
Supports 1.0709 – 1.0333 – 0.9382
Resistances 1.2386 – 1.3487 – 1.4463
SOL/USDT
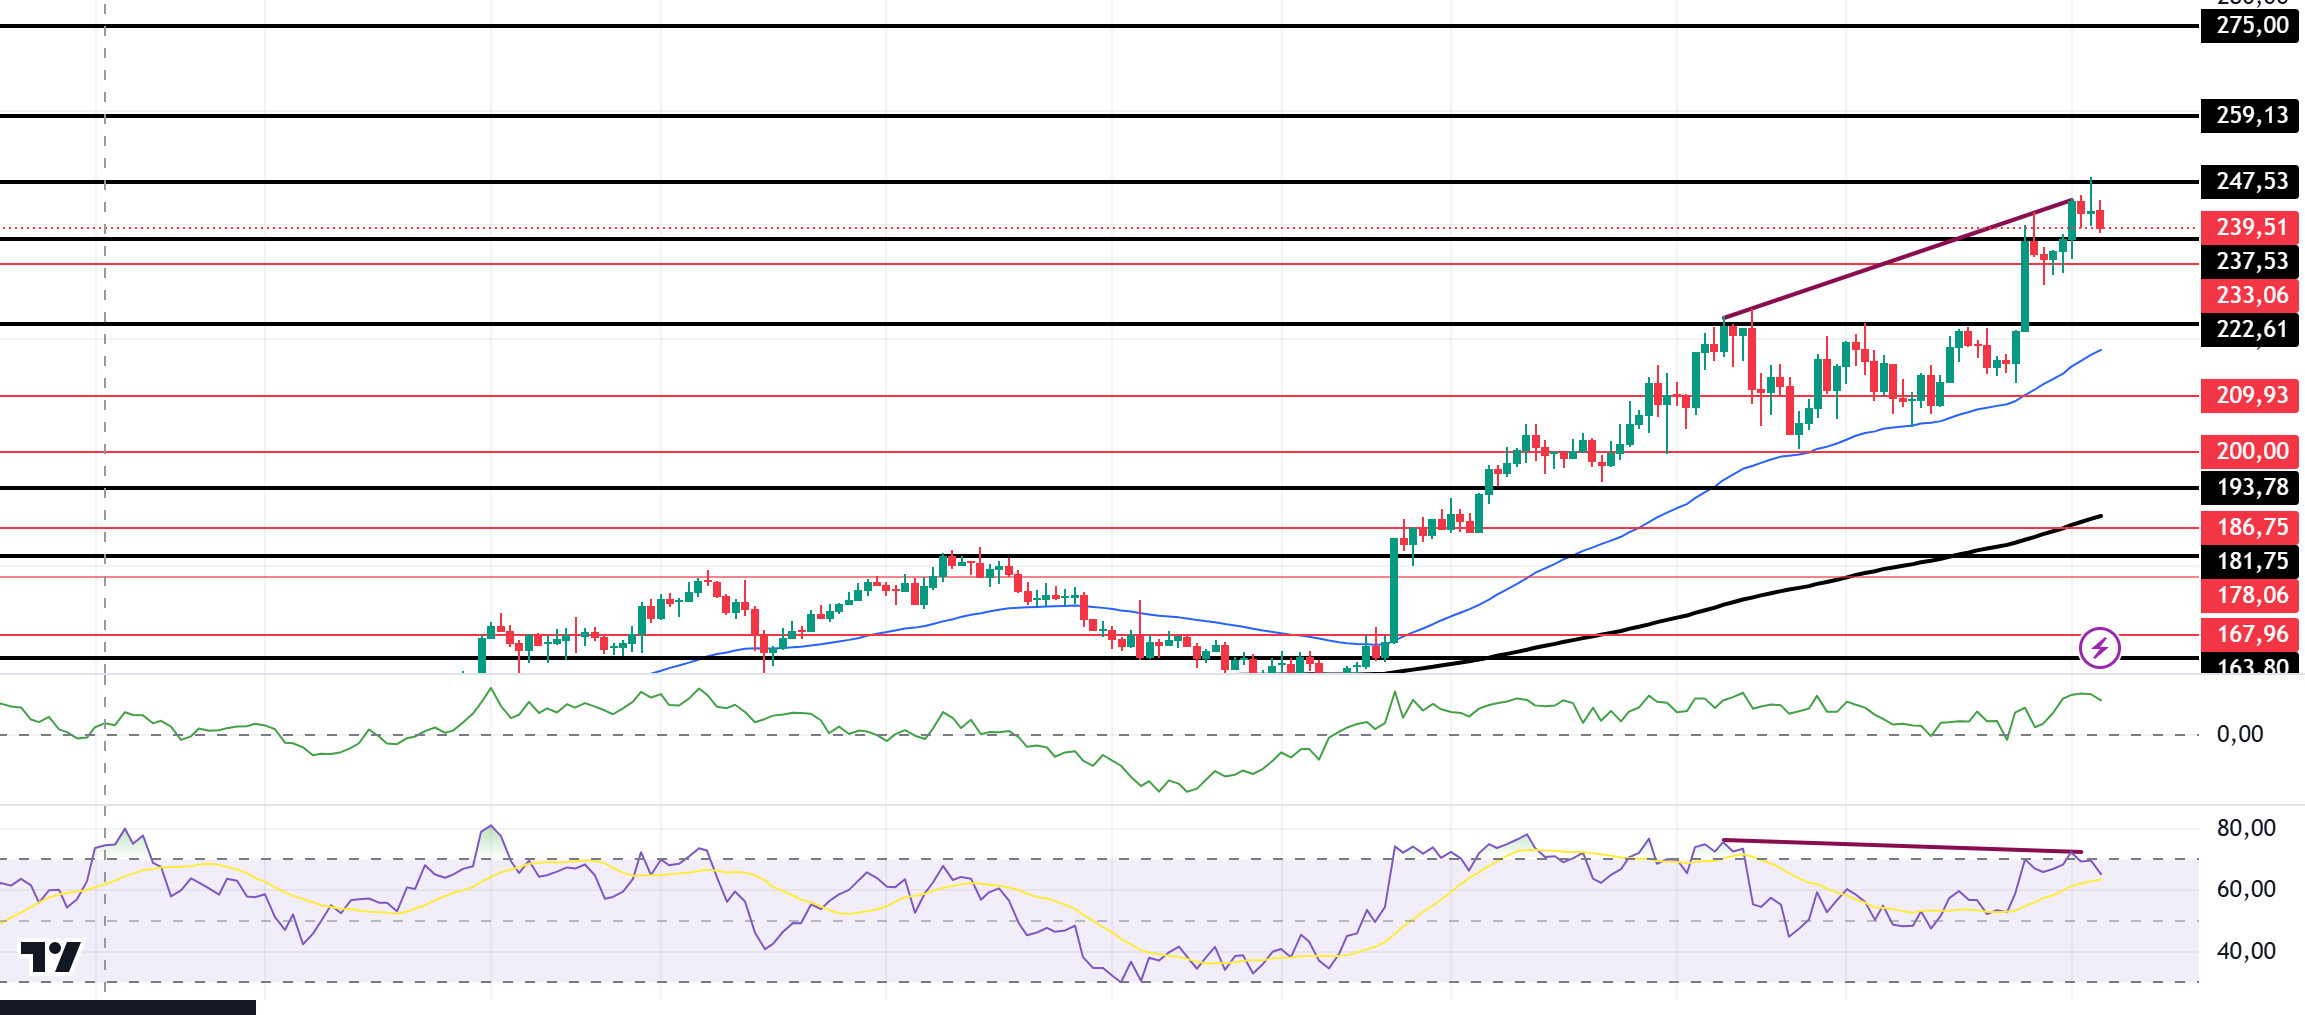
Solana’s market capitalization reached an all-time high of $117 billion. Solana-based decentralized applications (DApps) have recorded record fees and revenue in the last 24 hours, driven by the renewed meme coin craze. Raydium, an automated market maker that collected a record $11.31 million in fees on November 17, stands out. Technically, the 50 EMA (Blue Line) continues to be above the 200 EMA (Black Line) in the 4-hour timeframe. This may mean that the uptrend will continue. However, when we examine the Chaikin Money Flow (CMF)20 indicator, money inflows are positive, but inflows have started to decrease. At the same time, Relative Strength Index (RSI)14 remained in the overbought zone. This may mean that there may be a sell-off. The 247.53 level is a very strong resistance point in the uptrend driven by both macroeconomic conditions and innovations in the Solana ecosystem. If it breaks here, the rise may continue. In case of retracements due to possible macroeconomic reasons or profit sales, the support levels of 222.61 and 193.78 can be triggered again. If the price reaches these support levels, a potential bullish opportunity may arise if momentum increases.
Supports 237.53 – 233.06 – 222.61
Resistances 247.53 – 259.13 – 237.53
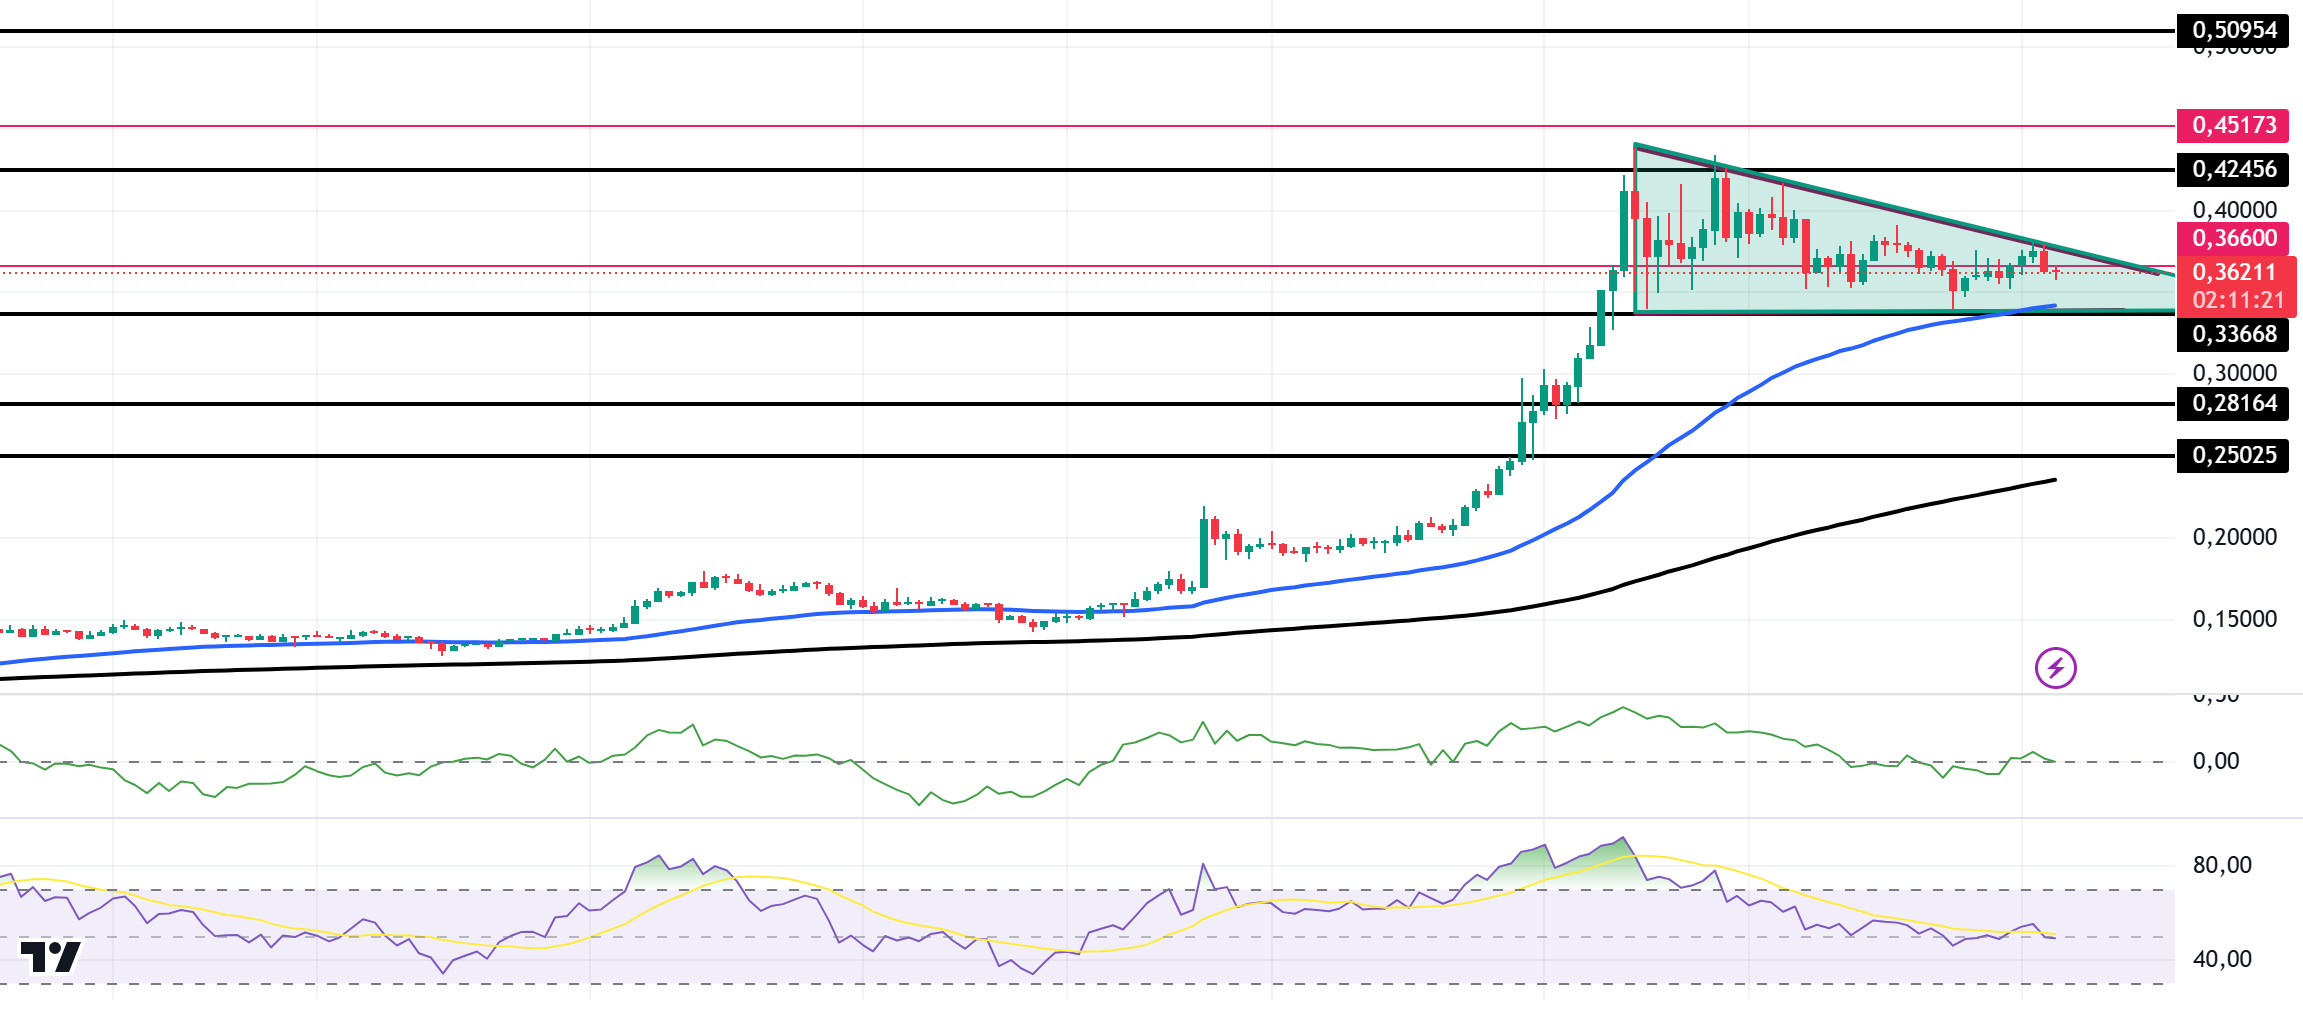
DOGE/USDT
On the 4-hour timeframe, the 50 EMA (Blue Line) continues to be above the 200 EMA (Black Line). This could mean that the uptrend will continue. However, the gap between the two averages has widened too much to 45.21%. This could cause pullbacks. At the same time, Relative Strength Index (RSI)14 has moved from overbought to neutral territory. However, when we examine the Chaikin Money Flow (CMF)20 indicator, money inflows seem to have moved into the negative zone. On the other hand, the descending triangle pattern shows us that the price may fall. This is also supported by the RSI indicator, which has turned positive. The 0.42456 level appears to be a very strong resistance place in the rises caused by both macroeconomic conditions and innovations in the Doge coin. If DOGE, which tested here, maintains its momentum and rises above this level, the rise may continue strongly. In case of retracements due to possible macroeconomic reasons or profit sales, the support levels of 0.33668 and 0.28164 can be triggered again. If the price hits these support levels, a potential bullish opportunity may arise if momentum increases.
Supports 0.36600 – 0.33668 – 0.28164
Resistances 0.42456 – 0.45173 – 0.50954
LEGAL NOTICE
The investment information, comments and recommendations contained herein do not constitute investment advice. Investment advisory services are provided individually by authorized institutions taking into account the risk and return preferences of individuals. The comments and recommendations contained herein are of a general nature. These recommendations may not be suitable for your financial situation and risk and return preferences. Therefore, making an investment decision based solely on the information contained herein may not produce results in line with your expectations.