MARKET SUMMARY
Latest Situation in Crypto Assets
| Assets | Last Price | 24h Change | Dominance | Market Cap |
|---|---|---|---|---|
| BTC | 97,851.44 | 0.31% | 59.39% | 1,93 T |
| ETH | 3,298.60 | -1.50% | 12.18% | 396,69 B |
| SOLANA | 254.28 | 4.02% | 3.71% | 120,95 B |
| XRP | 1.418 | 25.78% | 2.47% | 80,35 B |
| DOGE | 0.3980 | 2.65% | 1.79% | 58,24 B |
| CARDANO | 0.8931 | 12.09% | 0.96% | 31,26 B |
| TRX | 0.1978 | -1.64% | 0.52% | 17,08 B |
| AVAX | 38.13 | 6.89% | 0.48% | 15,56 B |
| SHIB | 0.00002452 | -1.76% | 0.45% | 14,49 B |
| LINK | 14.98 | 9.97% | 0.29% | 9,42 B |
| DOT | 6.063 | 2.55% | 0.28% | 9,22 B |
*Prepared on 11.22.2024 at 14:00 (UTC)
WHAT’S LEFT BEHIND
Ethereum Futures Open Interest at Record High
CryptoQuant reported that open positions in Ethereum futures reached an all-time high of $20.8 billion. The increase in open interest exceeded 12% and the funding ratio was 0.0374%, indicating that the market is bullish in the short term. The increase in the weighted funding ratio indicates the dominance of bullish investors, the report said.
UK Prepares to Publish Crypto and Stablecoin Regulations
The UK Treasury plans to prepare a comprehensive framework for the regulation of cryptocurrencies and stablecoins. Economy Minister Tulip Siddiq announced that the rules, to be published in early 2025, will establish a regime covering crypto assets, stablecoins and staking services. The UK aims to keep pace with regulatory developments in the US and Europe.
ETH Whale Sells $224 Million in Sales
According to Lookonchain, a whale account that bought 398,900 ETH at an average of $6 in 2016 is on the move after eight years. The whale sold 73,356 ETH in a transaction worth about $224 million. The account still holds 325,500 ETH, which is worth about $1.1 billion at the current market price.
HIGHLIGHTS OF THE DAY
Important Economic Calender Data
| Time | News | Expectation | Previous |
|---|---|---|---|
| 14:45 | US Manufacturing PMI (Nov) | 48.8 | 48.5 |
| 14:45 | US Services PMI (Nov) | 55.2 | 55.0 |
| 15:00 | US Michigan Consumer Sentiment (Nov) | 74.0 | 73.0 |
INFORMATION
*The calendar is based on UTC (Coordinated Universal Time) time zone. The economic calendar content on the relevant page is obtained from reliable news and data providers. The news in the economic calendar content, the date and time of the announcement of the news, possible changes in the previous, expectations and announced figures are made by the data provider institutions. Darkex cannot be held responsible for possible changes that may arise from similar situations.
MARKET COMPASS
In digital assets, we saw some respite after the recent rally. Poor PMI data from European countries brought the European Central Bank (ECB) a little closer to interest rate cuts, while we saw a rise in the dollar with the depreciation in the euro. The continent’s indices are generally in positive territory and Wall Street is expected to start the day mixed and flat. Later in the day, PMI figures for the US economy will be under the spotlight.
From the short term to the big picture.
The victory of former President Trump on November 5, which was one of the main pillars of our bullish expectation for the long-term outlook in digital assets, produced a result in line with our forecasts. Despite Powell’s cautious messages in his last speech, the Fed’s continuation of the interest rate cut cycle, and the volume in BTC ETFs, indicating an increase in institutional investor interest (in addition to MicroStrategy’s BTC purchases, Microsoft starting to evaluate the purchase, BlackRock’s BTC ETF options trading…), support our upside forecast for the big picture for now.
In the short term, given the nature of the market and pricing behavior, we think it would not be surprising to see occasional respite or pullbacks in digital assets. We also see today’s action during European trading in this context. At this point, it would be useful to underline again that fundamental dynamics remain bullish. While Bitcoin, the largest digital currency, extending each of its record highs may continue to whet the appetite of buyers to take new, upside positions, we will watch this group struggle with the masses who may want to take profit realizations and speculators who want to take advantage of potential declines after rapid rises.
TECHNICAL ANALYSIS
BTC/USDT
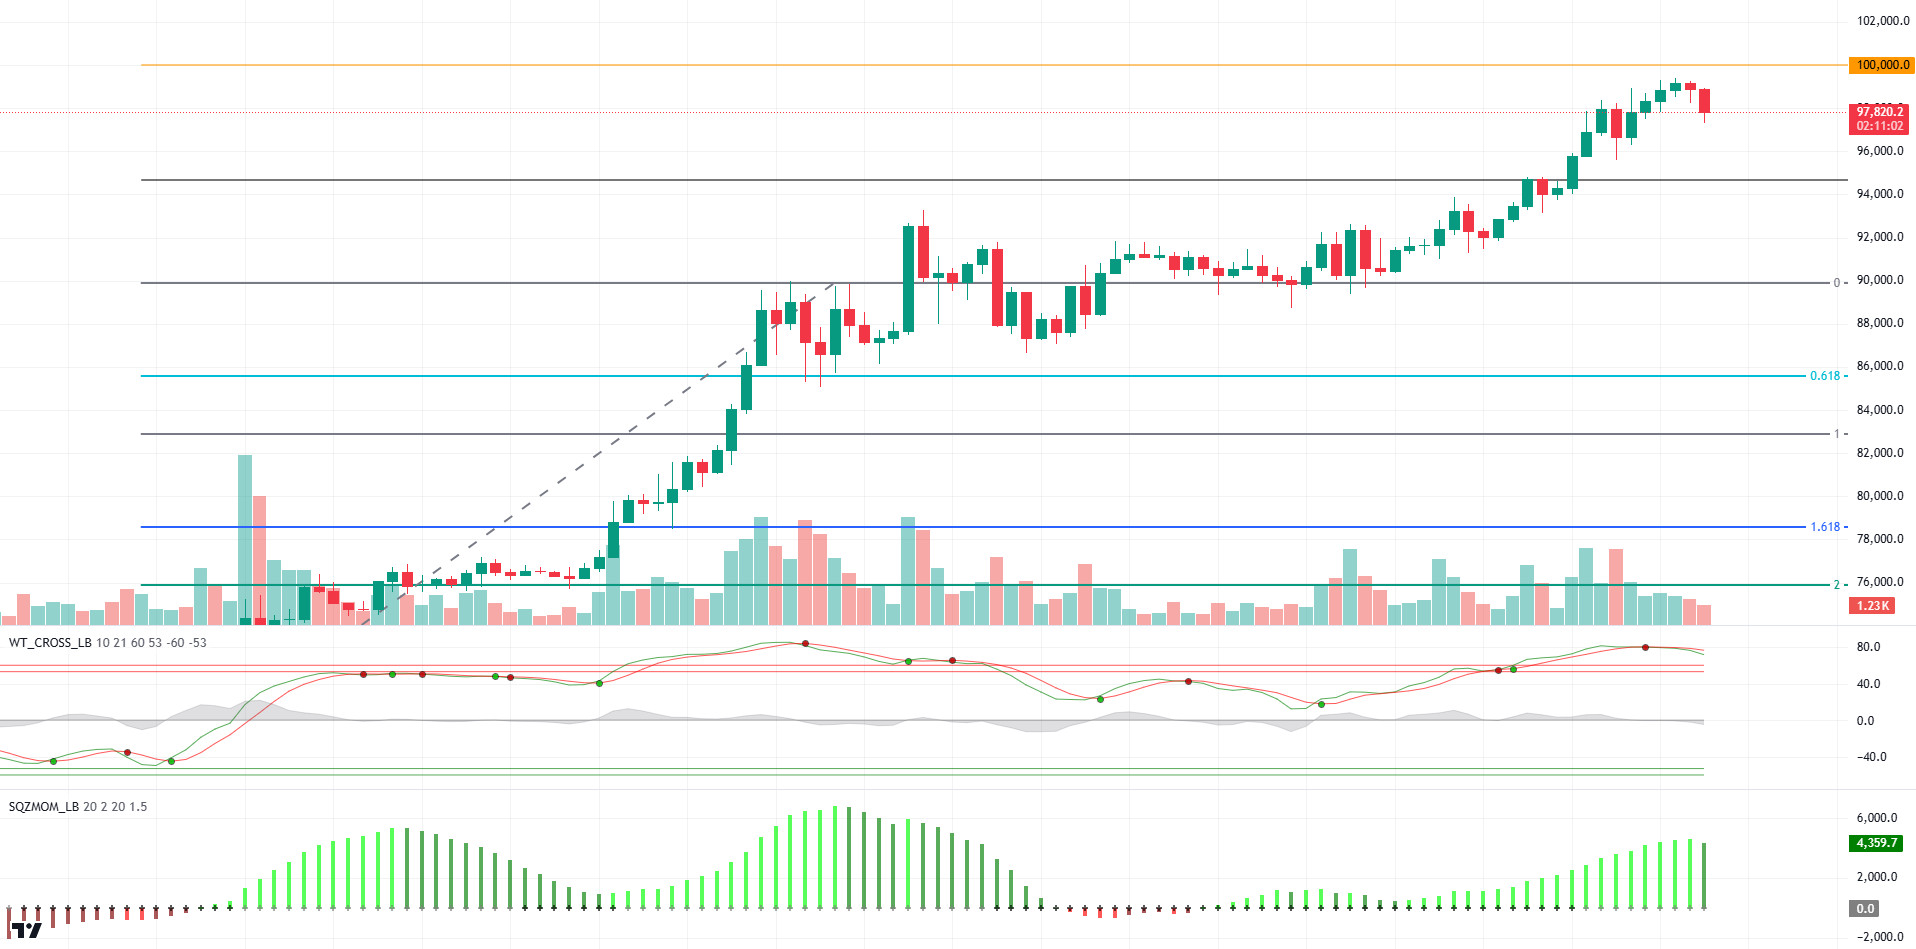
Bitcoin has been on a parabolic rally that has lasted nearly 300 days in the historical cycle. In the last month, it has recorded double-digit gains, reaching the ATH level of $99,502. One of the biggest drivers of this rise has been the intense interest in Bitcoin spot ETFs. Yesterday, 12 Bitcoin ETFs totaled $1 billion in net inflows, bringing total cumulative flows to $30.35 billion. BlackRock’s IBIT ETF took the lead in these inflows, leading with $608.41 million. It was followed by Fidelity’s FBTC ETF with inflows of $300.95 million.
Looking at the technical outlook after the spot ETF data, we observe that the price retreated slightly after reaching 99,502 during the day. Currently trading at 97,800, BTC is preparing towards the psychological threshold of 100,000. Positive fundamental factors continue to support upward movements in BTC price. While technical oscillators continue to give a sell signal on hourly charts, some weakening in the squeeze momentum indicator is noticeable. We will follow the 95,000 level in a possible pullback in order to regain momentum.
Supports 95,000 – 92,500 – 90,000
Resistances 99,314 – 100,000 – 105,000
ETH/USDT
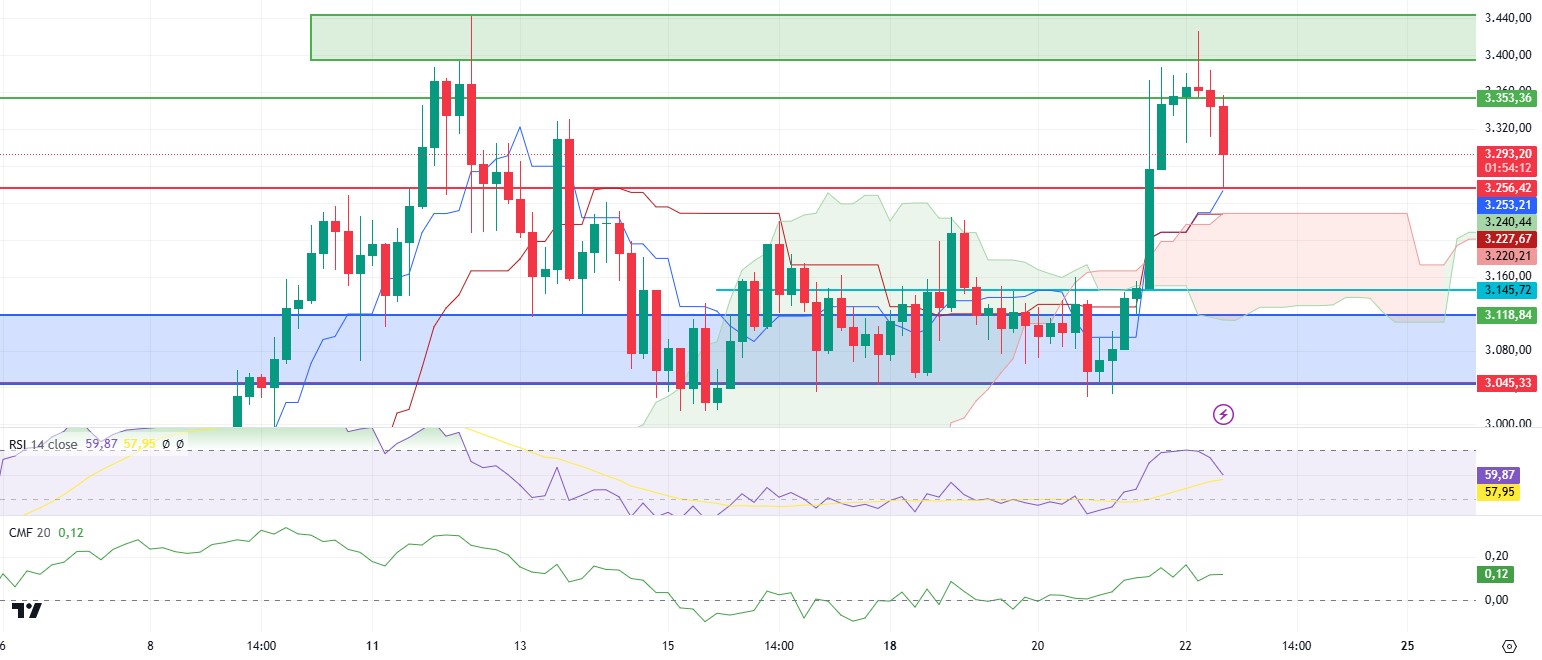
As mentioned in the morning analysis, ETH has performed a re-test with the loss of the 3,353 level, falling to the 3,256 level. It is seen that the tenkan level for ETH, which is trying to rise above the 3,300 level again by reacting from this strong support level, is also converging to the 3,256 level. When the Cumulative Volume Delta (CVD) is analyzed, the fact that the decline is futures-weighted may indicate that the decline is a correction movement, and that momentum rises may come with the regain of the 3,353 level. The fact that Chaikin Money Flow (CMF) did not retreat after the correction continues the positive outlook. The fall of Relative Strength Index (RSI) from the overbought zone to 60 levels can be considered as another positive factor. A break of the 3,256 level, where the support zone is strengthening, may bring about steeper declines. The area marked in blue on the chart is the strongest support zone and it seems likely that the price will react after possible declines to this level. On the other hand, it can be said that the area marked in green on the chart is the strongest resistance zone. Breaks above this area could open the door to big rises for ETH.
Supports 3,256 – 3,145 – 3,045
Resistances 3,353 – 3,534 – 3,680
XRP/USDT
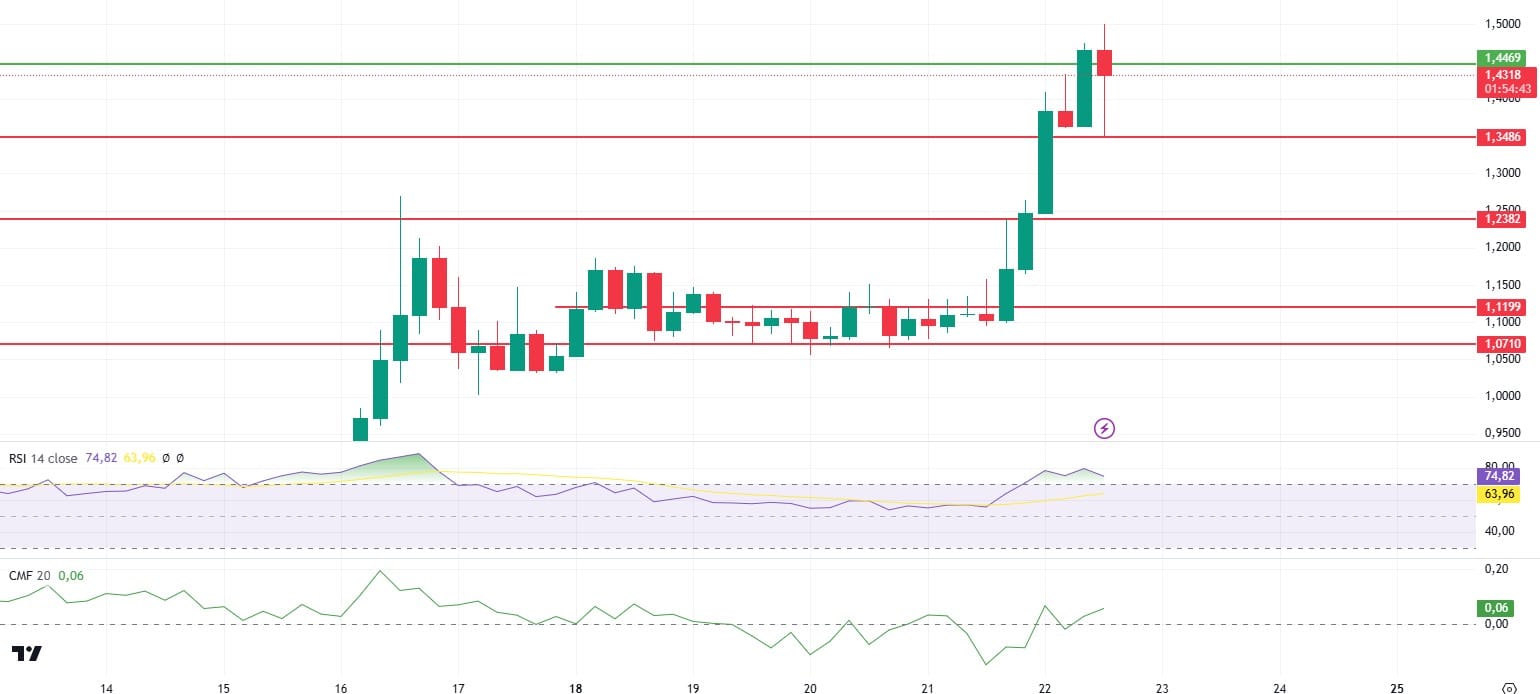
While the momentum for XRP, which rallied sharply after WisdomTree announced a new XRP-based ETP, remained in place, the price, which managed to rise above the 1.44 resistance during the day, managed to hold above the 1.40 level after a re-test to the 1.34 level. With this pullback, the fact that the Relative Strength Index (RSI) remains in the overbought zone and the horizontal outlook in Chaikin Money Flow (CMF) may indicate that traders should be careful at these levels. With the loss of 1.34 level, declines may come down to 1.23 levels. Above 1.44, we can see that the rise continues up to 1.55.
Supports 1.3486 – 1.2382 – 1.0710
Resistances 1.4469 – 1.5517 – 1.7043
SOL/USDT
Manufacturing PMI and services PMI data from the US will be among the data to be monitored today.
VanEck and 21Shares apply to list Solana ETF on Cboe as Momentum Builds. Despite past skepticism surrounding crypto-related ETFs, especially ahead of the 2024 US presidential election, there has been a shift in market sentiment. The potential appointment of a pro-crypto SEC chairman under a new administration has built confidence among asset managers and investors. However, the timeline for a final decision remains uncertain.
In the Solana ecosystem, a whale recently bought 100,000 SOLs worth $23.86 million. It recorded a $311 million stablecoin inflow in the last 24 hours, the largest inflow ever. Meanwhile, Solana’s 24-hour trading volume increased by 9.41% to $7.31 billion.
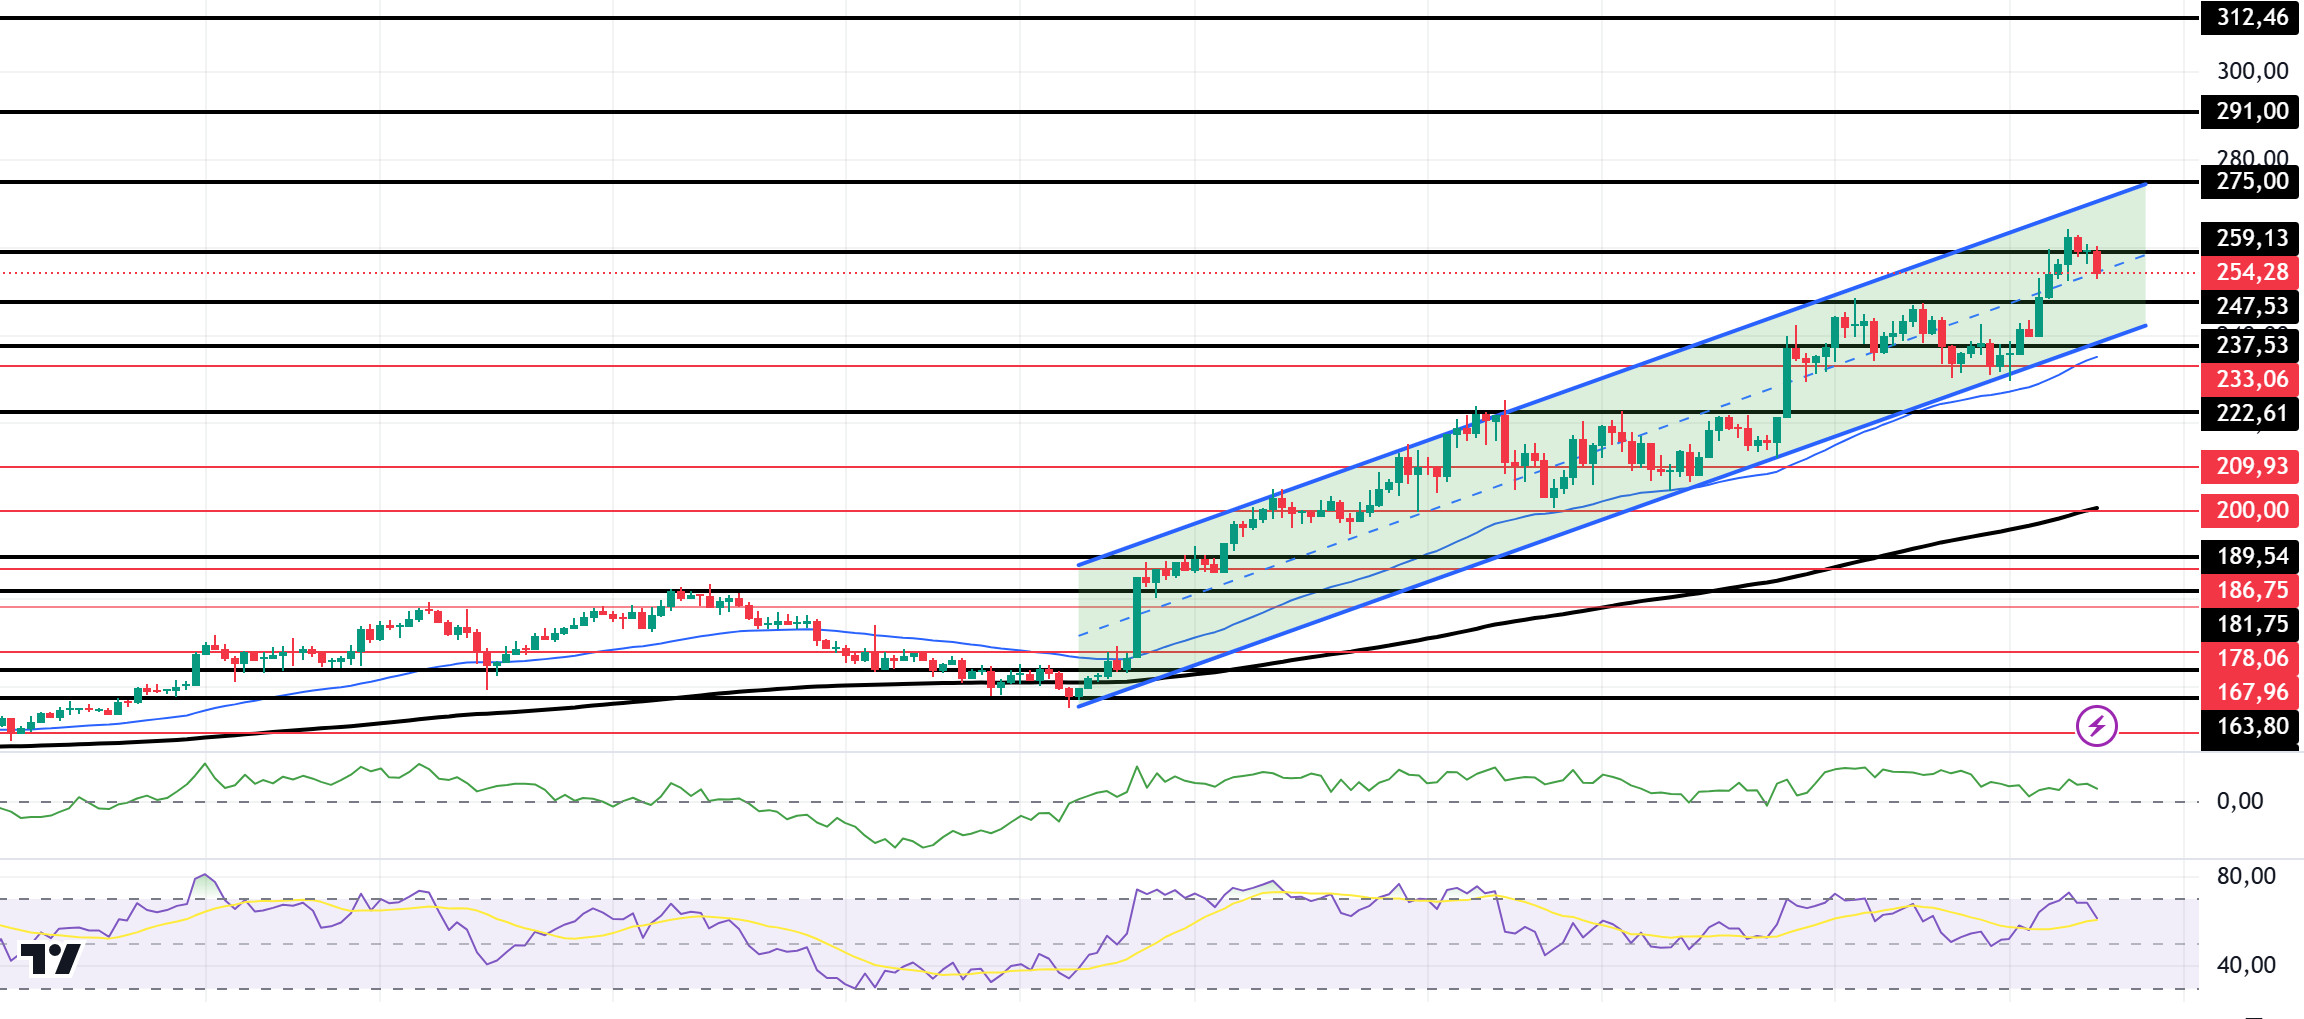
On the 4-hour timeframe, the 50 EMA (Blue Line) continues to be above the 200 EMA (Black Line). Since November 4, SOL, which has been in an uptrend, continues to be priced by maintaining this trend. However, when we examine the Chaikin Money Flow (CMF)20 indicator, although money inflows are positive, there is a decline in inflows again. At the same time, Relative Strength Index (RSI)14 declined slightly from the overbought zone. This may increase profit taking. The 275.00 level is a very strong resistance point in the uptrend driven by both macroeconomic conditions and innovations in the Solana ecosystem. If it breaks here, the rise may continue. In case of possible retracements due to macroeconomic reasons or profit sales, support levels 222.61 and 189.54 may be triggered again. If the price reaches these support levels, a potential bullish opportunity may arise if momentum increases.
Supports 247.53 – 237.53 – 222.61
Resistances 259.13 – 275.00 – 291.00
DOGE/USDT
Manufacturing PMI and services PMI data from the US will be among the data to be monitored today.
Musk and Ramaswamy have now announced plans to improve the efficiency of the department. According to a recent WSJ report, they planned to end the remote work culture in the federal office in an effort to cut government spending. The two entrepreneurs said that ending the remote work culture would lead to mass resignations, which would help them achieve their goal of building a small but efficient government. Dogecoin’s network, on the other hand, continues to gain strength with the hashrate climbing to 1.21 PH/s, signaling strong miner confidence.
Technically, Doge continues to consolidate above 0.35 since our analysis yesterday. However, a falling triangle formation seems to have formed. If the formation works, 0.28164 may be the target. On the 4-hour timeframe, the 50 EMA (Blue Line) is above the 200 EMA (Black Line). But the gap between the two averages is still too wide. This may cause pullbacks. At the same time, the Relative Strength Index (RSI)14 has moved from overbought to neutral. However, when we examine the Chaikin Money Flow (CMF)20 indicator, it has turned negative. Money outflows have increased. On the other hand, the bullish divergence pattern draws attention. If this pattern works, it may test the 0.50954 level. The 0.42456 level is a very strong resistance point in the rises driven by both macroeconomic conditions and innovations in the Doge coin. If DOGE, which tested here, maintains its momentum and rises above this level, the rise may continue strongly. In case of retracements due to possible macroeconomic reasons or profit sales, the support levels of 0.33668 and 0.28164 can be triggered again. If the price hits these support levels, a potential bullish opportunity may arise if momentum increases.
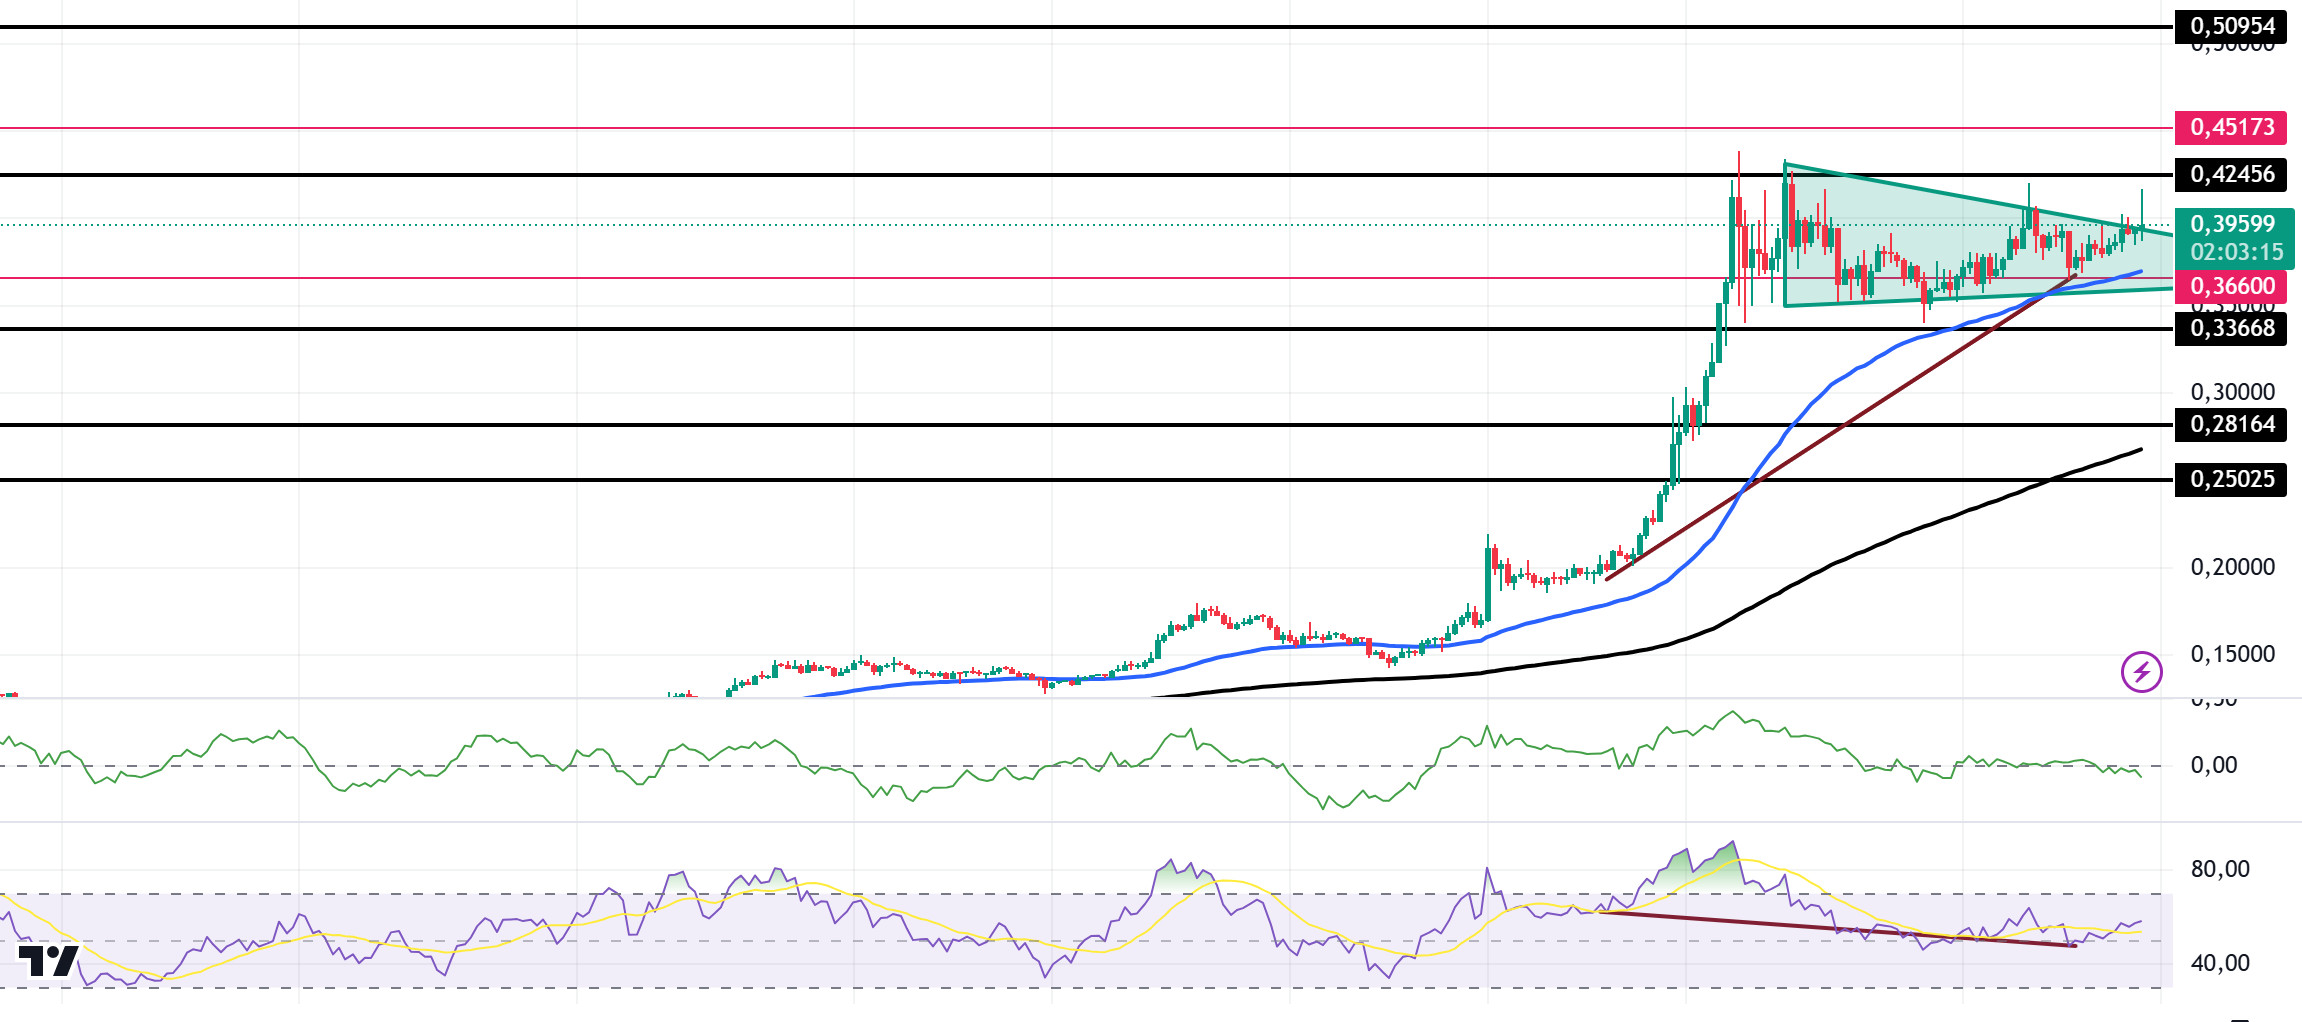
Supports 0.36600 – 0.33668 – 0.28164
Resistances 0.42456 – 0.45173 – 0.50954
LEGAL NOTICE
The investment information, comments and recommendations contained herein do not constitute investment advice. Investment advisory services are provided individually by authorized institutions taking into account the risk and return preferences of individuals. The comments and recommendations contained herein are of a general nature. These recommendations may not be suitable for your financial situation and risk and return preferences. Therefore, making an investment decision based solely on the information contained herein may not produce results in line with your expectations.


