MARKET SUMMARY
Latest Situation in Crypto Assets
| Assets | Last Price | 24h Change | Dominance | Market Cap |
|---|---|---|---|---|
| BTC | 92,314.98 | -5.52% | 57.85% | 1,83 T |
| ETH | 3,313.11 | -5.03% | 12.65% | 400,04 B |
| SOLANA | 229.63 | -8.09% | 3.44% | 108,87 B |
| XRP | 1.355 | -5.66% | 2.45% | 77,60 B |
| DOGE | 0.3779 | -9.54% | 1.76% | 55,69 B |
| CARDANO | 0.9124 | -9.96% | 1.01% | 32,01 B |
| AVAX | 41.47 | -6.10% | 0.54% | 16,99 B |
| TRX | 0.1898 | -7.60% | 0.52% | 16,41 B |
| SHIB | 0.00002395 | -6.34% | 0.45% | 14,12 B |
| DOT | 7.855 | -9.57% | 0.38% | 11,98 B |
| LINK | 16.80 | -8.90% | 0.33% | 10,55 B |
*Prepared on 11.26.2024 at 14:00 (UTC)
WHAT’S LEFT BEHIND
Donald Trump’s new mission to Elon Musk
Donald Trump, who will assume the presidency in the US in January, continues his preparations at full speed. Information obtained from Trump’s transition team indicates that there will be a person in charge of federal policies and emerging technologies in the White House. Elon Musk will also be closely involved in the unit led by this person who will also deal with artificial intelligence developments.
Morocco lifts crypto ban
Following the recent rise in Bitcoin and cryptocurrencies, global adoption is on the rise. The North African country of Morocco is also preparing to re-release cryptocurrencies after bans imposed in 2017. The relevant statement came from the head of the country’s central bank. The head of the institution also informed that they started working for CBDCs.
HIGHLIGHTS OF THE DAY
Important Economic Calender Data
| Time | News | Expectation | Previous |
|---|---|---|---|
| 15:00 | US CB Consumer Confidence (Nov) | 111.8 | 108.7 |
| 15:00 | US New Home Sales (Oct) | 725K | 738K |
| 19:00 | US FOMC Meeting Minutes | – | – |
INFORMATION
*The calendar is based on UTC (Coordinated Universal Time) time zone. The economic calendar content on the relevant page is obtained from reliable news and data providers. The news in the economic calendar content, the date and time of the announcement of the news, possible changes in the previous, expectations and announced figures are made by the data provider institutions. Darkex cannot be held responsible for possible changes that may arise from similar situations
MARKET COMPASS
European stock markets took over the declines that came with the impact of Trump’s statements that he will increase tariffs. Wall Street is pointing to a mixed opening. In digital assets, the profit realization and correction due to the impact of the news flow seems to have finally found its excuse. Although we think that a new story is needed for Bitcoin to test 6-digit levels, we think that the retracement will at least give way to “calm” after expanding for a while.
The minutes of the last meeting of the Federal Open Market Committee (FOMC) may be important for digital assets later in the day. The details between the lines of the minutes, which may shed light on the US Federal Reserve’s (FED) interest rate cut course, will be followed by global markets. Investors will be looking for clues on how close the FED is to another rate cut in December.
From the short term to the big picture.
The victory of former President Trump on November 5, which was one of the main pillars of our bullish expectation for the long-term outlook in digital assets, produced a result in line with our forecasts. Despite Powell’s cautious messages in his recent speech, the Fed’s continuation of the interest rate cut cycle, and the volume in BTC ETFs indicating an increase in institutional investor interest (in addition to MicroStrategy’s BTC purchases, Microsoft starting to evaluate the purchase issue, BlackRock’s BTC ETF options starting trading…) support our upside forecast for the big picture for now.
For the short term, given the nature of the market and pricing behavior, we think it would not be surprising to see occasional respite or pullbacks in digital assets. We also evaluate the recent movement following Trump’s statements on tariffs within this framework. At this point, it would be useful to underline again that fundamental dynamics remain bullish. We will be watching the struggle between buyers who may have a renewed appetite to take new, upward positions and speculators who may be looking for profit realization and potential declines after rapid rises. We see more ground for pullbacks after the recent news flows and this could continue for some time, though not necessarily with deep declines.
TECHNICAL ANALYSIS
BTC/USDT
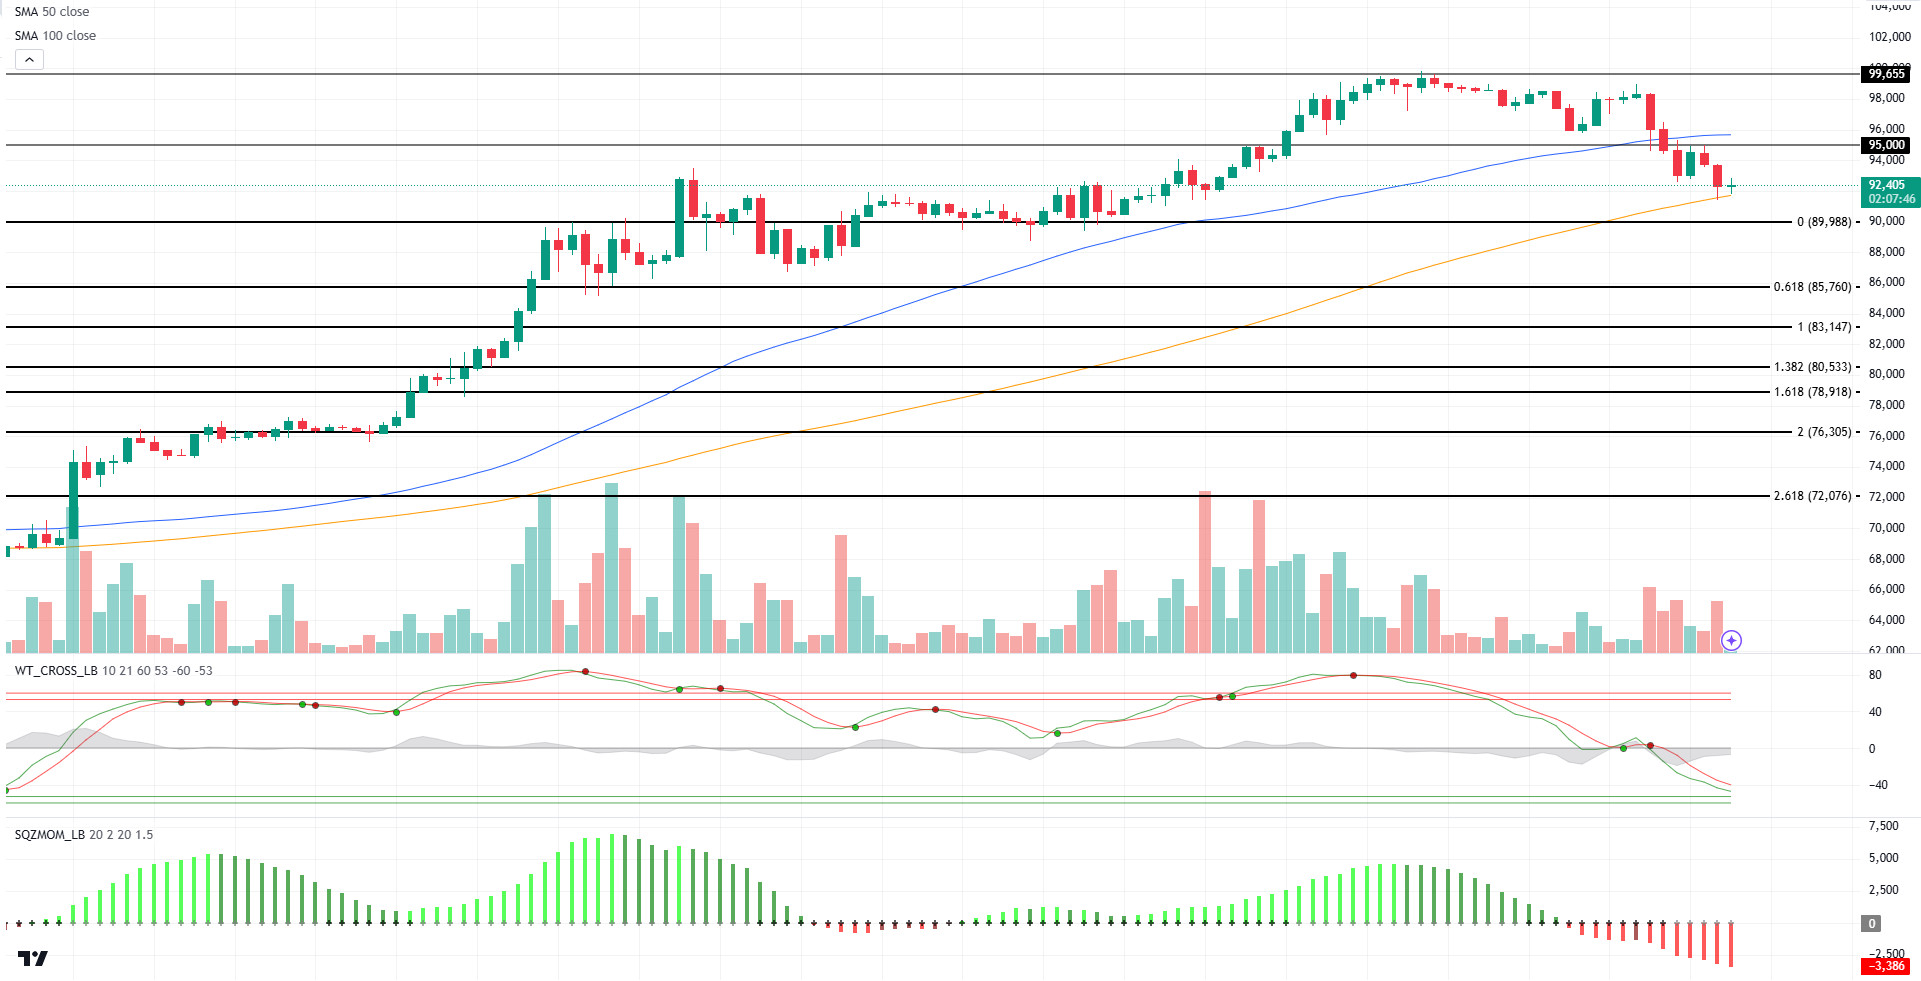
With the increasing volatility in Bitcoin, which could not break the critical threshold of 100,000, the psychological resistance level, liquidation zones on the futures side gained critical importance. In the last 24 hours, over $337 million of long positions were liquidated in the market as Bitcoin fell below the 92,000 level. When we look at the weekly liquidation chart, increasing short trades above the 99,000 level are noteworthy.
Looking at the technical outlook following the liquidation data, we observed that the minor support level of 92,500 was tested as the price broke below the 95,000 level. Above this point, which is also the 100-day simple moving average level (SMA orange line), BTC is currently trading at 92,400. Price moving above the 100-day moving average could be seen as important to regain upside momentum and target the 95,000-resistance zone. Our technical oscillator is moving close to the oversold zone on the hourly chart, while our squeeze momentum indicator continues to weaken. With the deepening of the retreat, we will monitor the major support level of 90,000.
Supports:92,500 – 90,000 – 87,000
Resistances 95,000 – 99,655 – 100,000
ETH/USDT
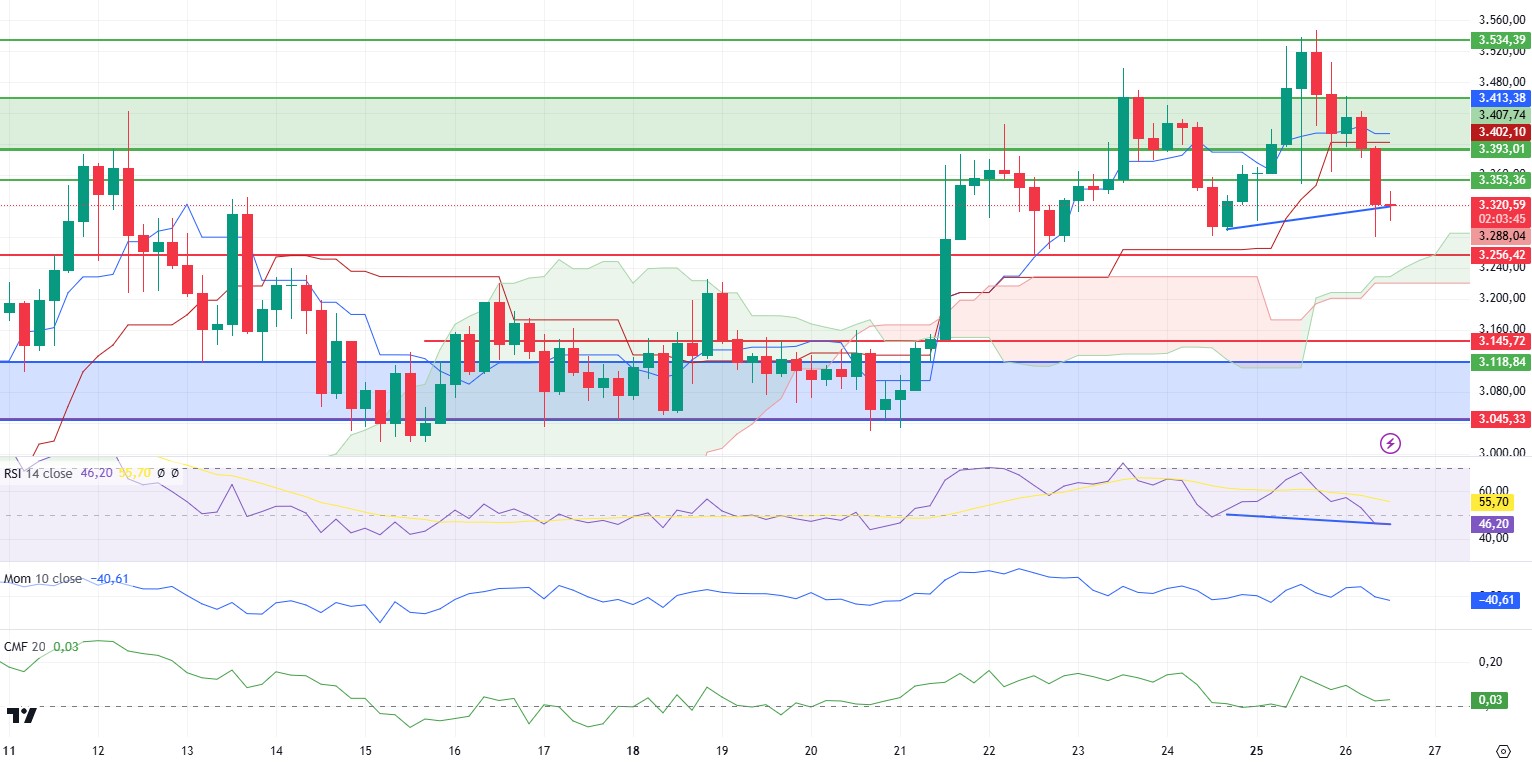
ETH fell below the 3,353 support with the loss of the 3,393 level in the morning hours. It is currently pricing above the 3,300 level. During this decline, positive divergence is seen on the Relative Strength Index (RSI). Momentum, on the other hand, has formed a double top by moving downwards again. The decline of the price below the tenkan and kijun levels and the convergence of these indicators draws a slightly negative picture. On the other hand, despite this decline, Chaikin Money Flow (CMF) has not yet reached the negative area and is heading up, indicating that buyers have an appetite. It is also seen that spot purchases are coming after the decline in Cumulative Volum Delta (CVD). In the light of this data, it can be said that as long as the 3,256 zone is not lost, the uptrend remains intact and there is a high probability of a renewed attack to 3,534 levels. Loss of the 3,256 level may disrupt the trend and cause the decline to deepen.
Supports 3,256 – 3,145 – 3,045
Resistances 3,353 – 3,393 – 3,534
XRP/USDT
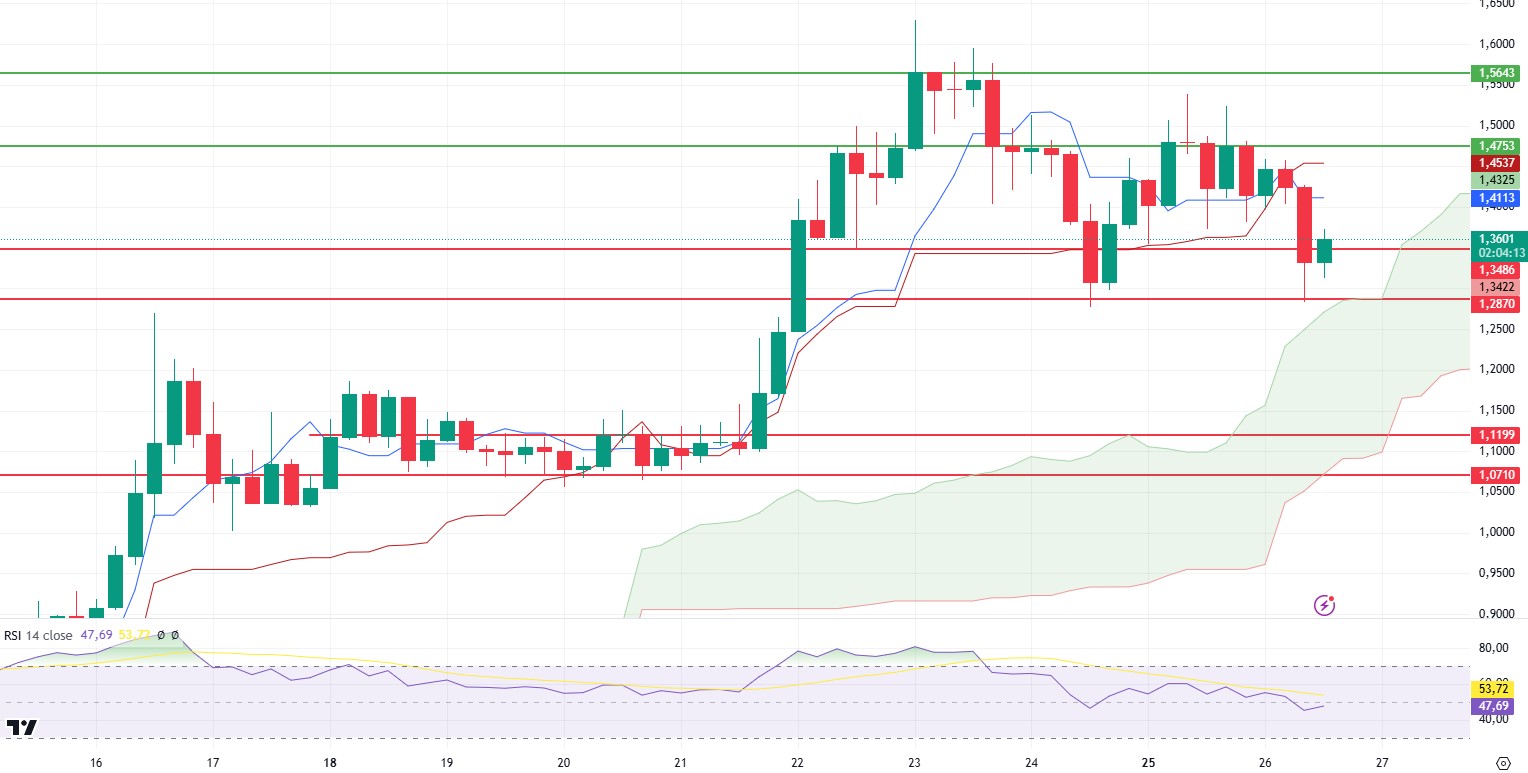
As mentioned in the morning analysis, XRP fell below 1.34 with the negative structure on the Relative Strength Index (RSI), but it seems to be trying to hold above this level. During the decline, we see that a sell signal was formed on the Ichimoku indicator as the tenkan level cut the kijun downwards. Loss of the 1.34 level may bring declines to 1.28 kumo cloud support with the sell signal. The loss of this level may cause the decline to deepen. If it closes above 1.34, it can be said that the price may make an attack towards the tenkan and kijun levels again.
Supports 1.3486 – 1.2382 – 1.0710
Resistances 1.4753 – 1.5643 – 1.7043
SOL/USDT
Crypto assets recorded their highest weekly inflows of all time. Bitcoin and Solana were the best-performing crypto assets, with crypto assets reaching a record weekly inflow of $3.13 billion.
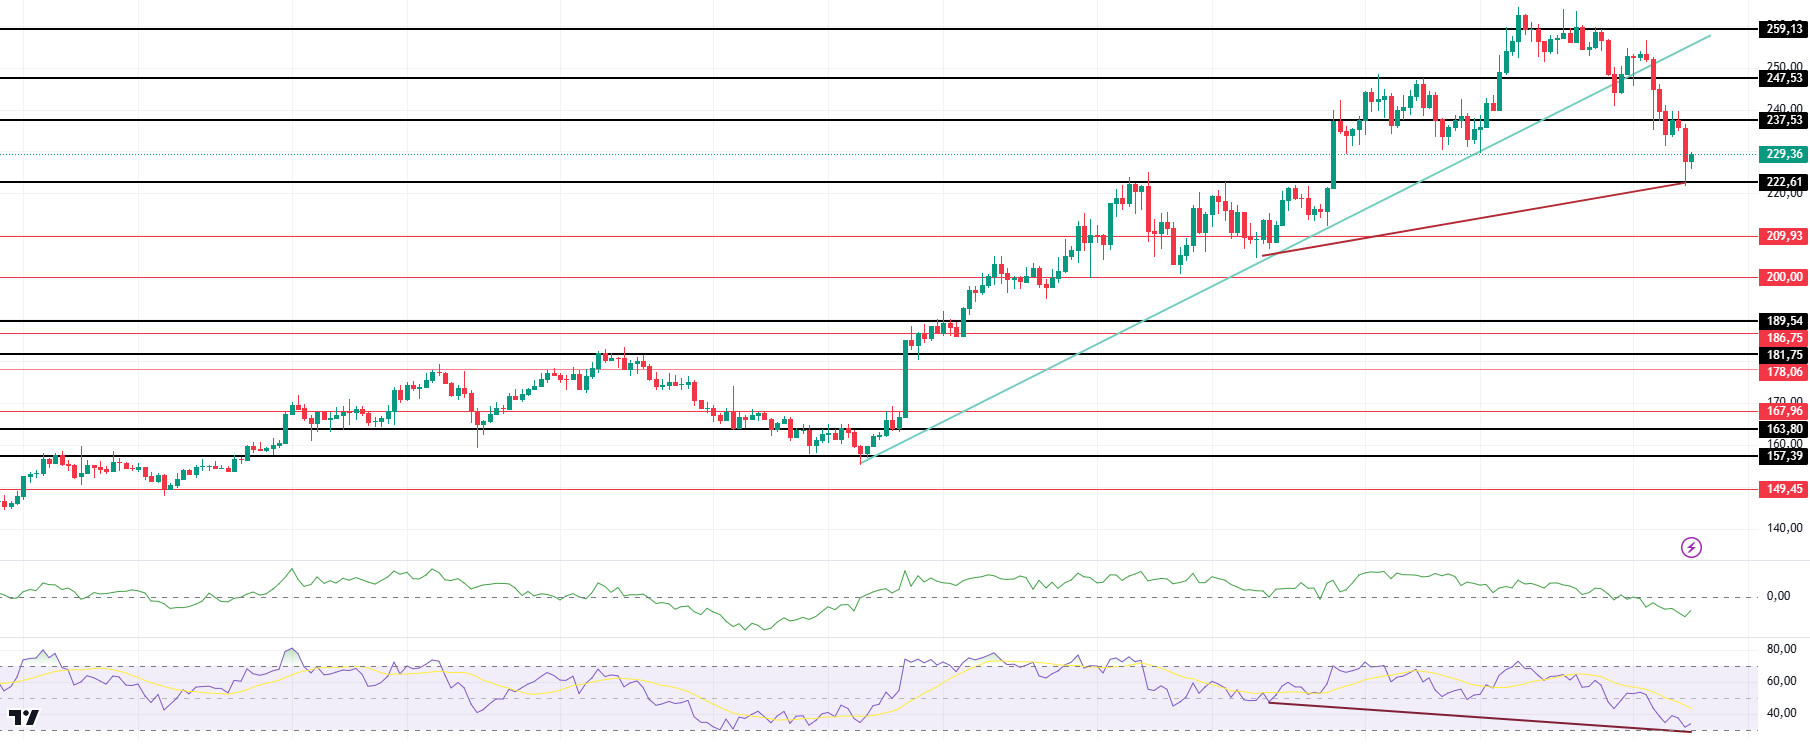
Solana (SOL) price continued to depreciate after buying weakened. It is priced at $228.90, down 8.10% in the last 24 hours. On the 4-hour timeframe, the 50 EMA (Blue Line) is above the 200 EMA (Black Line). Since November 4, SOL, which has been in an uptrend since November 4, has broken this trend to the downside. However, when we examine the Chaikin Money Flow (CMF)20 indicator, money inflows have turned negative after a long time, but there is a decline in inflows. At the same time, Relative Strength Index (RSI)14 is in the overbought zone. There is also a mismatch. This can be shown as a bullish signal. The 259.13 level is a very strong resistance point in the uptrend driven by both macroeconomic conditions and innovations in the Solana ecosystem. If it breaks here, the rise may continue. In case of retracements due to possible macroeconomic reasons or profit sales, support levels 222.61 and 189.54 may be triggered again. If the price reaches these support levels, a potential bullish opportunity may arise if momentum increases.
Supports 222.61 – 209.93 – 200.00
Resistances 237.53 – 247.53 – 259.13
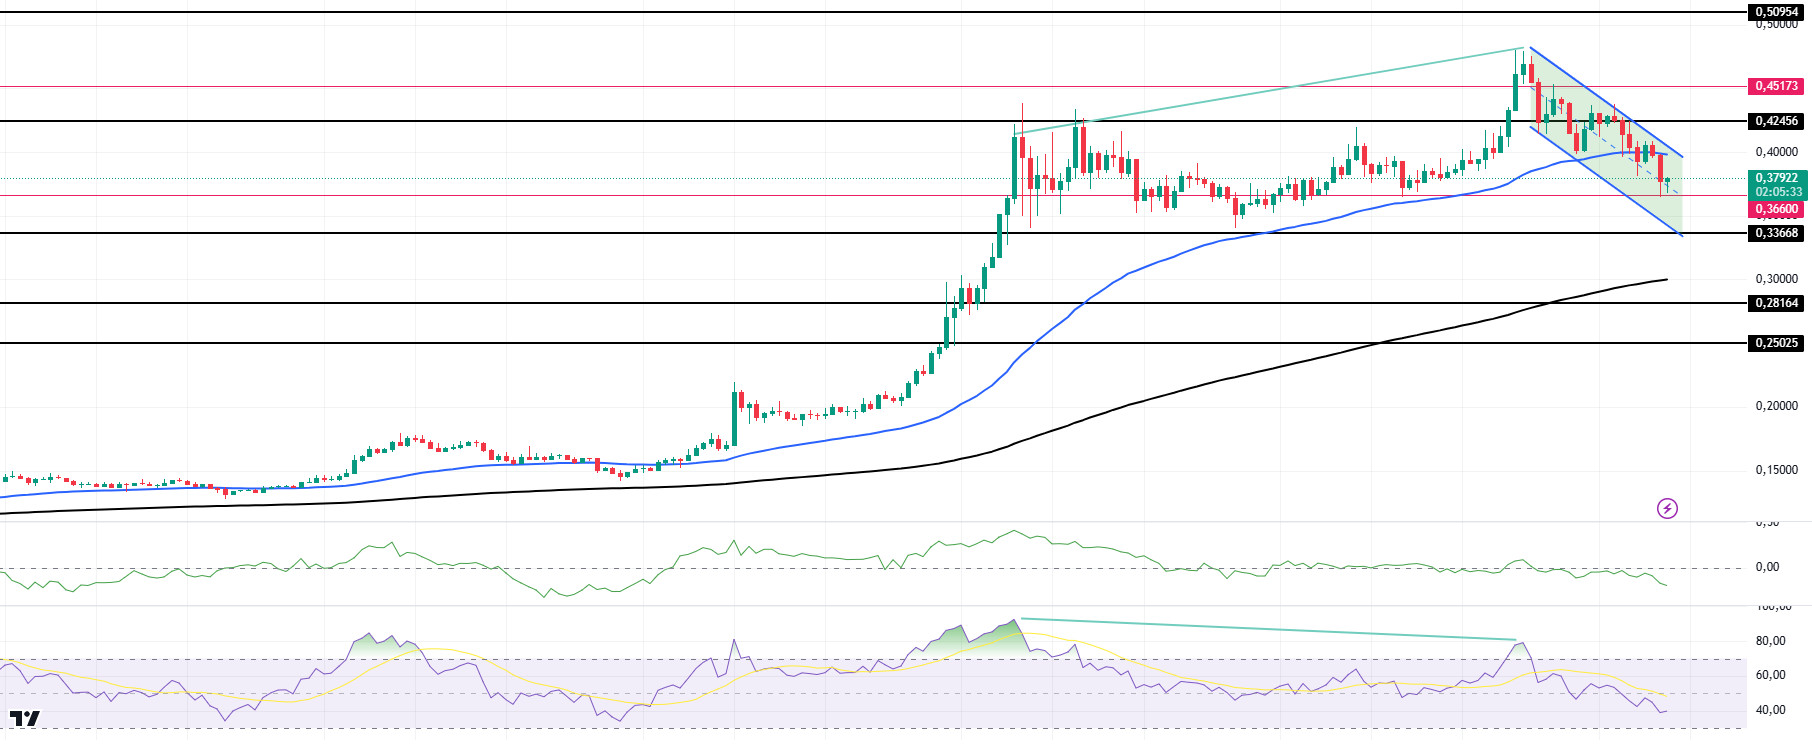
DOGE/USDT
Elon Musk’s latest Dogecoin-themed post has raised questions about potential market manipulation after a brief fluctuation in the coin’s value following his post. Elon Musk’s recent posts on Dogecoin (DOGE) have raised questions about whether he intentionally influenced the coin’s value. His latest tweet, which included a meme referring to the Department of Government Efficiency (D.O.G.E.), caused a short-term spike in the price of DOGE. Although Musk’s post was about a political project, not a cryptocurrency, it did not seem very convincing to the crypto community due to Musk’s previous manipulative posts.
Keeping pace with the general decline of the market, DOGE has fallen 9.64% in the last 24 hours, priced at $0.3783. Technically, there is a mismatch between the Relative Strength Index (RSI) 14 and the chart. If this mismatch works, retracements may deepen. In the 4-hour timeframe, the 50 EMA (Blue Line) is above the 200 EMA (Black Line). But the gap between the two averages is still too wide. This may cause pullbacks. The price may break the 50 EMA and use the moving average as resistance. On the other hand, looking at some indicators, RSI 14 has moved from the overbought zone to the sell level. However, the Chaikin Money Flow (CMF)20 indicator has also turned negative. This shows us that there are money outflows, indicating that the pullbacks may deepen. The 0.50954 level appears to be a very strong resistance place in the rises due to both macroeconomic conditions and innovations in Doge coin. If DOGE maintains its momentum and rises above this level, the rise may continue strongly. In case of retracements due to possible macroeconomic reasons or profit sales, the support levels of 0.36600 and 0.33668 can be triggered again. If the price hits these support levels, a potential bullish opportunity may arise if momentum increases.
Supports 0.36600 – 0.33668 – 0.28164
Resistances 0.42456 – 0.45173 – 0.50954
LEGAL NOTICE
The investment information, comments and recommendations contained herein do not constitute investment advice. Investment advisory services are provided individually by authorized institutions taking into account the risk and return preferences of individuals. The comments and recommendations contained herein are of a general nature. These recommendations may not be suitable for your financial situation and risk and return preferences. Therefore, making an investment decision based solely on the information contained herein may not produce results in line with your expectations.


