MARKET SUMMARY
Latest Situation in Crypto Assets
| Assets | Last Price | 24h Change | Dominance | Market Cap. |
|---|---|---|---|---|
| BTC | 97,032.36 | 1.68% | 56.91% | 1,92 T |
| ETH | 3,601.31 | 0.14% | 12.85% | 433,88 B |
| SOLANA | 243.22 | 3.08% | 3.42% | 115,50 B |
| XRP | 1.689 | 15.79% | 2.88% | 96,67 B |
| DOGE | 0.4150 | 3.61% | 1.81% | 61,00 B |
| CARDANO | 1.0603 | 5.58% | 1.10% | 37,21 B |
| AVAX | 43.71 | 3.33% | 0.53% | 17,88 B |
| TRX | 0.2040 | 1.49% | 0.52% | 17,61 B |
| SHIB | 0.00002591 | 2.54% | 0.45% | 15,25 B |
| DOT | 8.648 | 5.88% | 0.39% | 13,17 B |
| LINK | 18.04 | 0.73% | 0.33% | 11,30 B |
*Prepared on 11.29.2024 at 14:00 (UTC)
WHAT’S LEFT BEHIND
Cryptocurrencies Will Be Available for International Trade in Russia: Putin Signed
The new tax law approved by the Federation Council in Russia, which stipulates that cryptocurrencies are subject to property rights, was officially signed by President Vladimir Putin. This regulation paved the way for the use of cryptocurrencies in international trade and payments.
Ki Young Ju: Bitcoin Dominance Will Not Decline
Ki Young Ju, CEO of CryptoQuant, stated that the rise in Bitcoin’s dominance has frustrated expectations in the altcoin market. While investors expect altcoins to rise, according to Young Ju, Bitcoin dominance will continue to rise strongly.
Is Hype Meme Coin Shifting to DeFi?
In 2024, while meme coins are gaining traction in the market, decentralized finance (DeFi) tokens have seen remarkable growth recently. According to the latest data released by GMCI, the upward momentum in meme coins has weakened, while DeFi tokens continue to rise strongly.
HIGHLIGHTS OF THE DAY
Important Economic Calender Data
| Time | News | Expectation | Previous |
|---|---|---|---|
| Half-Day | Holiday United States – Thanksgiving Day – Early close at 13:00 |
INFORMATION
*The calendar is based on UTC (Coordinated Universal Time) time zone. The economic calendar content on the relevant page is obtained from reliable news and data providers. The news in the economic calendar content, the date and time of the announcement of the news, possible changes in the previous, expectations and announced figures are made by the data provider institutions. Darkex cannot be held responsible for possible changes that may arise from similar situations.
MARKET COMPASS
Markets in the US, which were closed yesterday for the Thanksgiving holiday, will have a short half-day session today. In Europe, a number of macro indicators, including inflation data, were monitored and stock markets on the continent are flat to mixed. Wall Street is expected to start the new day on a slightly positive note. On the digital assets side, we have seen some recovery after a short period of consolidation. We think this mood can be maintained as we enter the new month. It is worth noting that volatility in the market may increase from time to time due to the weakness in volume and expiring derivatives today.
From the short term to the big picture.
The victory of former President Trump on November 5, which was one of the main pillars of our bullish expectation for the long-term outlook in digital assets, produced a result in line with our forecasts. In the aftermath, the president-elect’s appointments to Congress and the increased regulatory expectations for the crypto ecosystem in the US remained in our equation as a positive variable. Although Powell gave cautious messages in his last speech, the fact that the FED continued its interest rate cut cycle and the volume in BTC ETFs indicates an increase in institutional investor interest (in addition, MicroStrategy’s BTC purchases, Microsoft’s start to evaluate the purchase issue, BlackRock’s BTC ETF options start trading …), supports our upward forecast for the big picture for now.
In the short term, given the nature of the market and pricing behavior, we think it would not be surprising to see occasional respite or pullbacks in digital assets. However, at this point, it would be useful to underline again that the fundamental dynamics continue to be bullish.
TECHNICAL ANALYSIS
BTC/USDT
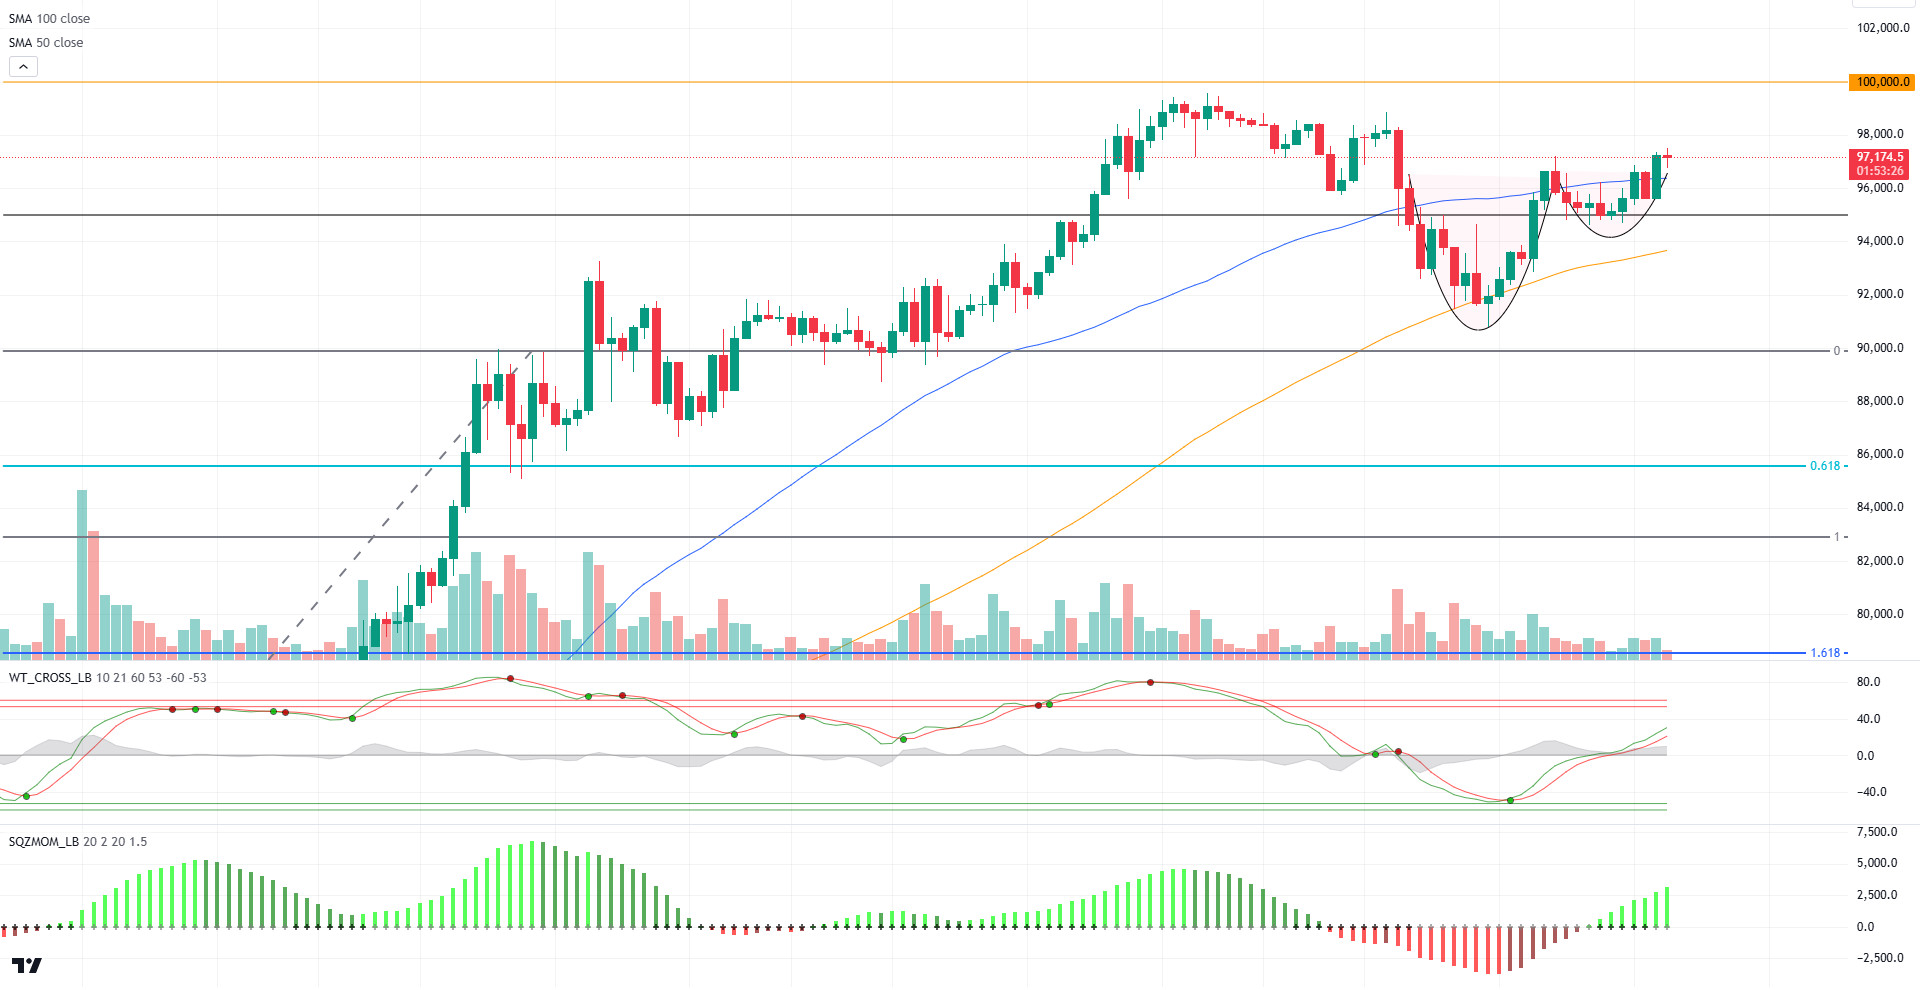
With institutional investors entering the market, a significant shift in Bitcoin investor behavior is being observed. Contrary to previous cycles, despite the sell signal of technical indicators on broader charts at its peaks, it is exhibiting a strong stance in its price, contrary to market sentiment, which reveals that Bitcoin has started to be used as a store of value.
As a matter of fact, when we look at the technical outlook, it is only 2.60% away from the ATH level of 99.655. Coming above the 50-day SMA line, BTC is currently trading at 97,000. On the hourly charts, our technical oscillator continues to signal buying, while our momentum indicator is gaining strength by moving back into positive territory. The minor resistance level that we will encounter in the continuation of the rise seems to be the 98,000 point. In a possible pullback, we will follow the 95,000 support point again.
Supports 95,000 – 92,500 – 90,000
Resistances 99,655 – 100,000 – 105,000
ETH/USDT
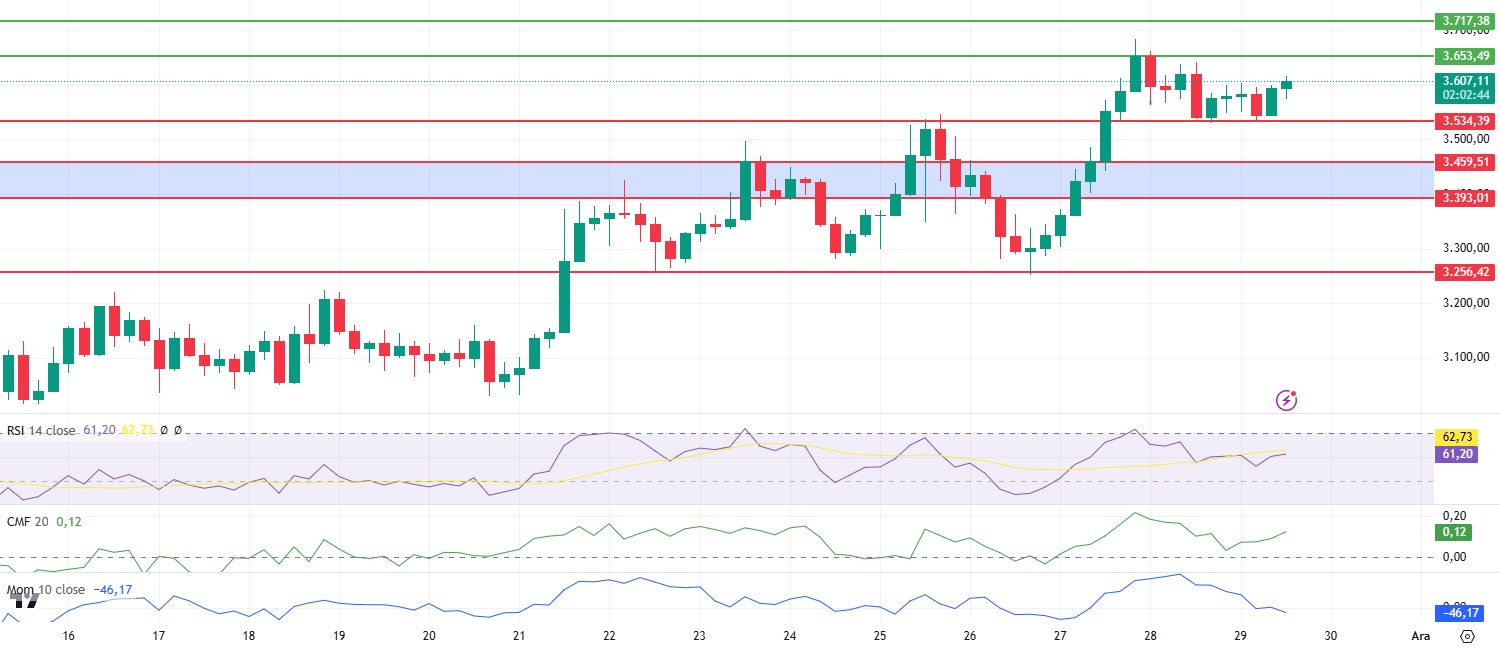
ETH, which tested the 3,534 level once again in the morning hours, managed to gain the 3,600 level with the reaction from this region. During this move, rises up to the 3,653 region can be expected in the evening hours due to both the double bottom at 3,534 and the upward movement of Chaikin Money Flow (CMF) with support from the zero line. Looking at the Cumulative Volume Delta (CVD), it is seen that the acceleration of spot purchases supports the positive scenario. Relative Strength Index (RSI) continues to move horizontally and momentum continues to weaken. In this context, it can be said that in a possible test of the 3,534 level, the price may not be able to react and may experience deeper declines. It can be said that the area marked in blue on the chart continues to be a strong support zone.
Supports 3,534 – 3,459 – 3,256
Resistances 3,653- 3,717 – 3,839
XRP/USDT
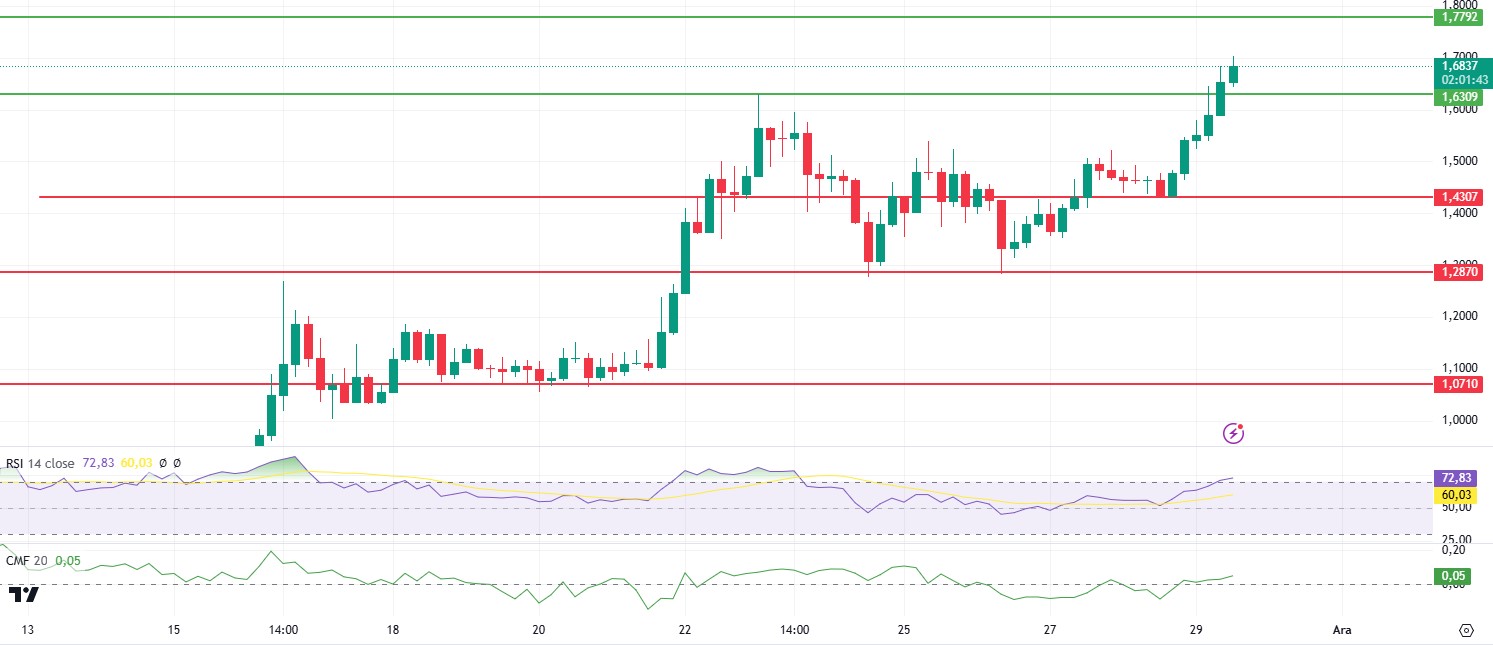
XRP continues its uptrend, breaking through the 1.63 resistance in the morning. The break of 1.63, an important resistance point, and the formation of candles with momentum and high volume suggest that the trend may continue strong upwards. While the positive outlook on Chaikin Money Flow (CMF) continues, we see that the Relative Strength Index (RSI) has entered the overbought zone. In summary, it can be said that the rise may continue provided that the 1.63 level is not violated for XRP. The 1.77 level remains the most important resistance. Loss of 1.63 level may bring sharp declines.
Supports 1.6309- 1.4307 – 1.2870
Resistances 1.7792 – 1.9101 – 1.9890
SOL/USDT
More than 8.6k Solana wallets linked to the $21 million DEXX hack Security experts at SlowMist have identified more than 8,620 Solana wallets linked to the attack. Losses are estimated to be close to $30 million as recovery efforts continue. Meanwhile, Solana’s open positions in the derivatives market fell to $3.34 billion, indicating a decline in investor confidence.
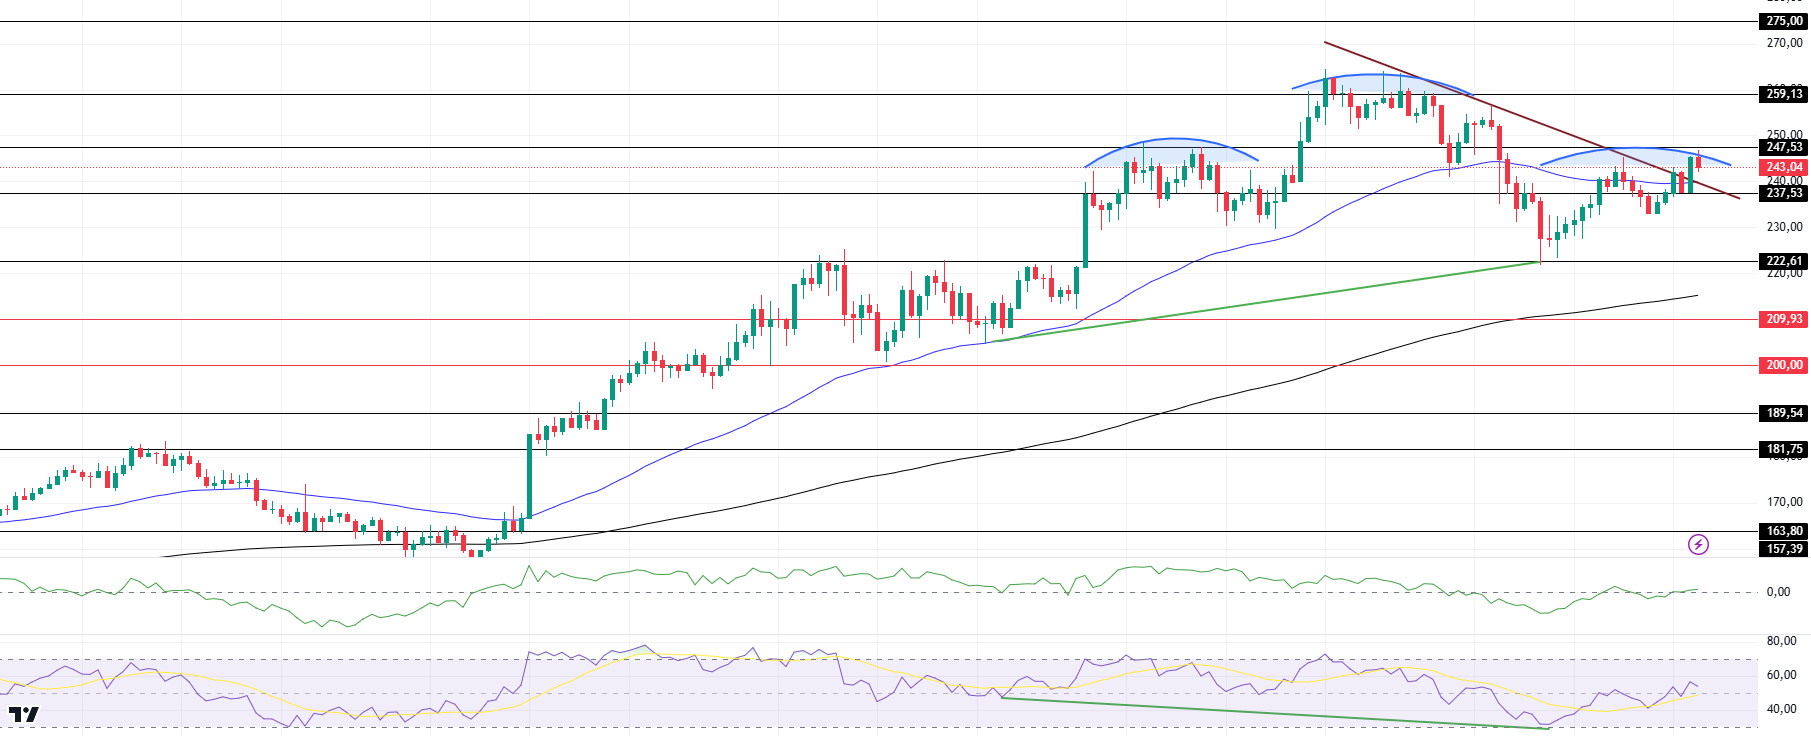
On the 4-hour timeframe, the 50 EMA (Blue Line) is above the 200 EMA (Black Line). Since November 22, SOL, which has been in a downtrend since November 22, broke the downtrend and moved upwards. However, when we examine the Chaikin Money Flow (CMF)20 indicator, money inflows maintain their balance. At the same time, Relative Strength Index (RSI)14 is moving from the overbought zone to the neutral level. At the same time, there is a mismatch pattern called bullish divergence. This can be shown as a bullish signal. Another potential shoulder-head-shoulder pattern on the chart draws attention. If this pattern works, there may be a decline to 189.54. The 259.13 level is a very strong resistance point in the uptrend driven by both macroeconomic conditions and innovations in the Solana ecosystem. If it breaks here, the rise may continue. In case of retracements due to possible macroeconomic reasons or profit sales, support levels 222.61 and 189.54 may be triggered again. If the price reaches these support levels, a potential bullish opportunity may arise if momentum increases.
Supports 237.53 – 222.61 – 209.93
Resistances 247.53 – 259.13 – 275.00
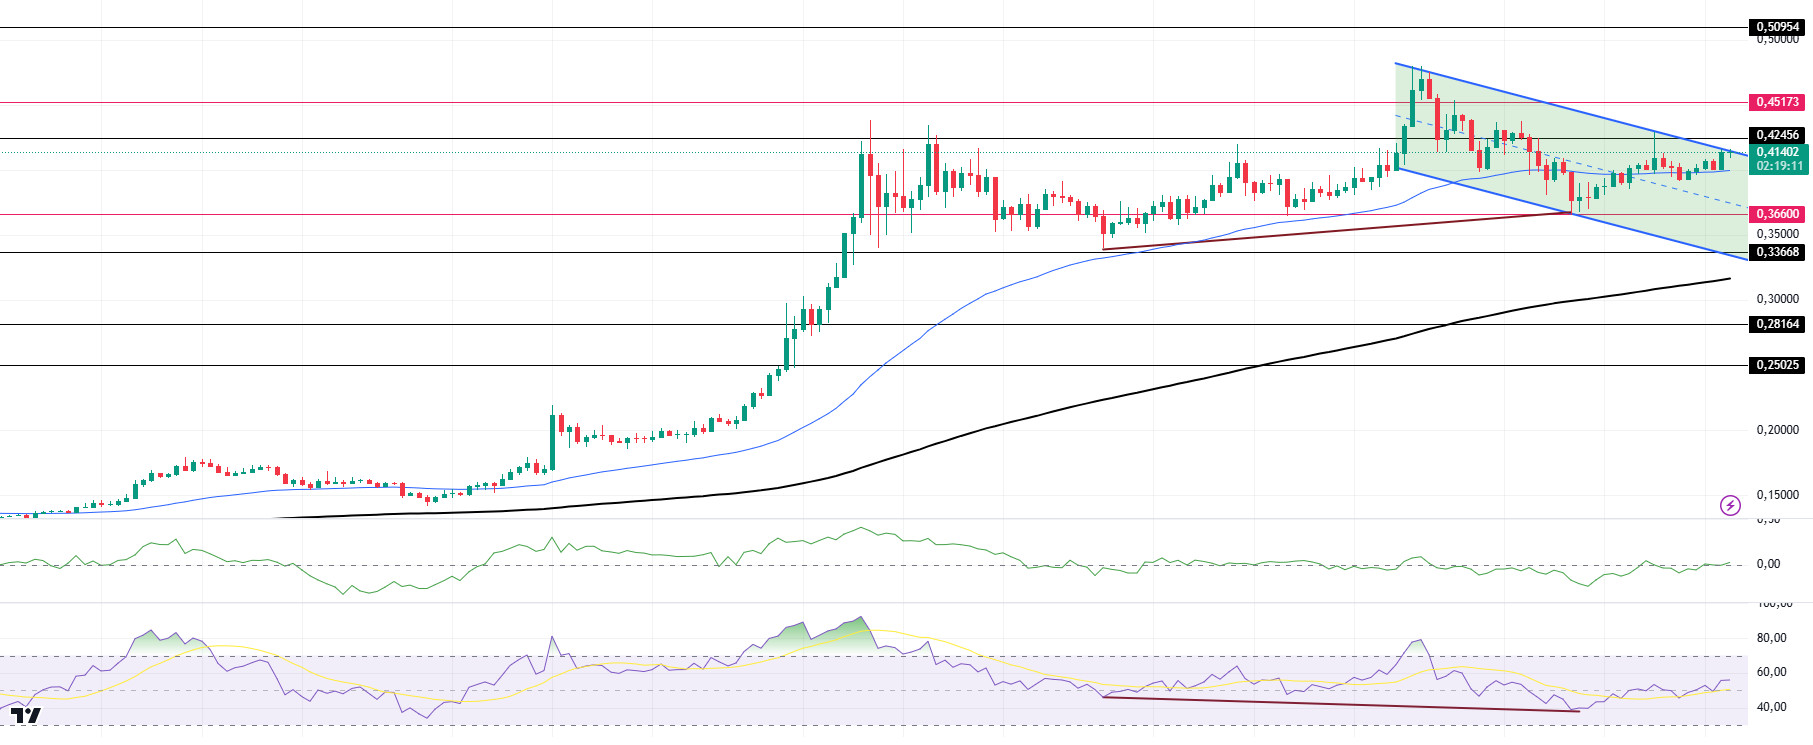
DOGE/USDT
Blockchain data tracker Whale Alert reported three large transactions totaling DOGE 1.1 billion in a single hour. The transfers included two transactions of DOGE 300 million each and a third transaction of DOGE 500 million. The total value of these transactions could be alarming at over $445 million based on Dogecoin’s current market capitalization.
Looking at the chart, the asset, which has been in a downtrend since November 22, is once again testing the trend ceiling. When we look at the indicators, there is an upward mismatch between the Relative Strength Index (RSI) 14 and the chart. If the upside acceleration is strong, the 0.50954 level may be triggered. On the 4-hour timeframe, the 50 EMA (Blue Line) is above the 200 EMA (Black Line). But the gap between the two averages is still too wide. This may cause pullbacks. On the other hand, when we look at the RSI 14 indicator, it has moved from the overbought zone to the neutral level. However, when we examine the Chaikin Money Flow (CMF)20 indicator, it remains neutral. This shows us that money inflows and outflows are in balance. The 0.50954 level appears to be a very strong resistance point in the rises driven by both macroeconomic conditions and innovations in the Doge coin. If DOGE maintains its momentum and rises above this level, the rise may continue strongly. In case of retracements due to possible macroeconomic reasons or profit sales, the support levels of 0.36600 and 0.33668 can be triggered again. If the price hits these support levels, a potential bullish opportunity may arise if momentum increases.
Supports 0.36600 – 0.33668 – 0.28164
Resistances 0.42456 – 0.45173 – 0.50954
LEGAL NOTICE
The investment information, comments and recommendations contained herein do not constitute investment advice. Investment advisory services are provided individually by authorized institutions taking into account the risk and return preferences of individuals. The comments and recommendations contained herein are of a general nature. These recommendations may not be suitable for your financial situation and risk and return preferences. Therefore, making an investment decision based solely on the information contained herein may not produce results in line with your expectations.