
MARKET SUMMARY
Latest Situation in Crypto Assets
| Assets | Last Price | 24h Change | Dominance | Market Cap |
|---|---|---|---|---|
| BTC | $68,838.72 | 0.05% | 59.32% | $1.36 T |
| ETH | $2,442.42 | -0.88% | 12.82% | $293.87 B |
| SOLANA | $163.64 | -0.07% | 3.41% | $77.06 B |
| XRP | $0.5068 | -0.84% | 1.28% | $28.84 B |
| DOGE | $0.1709 | 9.36% | 1.09% | $25.11 B |
| TRX | $0.1613 | -2.06% | 0.62% | $13.95 B |
| CARDANO | $0.3322 | 0.61% | 0.51% | $11.63 B |
| SHIB | $0.00001795 | 5.52% | 0.46% | $10.58 B |
| AVAX | $23.41 | -0.45% | 0.42% | $9.54 B |
| LINK | $10.63 | 0.66% | 0.29% | $6.66 B |
| DOT | $3.851 | 1.63% | 0.25% | $5.83 B |
*Prepared on 11.5.2024 at 13:30 (UTC)
WHAT’S LEFT BEHIND
A First in the UK
British pension specialist Cartwright led and brokered the first time a pension fund in the country has invested in Bitcoin. Instead of using an intermediary such as spot Bitcoin ETFs, the unnamed fund invested 3% of its total assets directly in BTC.
Spot Bitcoin Exchange Traded Funds in the US
Spot Bitcoin exchange traded funds (ETFs) in the US recorded a significant net outflow of $541 million on Monday, the largest daily negative flow since May 1.
HIGHLIGHTS OF THE DAY
Important Economic Calender Data
| Time | News | Expectation | Previous |
|---|---|---|---|
| 15:00 | USISM Non-Manufacturing PMI (Oct) | 53.8 | 54.9 |
| U.S. Presidential Election | |||
| U.S. Congressional Elections | |||
INFORMATION
*The calendar is based on UTC (Coordinated Universal Time) time zone.
The economic calendar content on the relevant page is obtained from reliable news and data providers. The news in the economic calendar content, the date and time of the announcement of the news, possible changes in the previous, expectations and announced figures are made by the data provider institutions. Darkex cannot be held responsible for possible changes that may arise from similar situations.
MARKET COMPASS
Global markets held their breath and focused on who will win the US presidential election. Investors are in “wait and see” mode and there are no major changes in asset prices for now. The short-term direction will be determined by who will be the next president of the US, and this is also very important for cryptocurrencies.
Click here to review our November strategy report in which we discussed the US presidential election in detail.
Short term and big picture
It becomes even more difficult to determine the direction ahead of developments that markets are so focused on. Surprise events or developments that may produce results contrary to expectations can upset all predictions. Still, some key dynamics and metrics can help with forecasting, and at least it’s better than knowing nothing.
Within the framework of the fundamental variables that we often mention in our analysis, we maintain our expectation that the direction of digital assets is up in the long term. On the other hand, we believe that our forecast for a short-term pullback has been realized to some extent and that there is still room for further downside, despite the rally during the Asian session. Short-term forecasts involve more risk ahead of critical developments. Therefore, there is no doubt that they need to be updated after the outcome of the US presidential election and the FED’s decisions. However, after the possible pressure that the results of these developments may bring in the short term, we anticipate that the rises will manage to take their place again.
TECHNICAL ANALYSIS
BTC/USDT
With the US elections, the global financial system has started its election shift. D. Trump’s messages towards Bitcoin, which was identified with crypto during the election campaign, became the focal point of the market. On this day, when the scenarios and analyzes will come to a conclusion, we may witness a historical turning point in Bitcoin. Regardless of the results of the presidential election, we can expect the optimistic atmosphere in Bitcoin to continue in the long term in both scenarios.
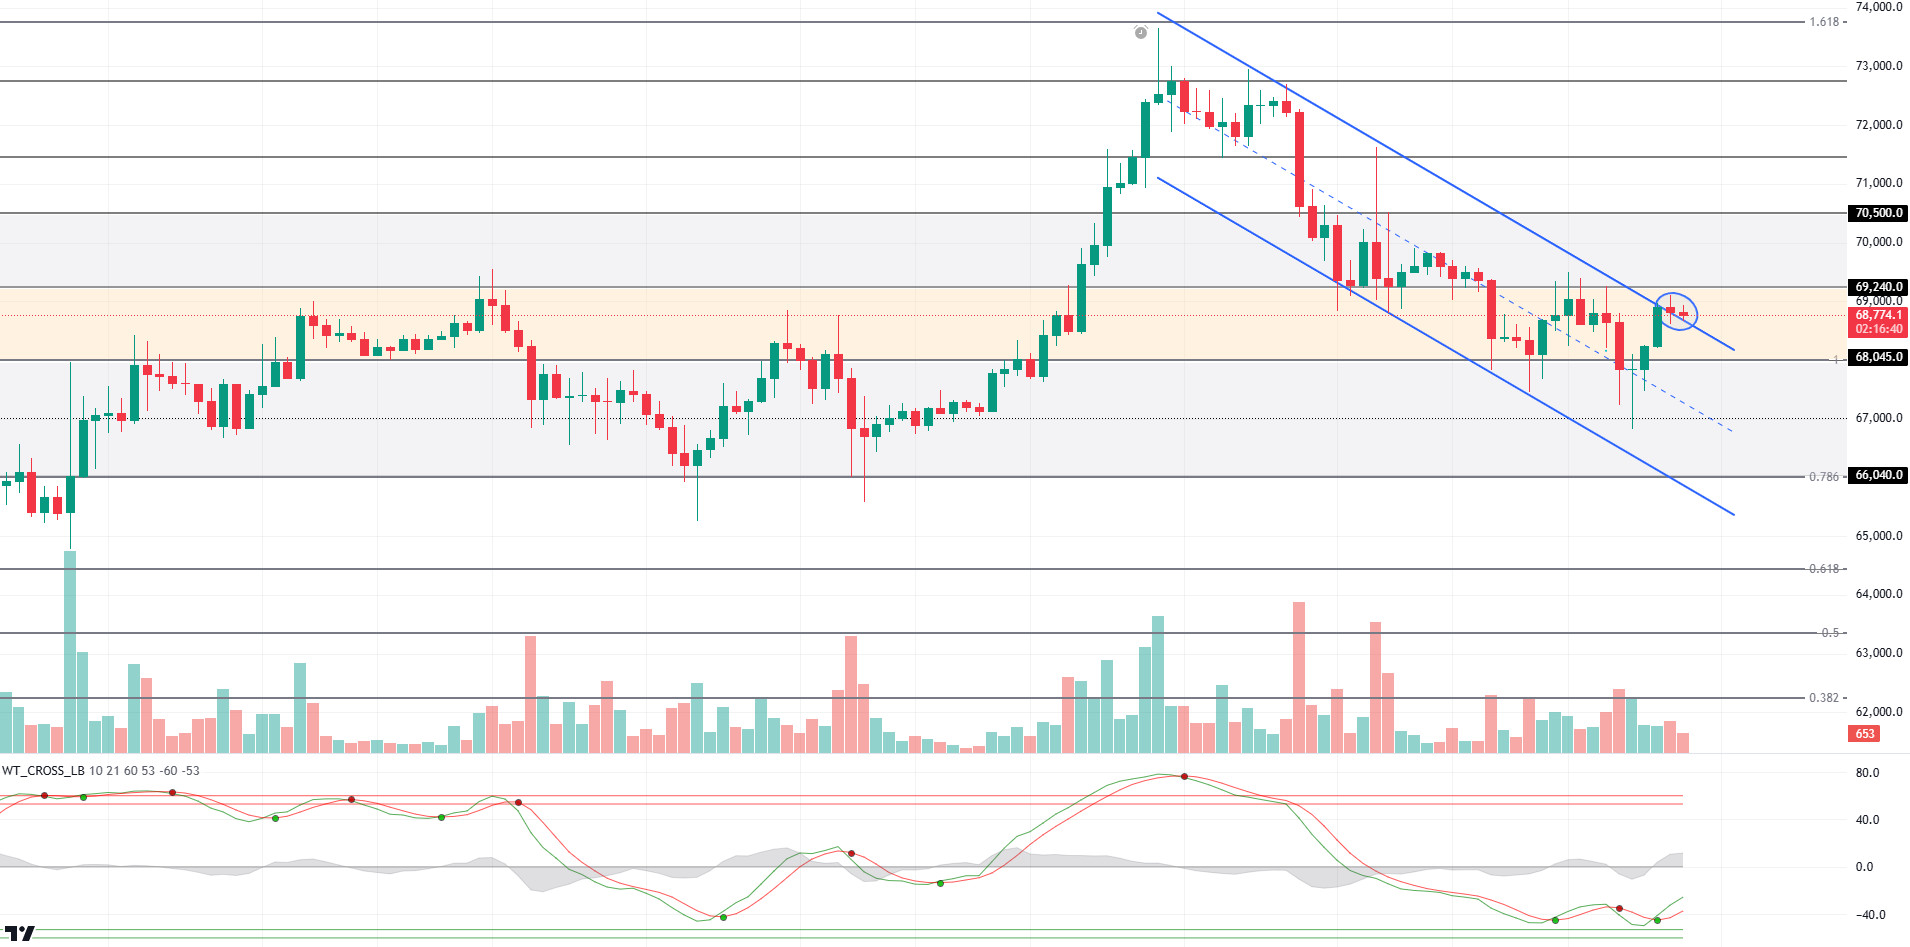
In the short-term technical outlook, the upper line of the falling trend structure continues to act as resistance as of now. Although the positive pricing in global markets has an impact on BTC price, the falling trend structure continues to maintain its appearance. With technical oscillators turning upwards from the oversold zone on hourly charts, the resistance level we will follow in BTC’s upward pricing will be the closures above the 69,240 level. In such a scenario, we can talk about the break of the falling trend structure. Otherwise, Fibonacci 0.786 (66,040) may welcome us as a support level. It should be noted that with the increase in volatility, there may be the possibility of sharper breaks in pricing.
Supports 68,045 -67,260 – 66,040
Resistances 69,240 – 70,500 – 71,460
ETH/USDT
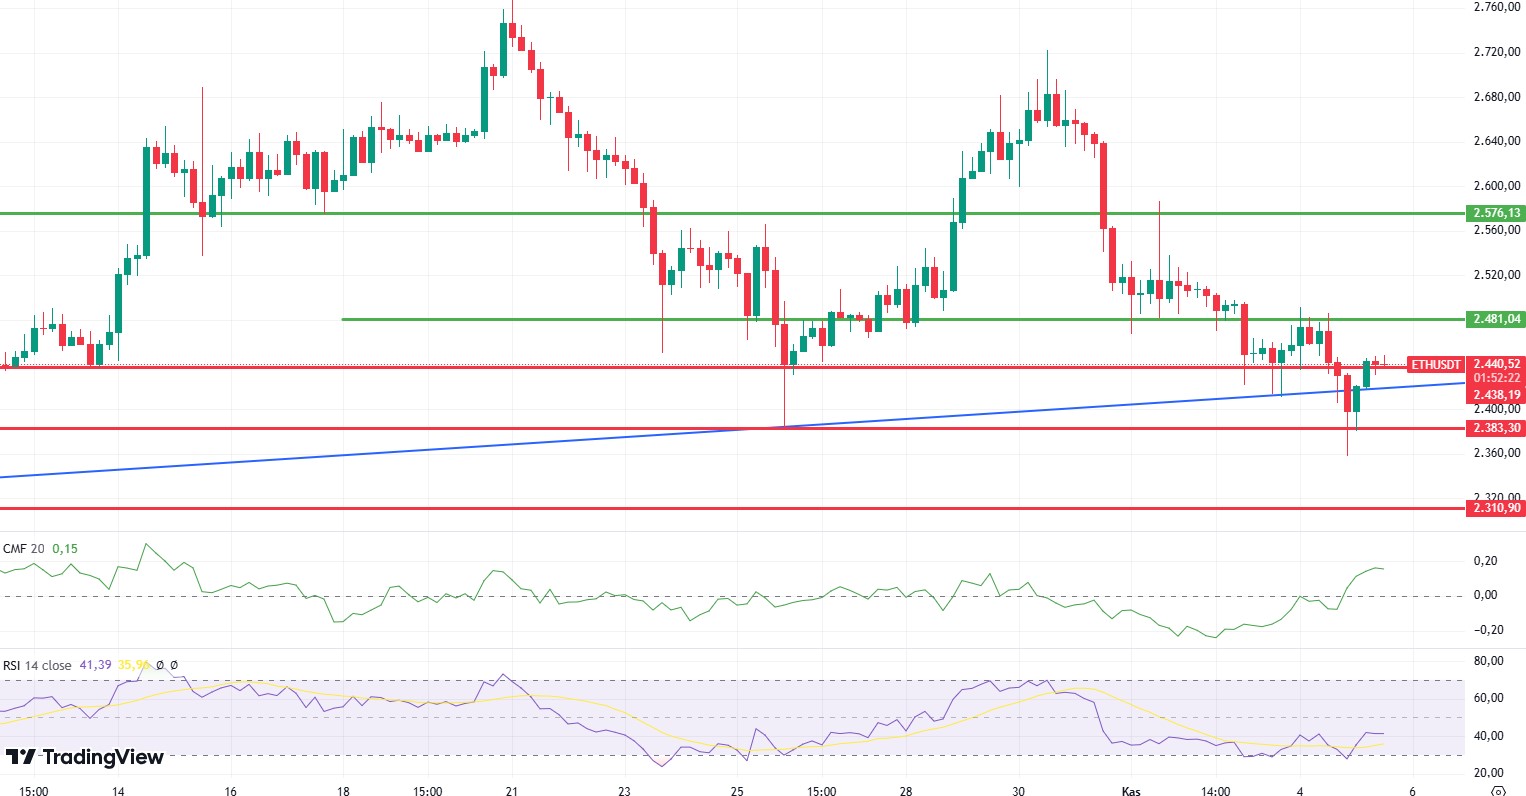
ETH managed to rise above the 2,438 level again with the rise it experienced in the morning hours. However, negative divergences in Chaikin Money Flow (CMF) and Relative Strength Index (RSI) indicate that deep declines may come with a re-break of this level. It can also be said that the breakouts will not mean much due to the high volatility when the vote counting process starts in the US presidential elections. However, exceeding the 2,481 level may cause a very positive outlook. With the break of the 2.383 level, it seems likely that a negative trend will begin. On the other hand, during the period when the momentum moves horizontally, it may be possible for the movements to be sharp regardless of the direction.
Supports 2,438 – 2,310 – 2,112
Resistances 2,481 – 2,576 – 2,669
LINK/USDT
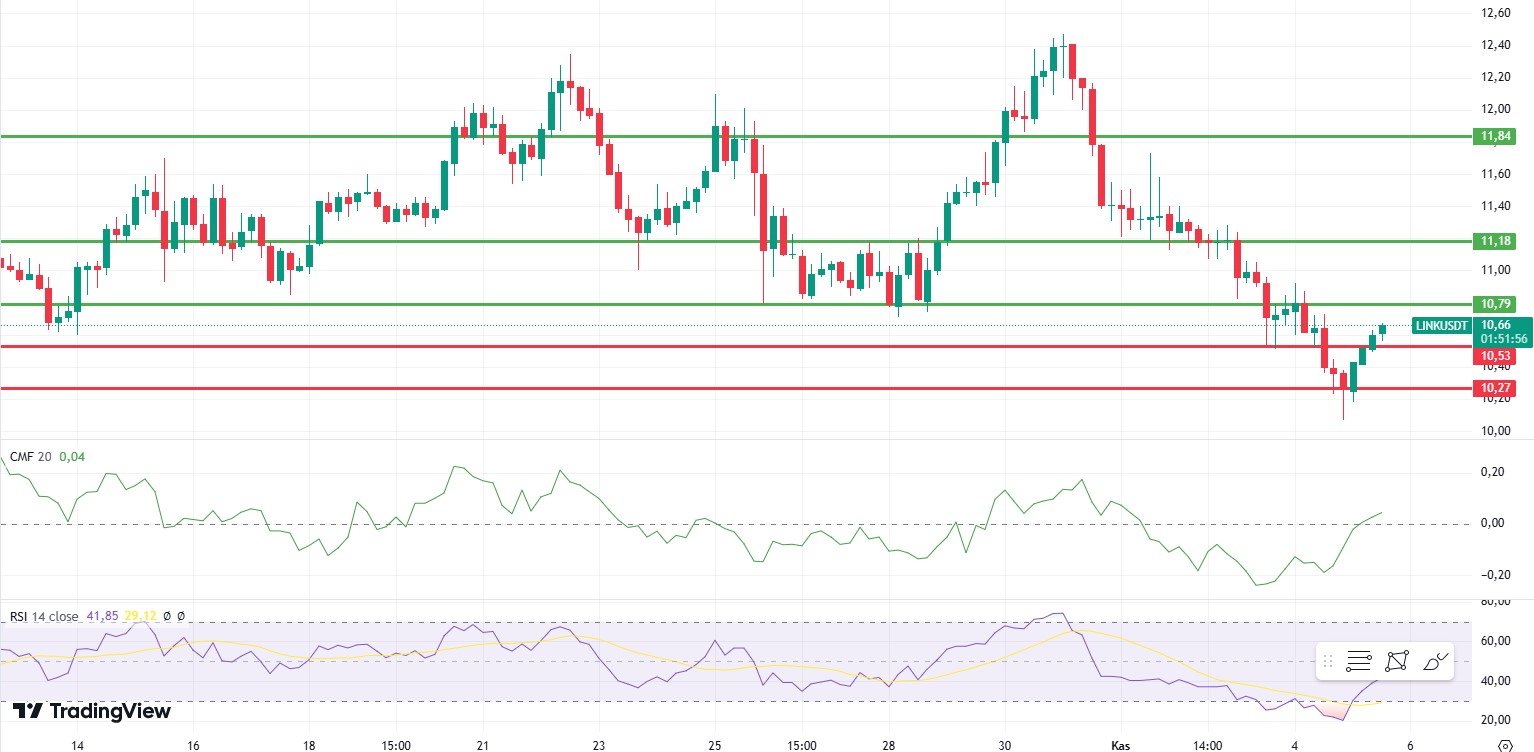
LINK has started an upward movement with the reaction it received at 10.27. The upward movement in momentum and Chaikin Money Flow (CMF) turning positive again seem to be quite positive. At the same time, the regain of the tenkan level is seen as another positive effect. However, both the negative divergence on the Relative Strength Index (RSI) and the negative structure on the Commodity Channel Index (CCI) indicate that the decline may resume if the 10.79 level cannot be exceeded. Gaining the 10.79 level may disrupt the negative scenario and bring rises up to 11.18 levels.
Supports 10.53 – 10.27 – 9.31
Resistances 10.79 – 11.18 – 11.84
SOL/USDT
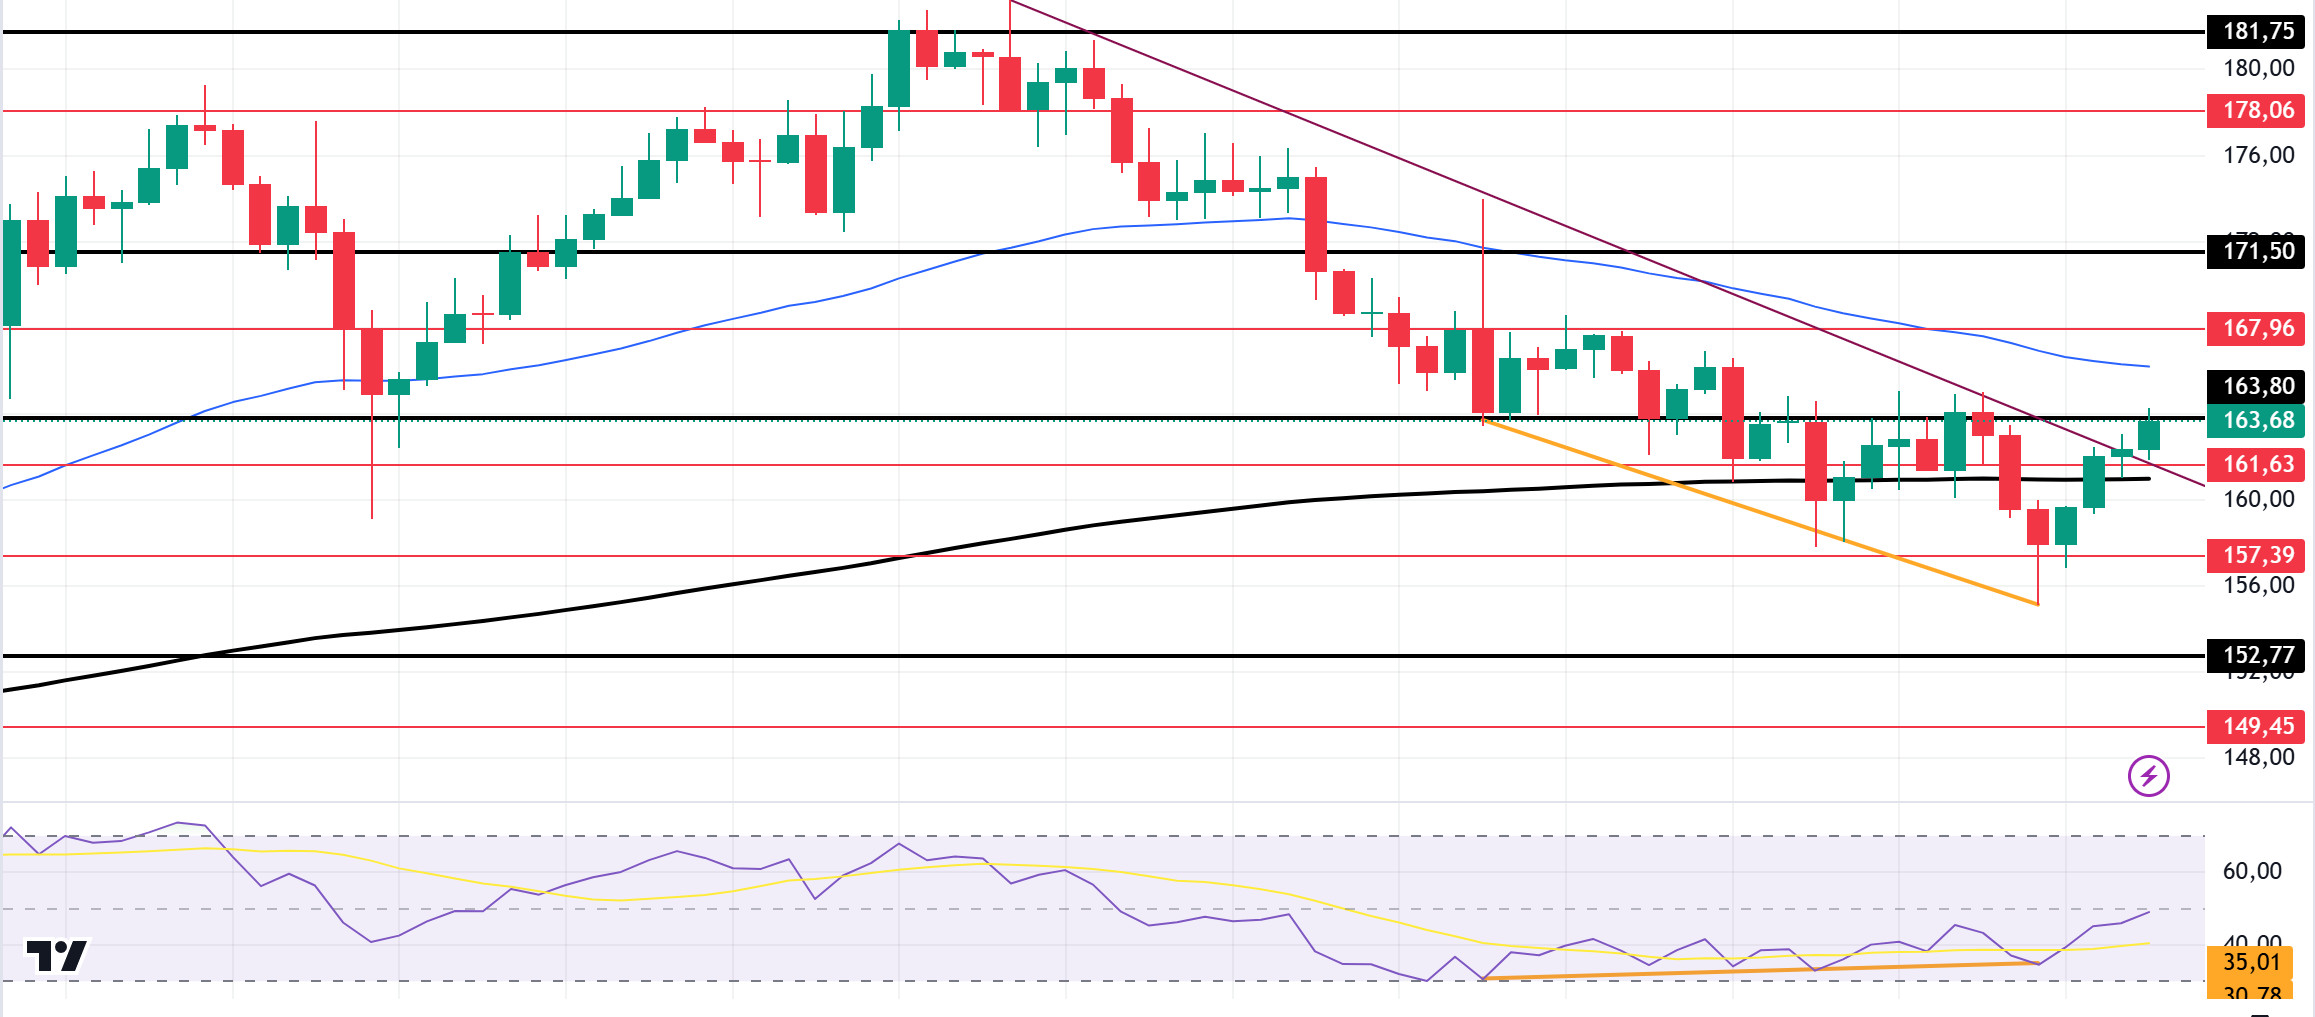
Market dynamics await the US elections. The outcome is expected to increase volatility in the markets. Technically, SOL started pricing above the 200 EMA (Black Line) again, positioning this moving average in the support zone. Testing the 163.80 level once again, SOL has now encountered resistance here. On the 4-hour timeframe, the 50 EMA (Blue Line) continues to be above the 200 EMA (Black Line). This may mean that the rise will continue. Relative Strength Index (RSI)14, which we mentioned in our morning analysis, seems to have worked to decouple with the price. At the same time, the bearish resistance that started on October 29 has been broken. The 171.50 level appears to be a very strong resistance point in the uptrend driven by both macroeconomic conditions and innovations in the Solana ecosystem. If it rises above this level, the rise may continue strongly. In case of possible political reasons or if the bear market increases its dominance, the 152.77 support level may be triggered again. If the price hits this support level, momentum may increase and a potential bullish opportunity may arise.
Supports 161.63 – 157.39 – 152.77
Resistances 163.80 – 167.96 – 171.50
ADA/USDT
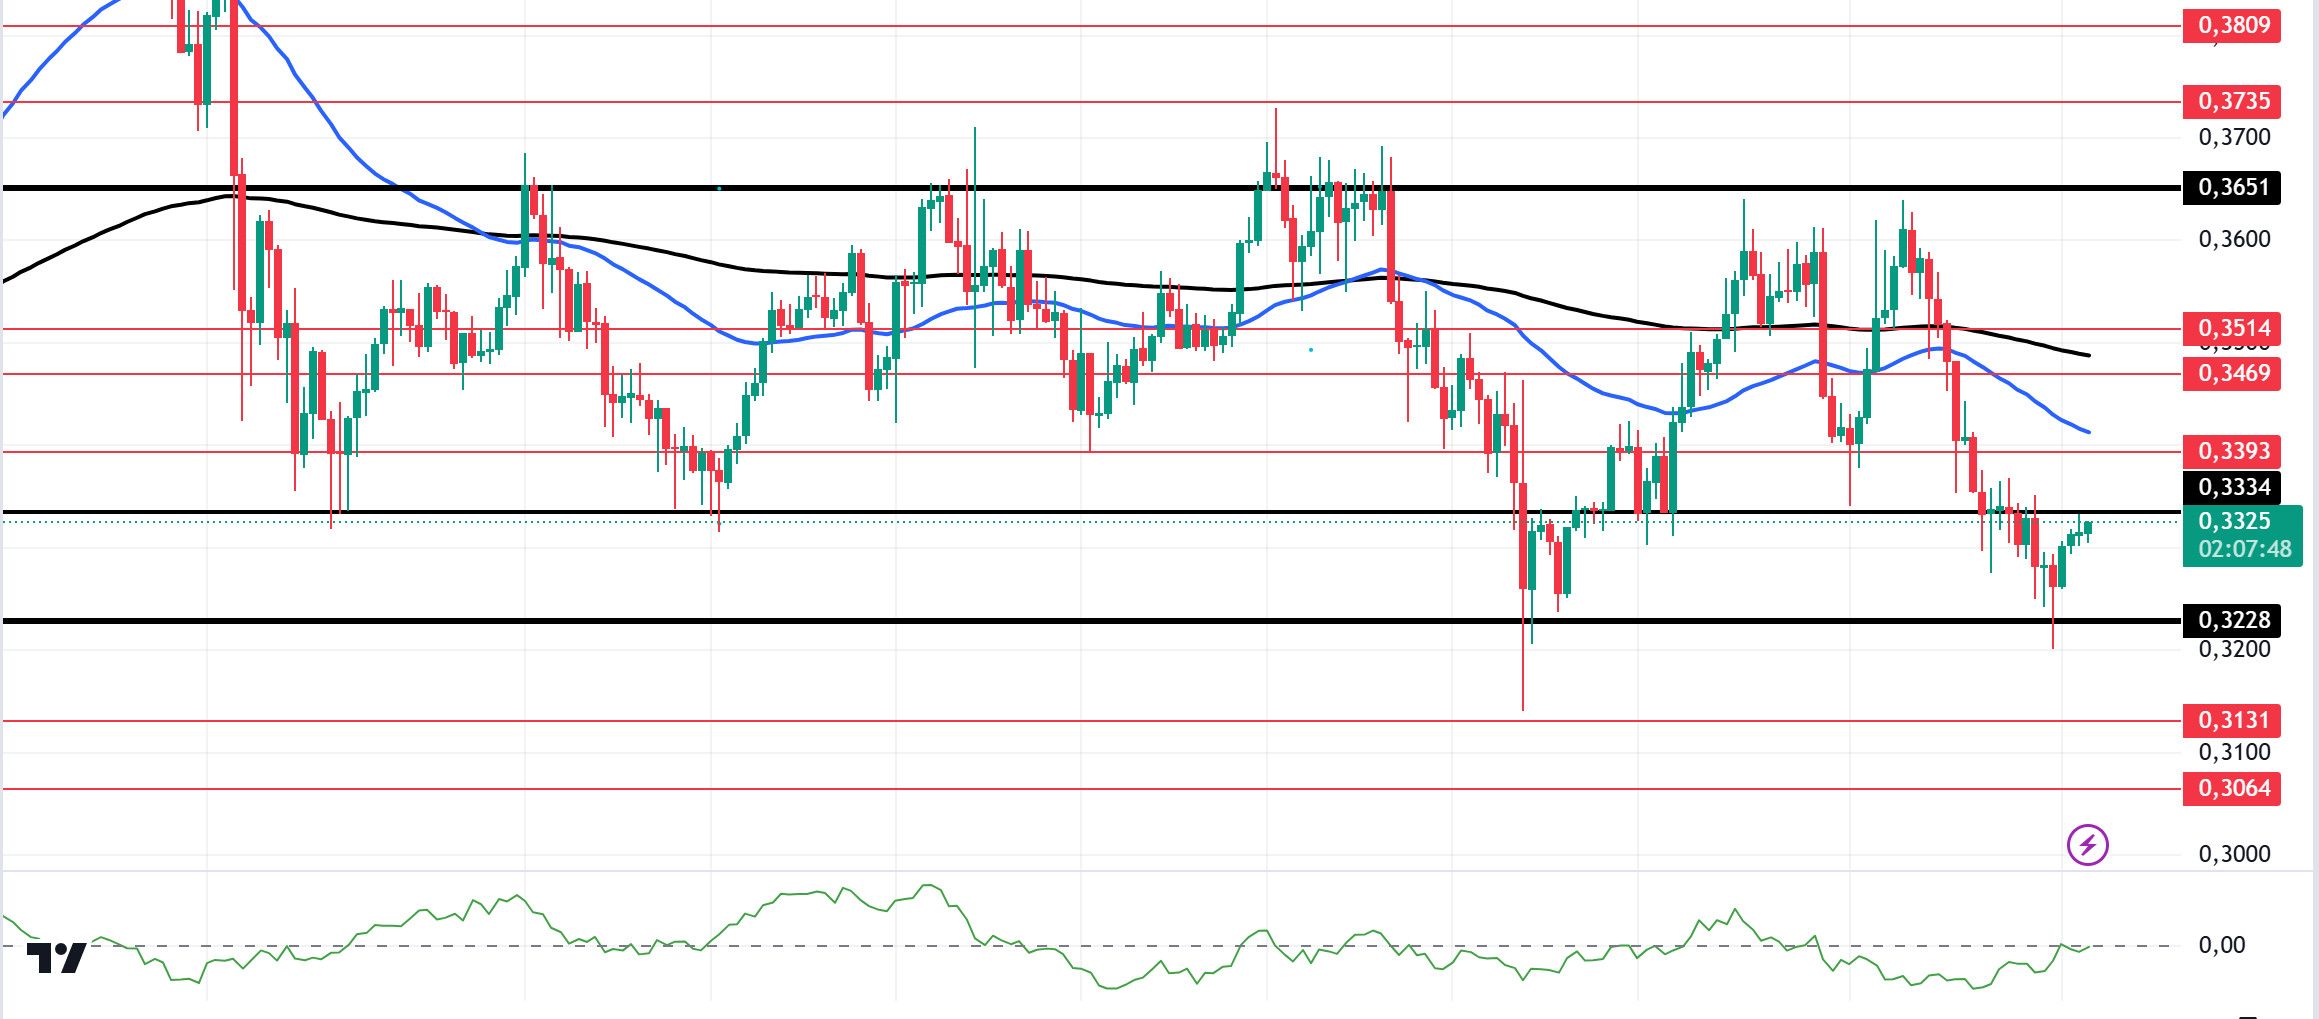
Market dynamics await the US elections. The outcome is expected to increase volatility in the markets. In the Cardano ecosystem, the community is divided over Charles Hoskinson amid allegations of ‘Cardano cancer’. In an informational video shared by Plutus Staking, Hoskinson emphasized his “significant financial commitment to the development of ADA. He invested significant resources early on to fund development contracts. He stated that his total personal investment in Cardano is now $450 million. This investment has been crucial to the growth of the blockchain since its inception.” Technically, ADA, which has been accumulating since October 1, is pricing below the 50 EMA (Blue Line) and 200 EMA (Black Line) on the 4-hour chart. However, the 50 EMA continues to hover below the 200 EMA. This shows that the trend is bearish. At the same time, when we examine the Chaikin Money Flow (CMF)20 indicator, we can say that money inflows have increased slightly, albeit in the neutral zone. Given all this, ADA may test the 0.3228 level once again. In the decline that will be experienced due to the macroeconomic data and negativities in the ecosystem, the support level of 0.3228 should be followed. It may be appropriate to buy when it comes to this price level. In the rises due to macroeconomic data or developments in the ecosystem, if the 0.3334 level is broken in volume, the upward acceleration will increase even more and the 0.3651 level should be followed as a retracement place.
Supports 0.3228 – 0.3131 – 0.3064
Resistances 0.3334 – 0.3393 – 0.3469
AVAX/USDT
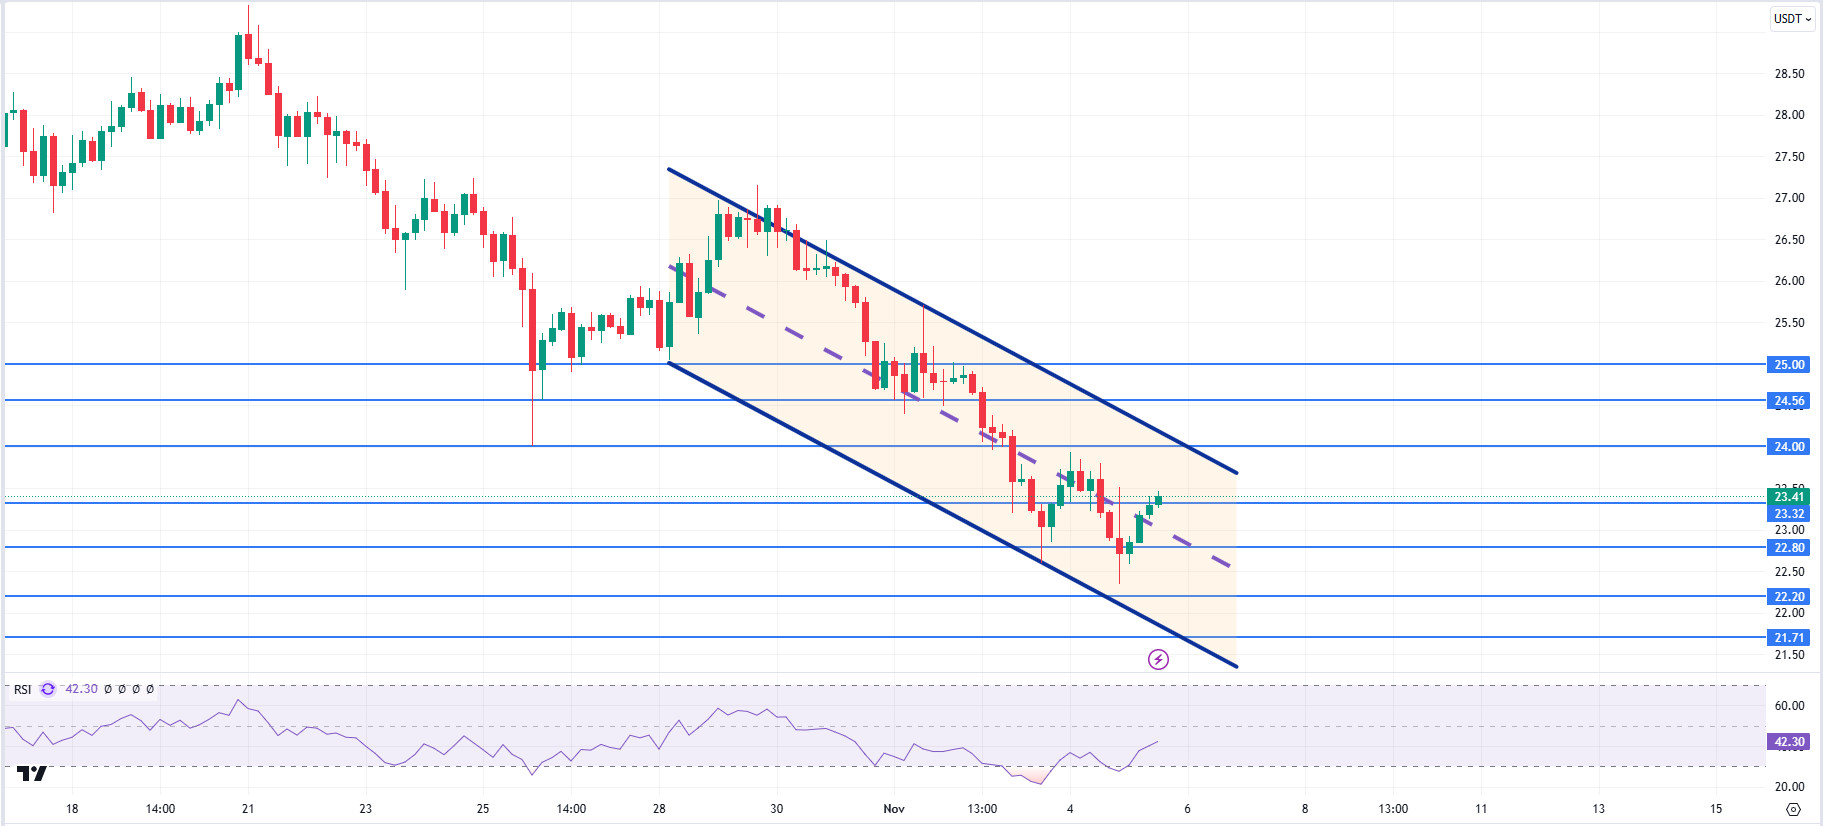
AVAX, which opened today at 22.72, is trading at 23.41, up about 3% during the day. US presidential elections will be held today. Volatility can be expected to be high during and after the election. News flows from the Middle East will be important for the market.
On the 4-hour chart, it moves within the bearish channel. It is in the middle band of the bearish channel and with a Relative Strength Index value of 42, it can be expected to rise slightly from these levels. In such a case, it may test the 24.00 resistance. On the other hand, selling pressure may increase in case of news of increasing tension in the Middle East. In such a case, it may test 22.80 support. As long as it stays above 22.80 support during the day, the desire to rise may continue. With the break of 22.80 support, sales may increase.
Supports 22.80 – 22.20 – 21.71
Resistances 23.32 – 24.00 – 24.56
TRX/USDT
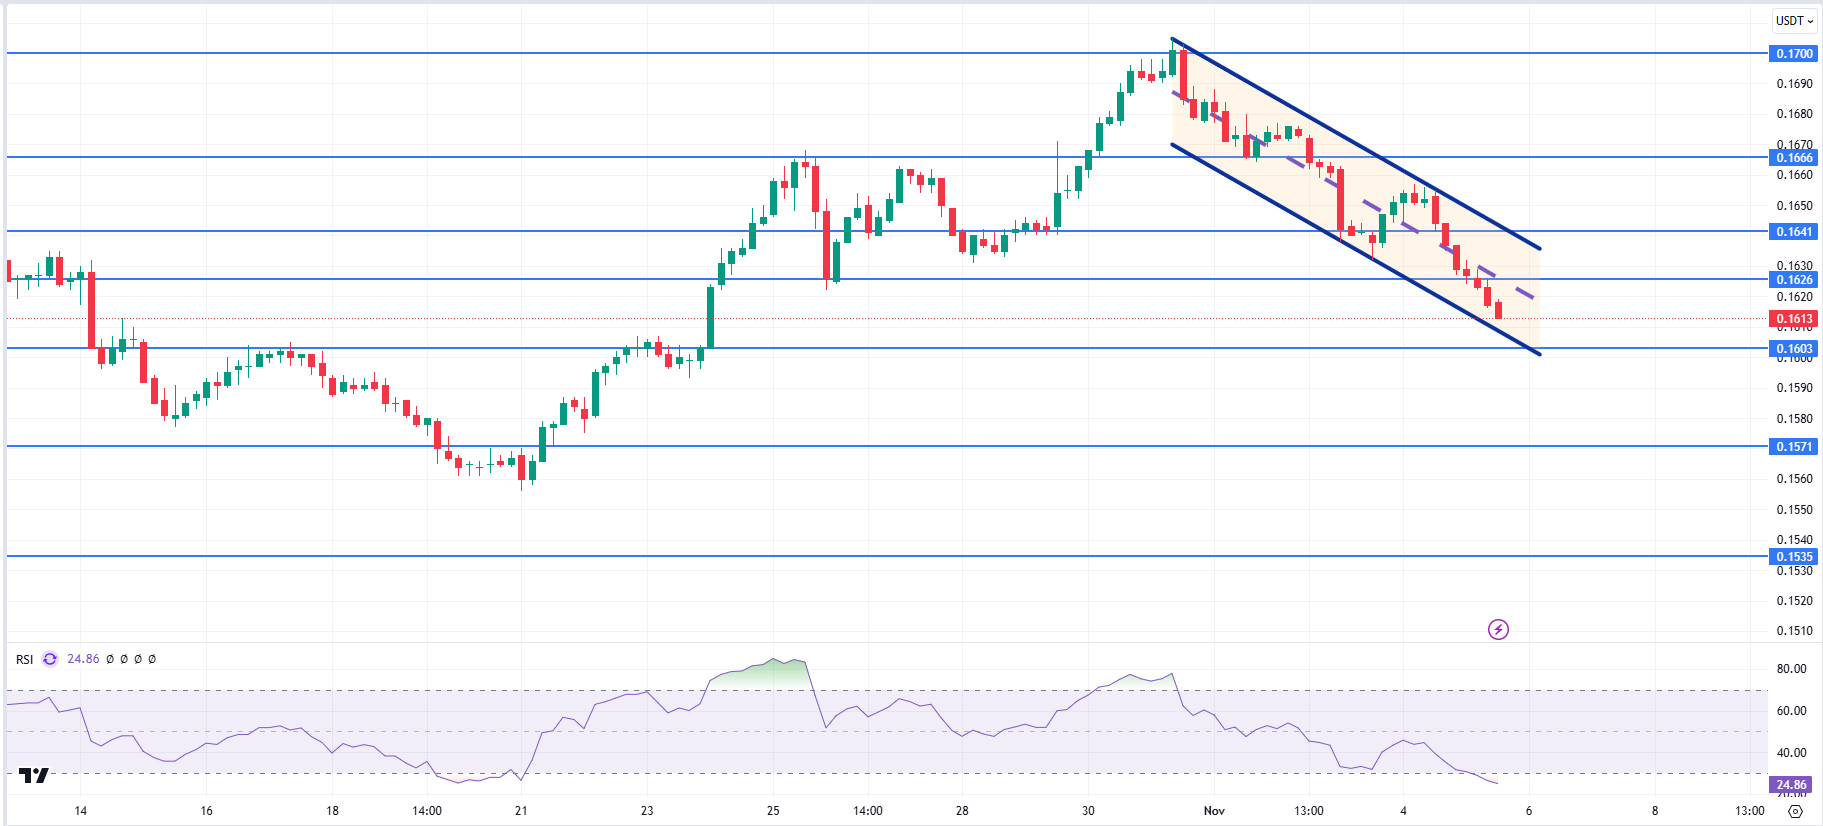
TRX, which started the day at 0.1629, is trading at 0.1613, down about 1% during the day. Today, the market will be closely following the news flows regarding the presidential elections in the US and the tension in the Middle East.
On the 4-hour chart, the bearish channel is in the lower band. Relative Strength Index value is in the oversold zone with 24 and it can be expected to make some rise from its current level. In such a case, it may move to the middle and upper band of the channel and test the 0.1626 and 0.1641 resistances. However, if it cannot close the candle above 0.1626 resistance, it may test 0.1603 support with the sales reaction that may occur. As long as TRX stays above 0.1482 support, the desire to rise may continue. If this support is broken downwards, sales can be expected to increase.
Supports 0.1603 – 0.1571 – 0.1535
Resistances 0.1626 – 0.1641 – 0.1666
DOT/USDT
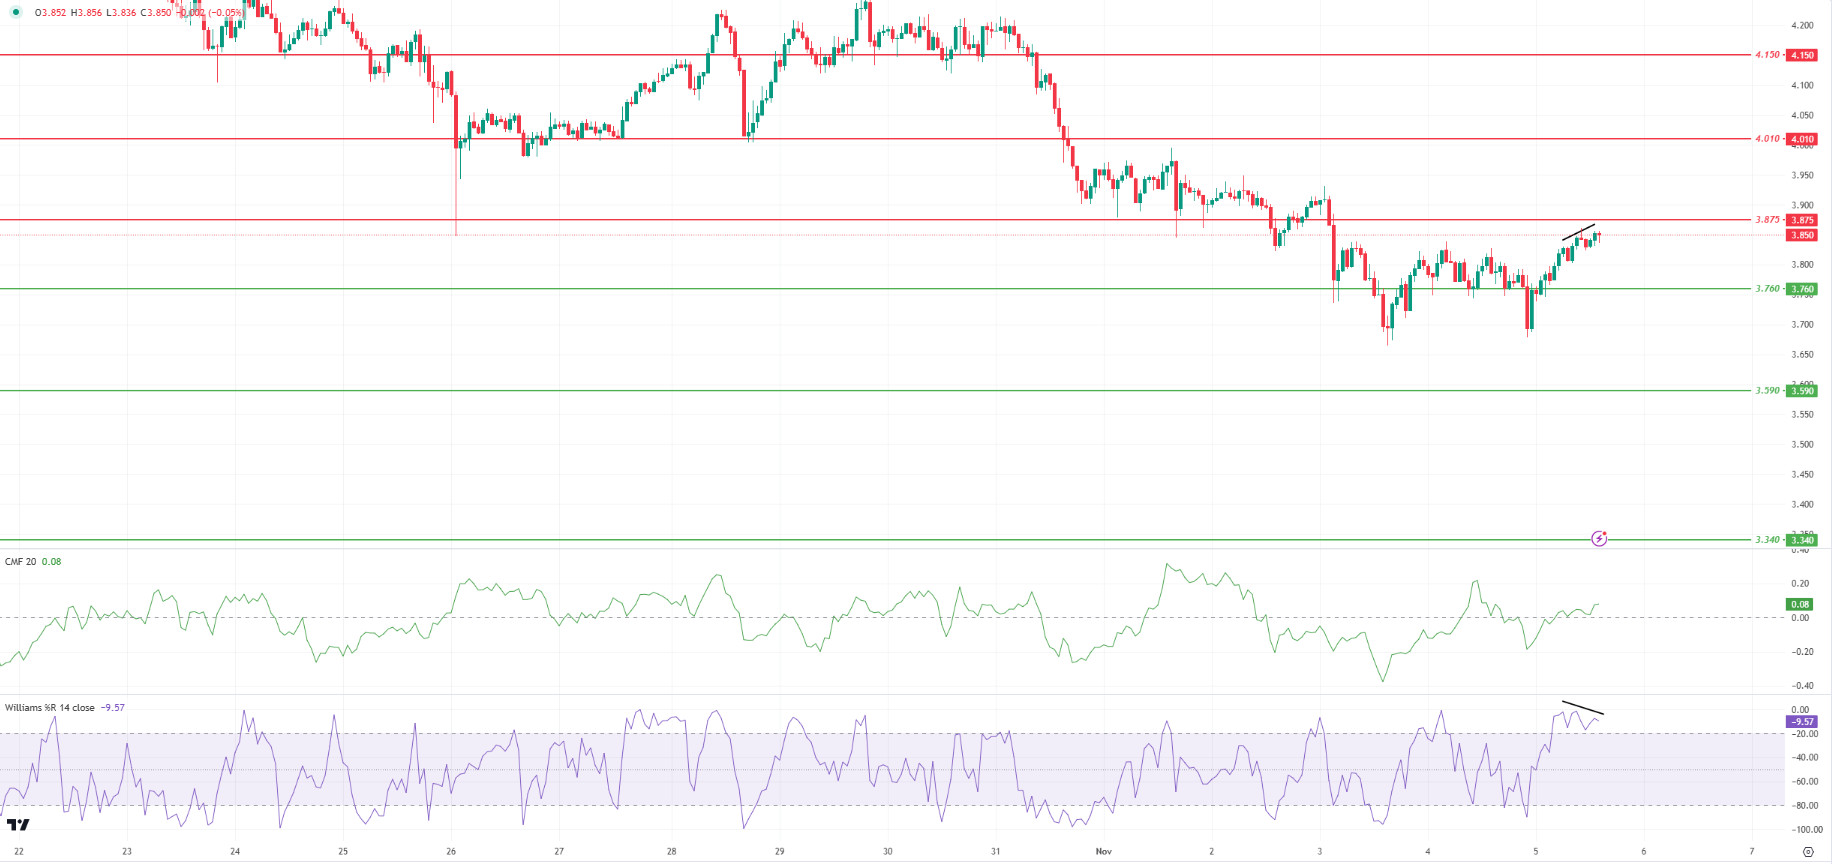
When we analyze the Polkadot (DOT) chart, we see that the price is moving towards the 3.875 resistance level. The Chaikin Money Flow (CMF) oscillator is in positive territory. In this context, if the price can break the selling pressure at 3.875, we may see a move towards the next resistance level of 4.010. When we examine the Williams %R oscillator, we see that there is a negative divergence between it and the price. In this case, if the price cannot break the selling pressure in the 3.875 resistance range, we can say that there may be retracements towards 3.760 levels.
Supports 3,760 – 3,590 – 3,340
Resistances 3.875 – 4.010 – 4.150
SHIB/USDT
Shytoshi Kusama, lead developer of Shiba Inu, has announced a major project to establish a “Strategic Hub for Innovation and Blockchain” (S.H.I.B.) in the US. This initiative, which aims to make the US a global center for blockchain technology, focuses on economic growth, technology advancement and sustainability. The project plans to implement ultra-high-speed internet infrastructure and city-wide blockchain networks such as Shibarium. For Shiba Inu, the hub has the potential to expand the project’s use cases and drive greater adoption, which could have positive implications for the SHIB ecosystem in the long run.
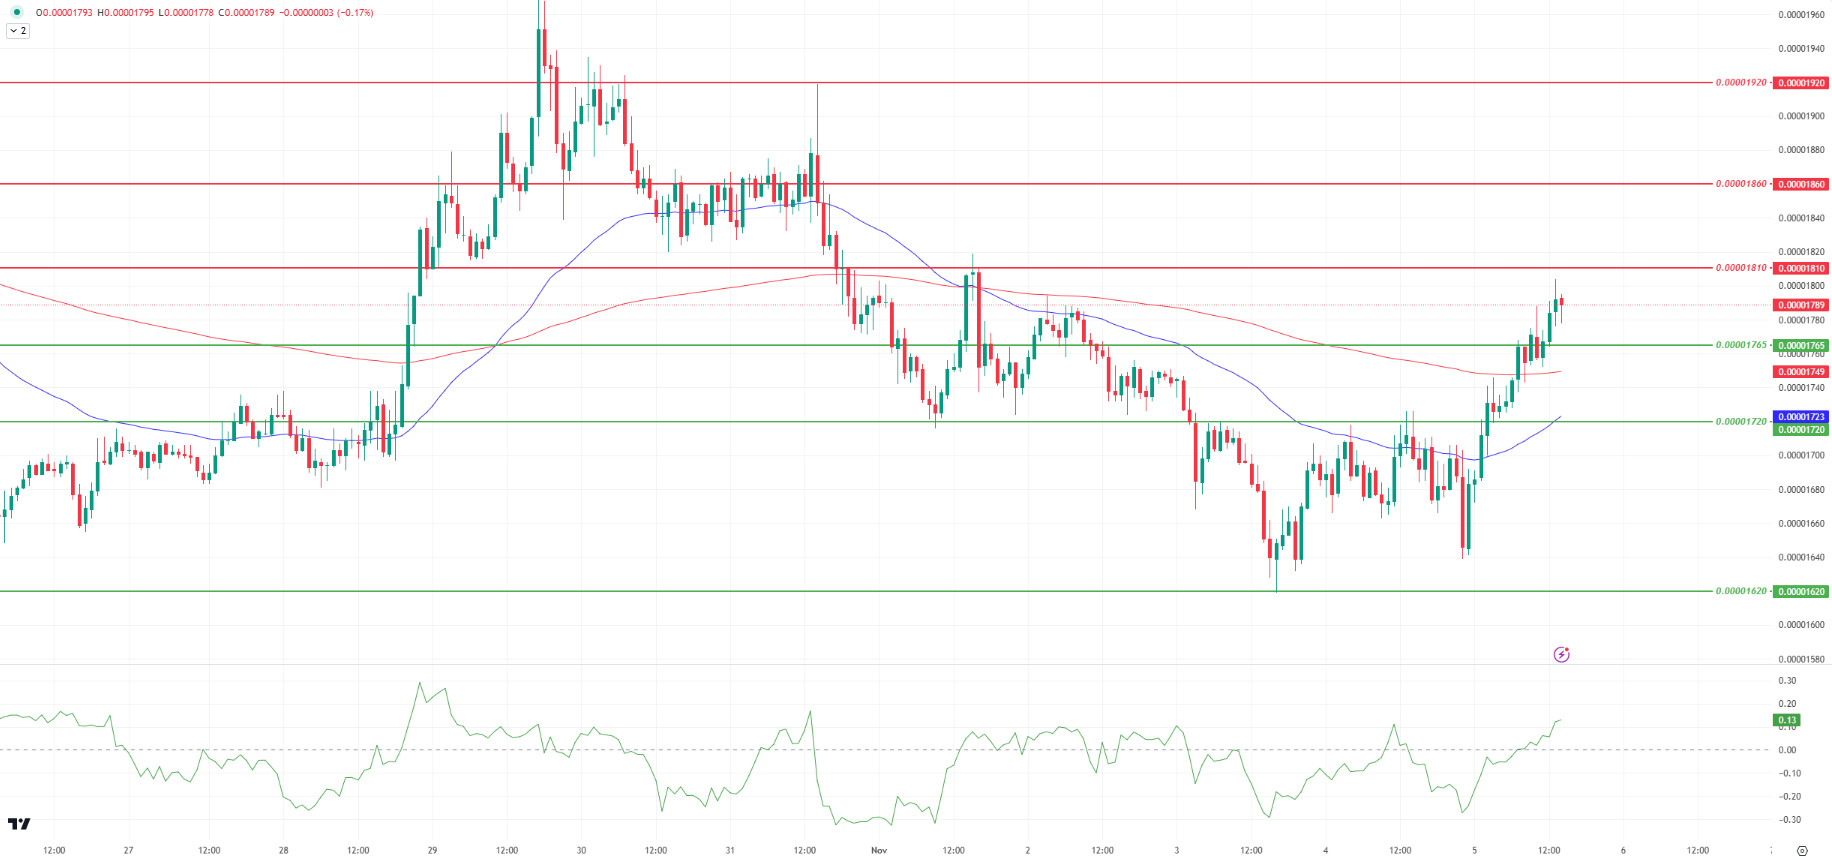
Technically, SHIB broke the 0.00001765 resistance level upwards. Chaikin Money Flow oscillator is in positive territory. EMA50 (Blue Line) is preparing to break EMA200 (Red Line) upwards. If the buyer pressure continues, the price may break the 0.00001810 level upwards. On the other hand, if the price fails to sustain above 0.00001765, we can expect a pullback towards 0.00001720.
Supports 0.00001765 – 0.00001720 – 0.00001620
Resistances 0.00001810 – 0.00001860 – 0.00001920
LEGAL NOTICE
The investment information, comments and recommendations contained herein do not constitute investment advice. Investment advisory services are provided individually by authorized institutions taking into account the risk and return preferences of individuals. The comments and recommendations contained herein are of a general nature. These recommendations may not be suitable for your financial situation and risk and return preferences. Therefore, making an investment decision based solely on the information contained herein may not produce results in line with your expectations.
