MARKET SUMMARY
Latest Situation in Crypto Assets
| Asset | Last Price | 24h Change | Dominance | Market Cap |
|---|---|---|---|---|
| BTC | 76,252.15 | 2.07% | 59.99% | 1.51 T |
| ETH | 2,951.44 | 5.03% | 14.09% | 355.37 B |
| SOLANA | 204.75 | 9.93% | 3.81% | 96.16 B |
| XRP | 0.5528 | 1.54% | 1.25% | 31.44 B |
| DOGE | 0.2001 | 7.08% | 1.16% | 29.11 B |
| CARDANO | 0.4400 | 18.16% | 0.61% | 15.35 B |
| TRX | 0.1616 | 0.98% | 0.55% | 13.97 B |
| AVAX | 28.36 | 6.37% | 0.46% | 11.50 B |
| SHIB | 0.00001914 | 3.71% | 0.45% | 11.25 B |
| LINK | 13.30 | 9.30% | 0.33% | 8.34 B |
| DOT | 4.312 | 6.15% | 0.26% | 6.53 B |
*Prepared on 11.8.2024 at 13:30 (UTC)
WHAT’S LEFT BEHIND
China Announces $1.4 Trillion New Financial Stimulus Package.
China’s top law-making body, the Standing Congress, has announced a support plan for local governments whose debt burden has increased dramatically. Rising up to 10 trillion yuan, i.e. about 1.4 trillion dollars, and spread over many years, the program mostly provides for the restructuring and reduction of local governments’ debts. No details were given on the consumer support expected by the markets.
BTC and ETH Options Expire Today
The options market reported today that it has launched centralized delivery of BTC and ETH options. According to the data, 49,000 BTC options expired with a Put Call Rate of 0.72 and a maximum pain point of $69,000 and a notional value of $3.7 billion, while in terms of ETH options, the number of expiring contracts reaches 295,000 with a Put Call Rate of 0.65 and a maximum pain point of $2,500 and a notional value of $860 million.
BlackRock Bitcoin ETF IBIT
According to Spot on Chain, 11 Bitcoin ETFs in the US recorded the largest single-day inflows, totaling $1.372 billion, a 167-day high. Among them, BlackRock’s Bitcoin ETF (IBIT) saw an inflow of $1.169 billion yesterday, making it the largest one-day inflow since its launch.
South Korean Regulators
According to the Korea Economic Daily, South Korea’s financial regulators will strengthen their monitoring of the market, with a particular focus on Donald Trump-related stocks and increased volatility in the cryptocurrency sector. This decision follows the recent election results in the United States and the recent statement from the Federal Open Market Committee (FED).
HIGHLIGHTS OF THE DAY
Important Economic Calender Data
| Time | News | Expectation | Previous |
|---|---|---|---|
| 15:00 | US Michigan Consumer Sentiment (Nov) | 71.0 | 70.5 |
| 16:00 | US FOMC Member Bowman Speaks | – | – |
INFORMATION
*The calendar is based on UTC (Coordinated Universal Time) time zone. The economic calendar content on the relevant page is obtained from reliable news and data providers. The news in the economic calendar content, the date and time of the announcement of the news, possible changes in the previous, expectations and announced figures are made by the data provider institutions. Darkex cannot be held responsible for possible changes that may arise from similar situations.
MARKET COMPASS
We continue to monitor the aftermath of the US presidential election and the Federal Reserve’s monetary policy decisions. Stock market indices are mixed, the dollar index is slightly lower and digital assets are looking to extend their gains. Interest in underlying cryptocurrency ETFs continues, with recent gains in ETH and BTC’s dominance easing somewhat. China took new steps to support its economy. Global markets continue to follow similar headlines after a busy week.
From the short term to the big picture.
The victory of former President Trump, one of the main pillars of our bullish expectation for the long term perspective in digital assets, produced a result in line with our forecasts. The continuation of the Fed’s interest rate cut cycle and the inflows into BTC ETFs, indicating increased institutional investor interest, support our upside forecast for the big picture for now.
In the short term, given the nature of the market and pricing behavior, we think it would not be surprising to see some respite or pullbacks in digital assets from time to time. At this point, it is worth reiterating that fundamental dynamics remain bullish. While the fact that Bitcoin, the largest digital currency, has extended its record high may encourage buyers to take new, upside positions, we will watch this group struggle with the crowd that may want to take profit realizations. For now, we see limited pullbacks in the short term, but we consider the possibility of seeing a slowdown after the last strong uptrend as one of the options on the table.
TECHNICAL ANALYSIS
BTC/USDT
After D.Trump’s victory in the US election, the FED’s interest rate cut in line with interest rate cut expectations provided a positive development for Bitcoin and crypto markets, while eyes turned to the fiscal stimulus support package in Asia. Today, China announced a new fiscal stimulus package of 1.4 trillion dollars, but the lack of details on the consumer support expected by the markets has not satisfied the market for now. In the coming period, developments in Asia will continue to be closely monitored.
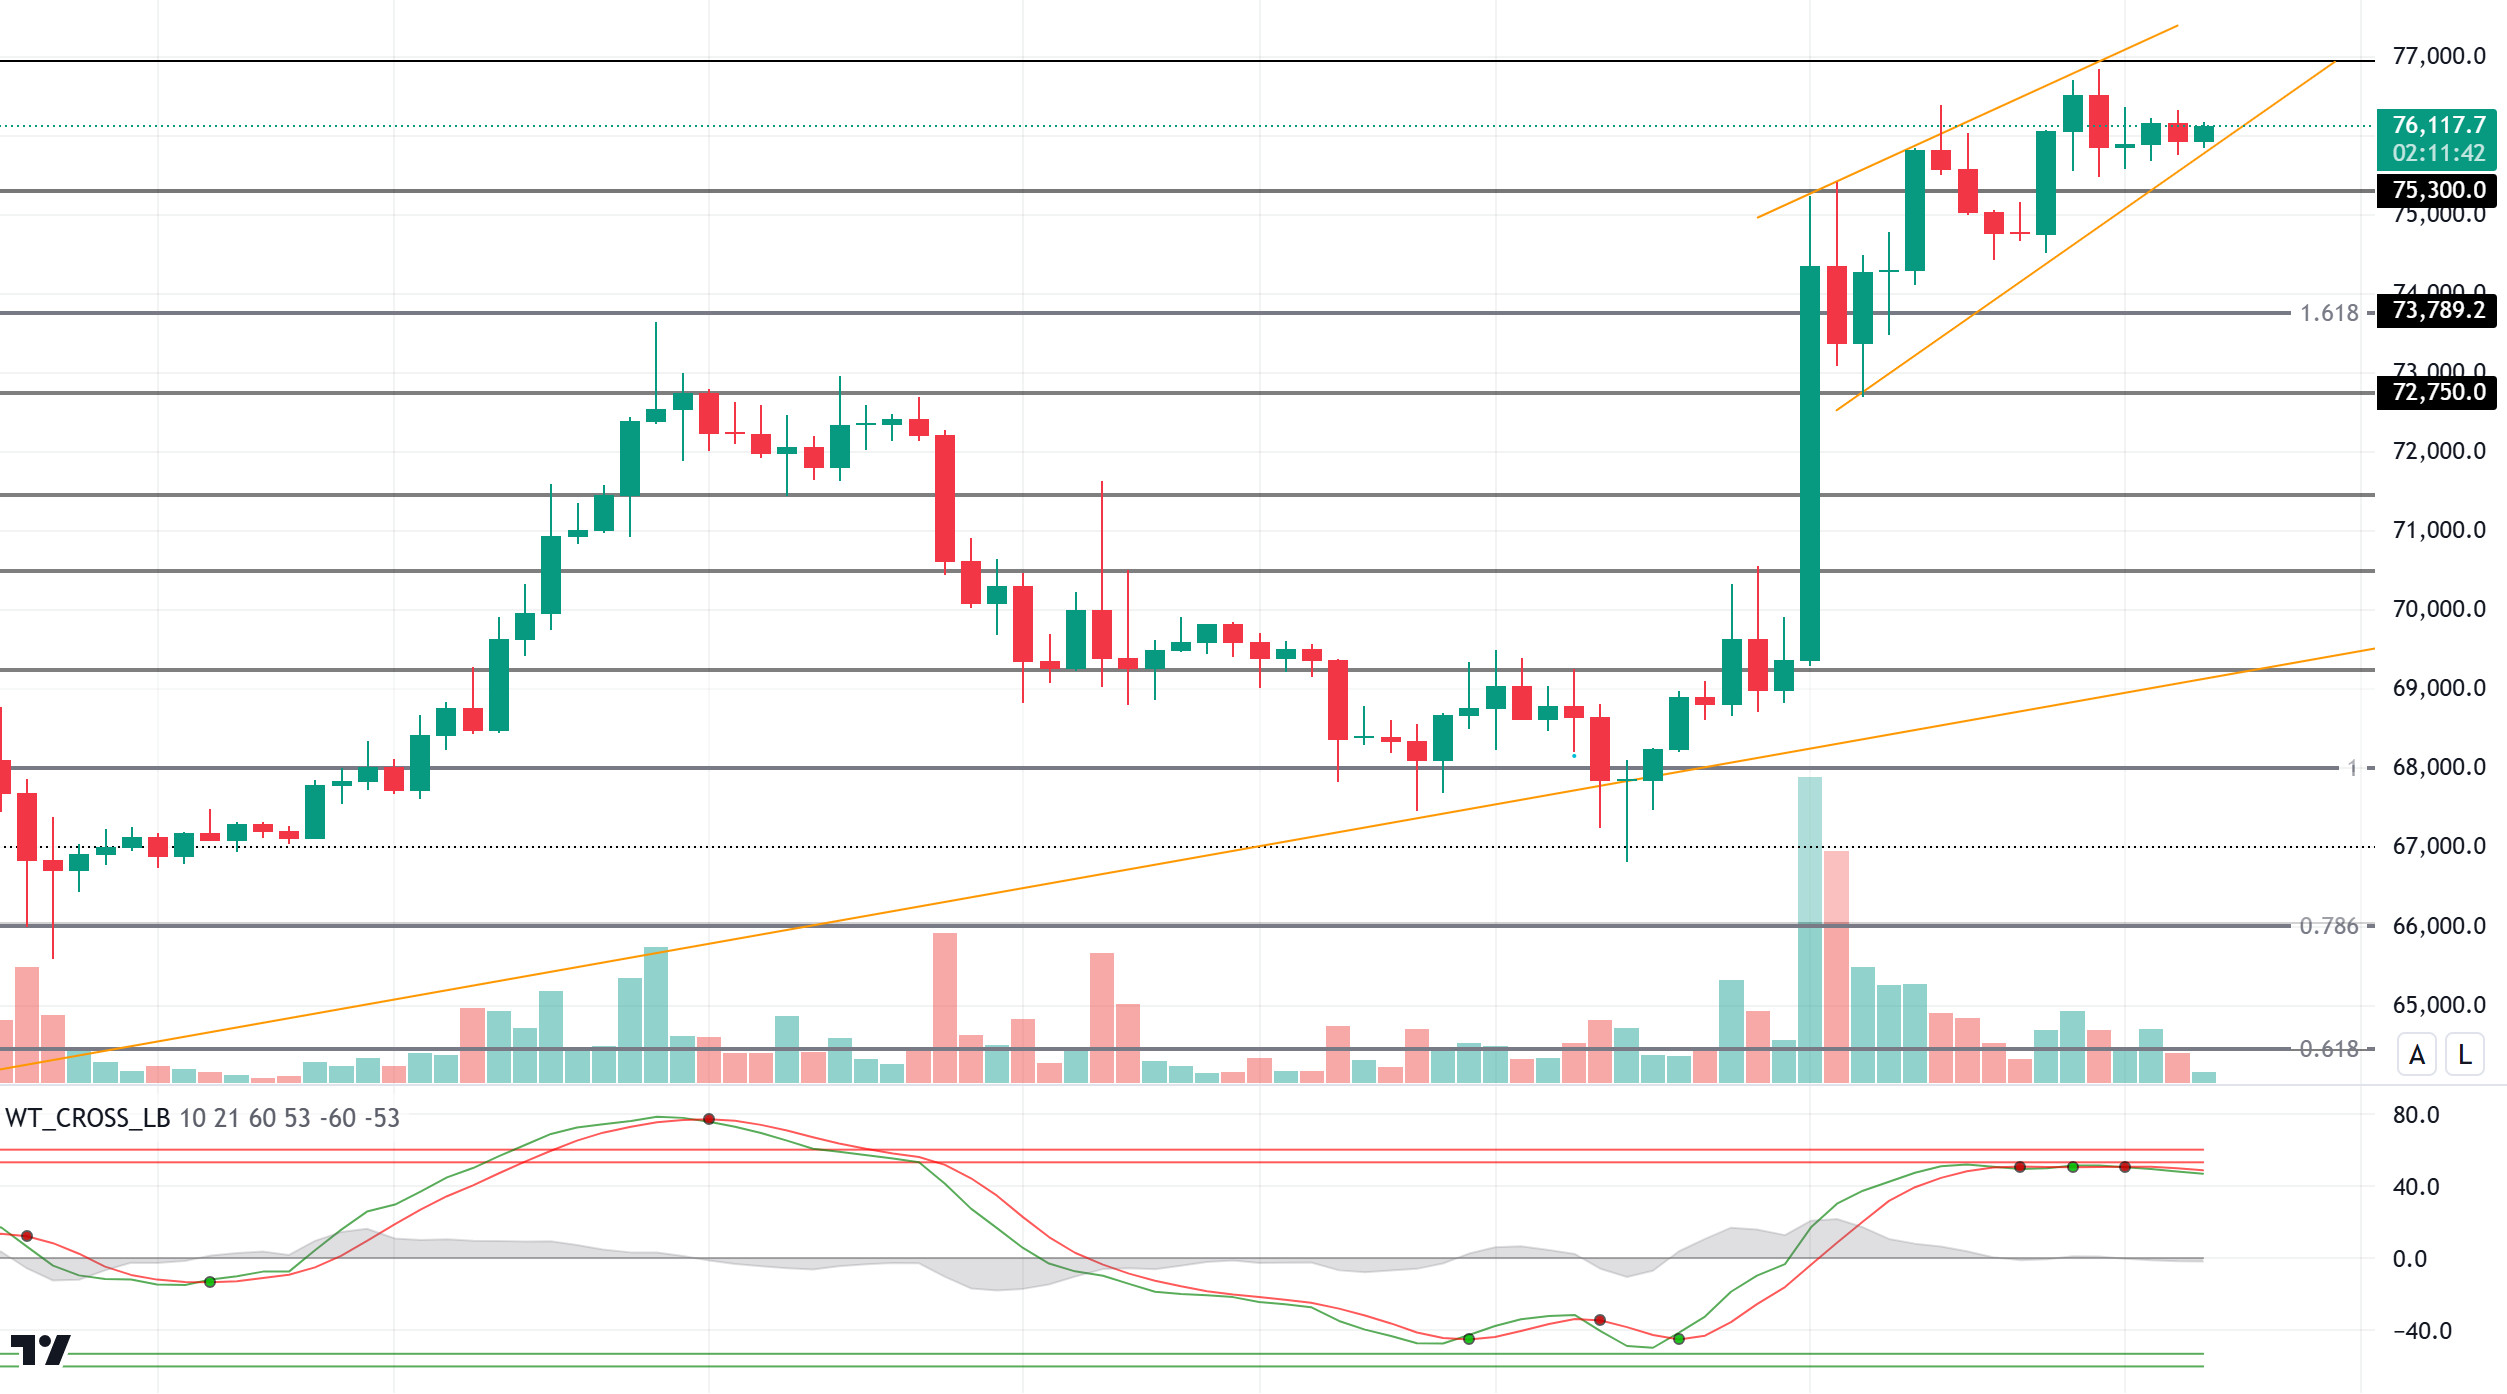
When we look at the BTC technical outlook, pricing within the rising wedge pattern exhibits low volatility. BTC, which managed to hold around the ATH level of 76,943, is observed to be in the process of consolidation. Although technical oscillators have reached the oversold zone, positive pricing on the spot ETF side keeps the price at its peak. With the effect of optimistic weather, it may pull the price to the 80,000 band in the fourth peak attempt. Otherwise, the break of the 75,300 point in retracements may deepen the declines somewhat.
Supports 75,300 – 73,789 – 72,750
Resistances 76,400- 76,943 – 83,060
ETH/USDT
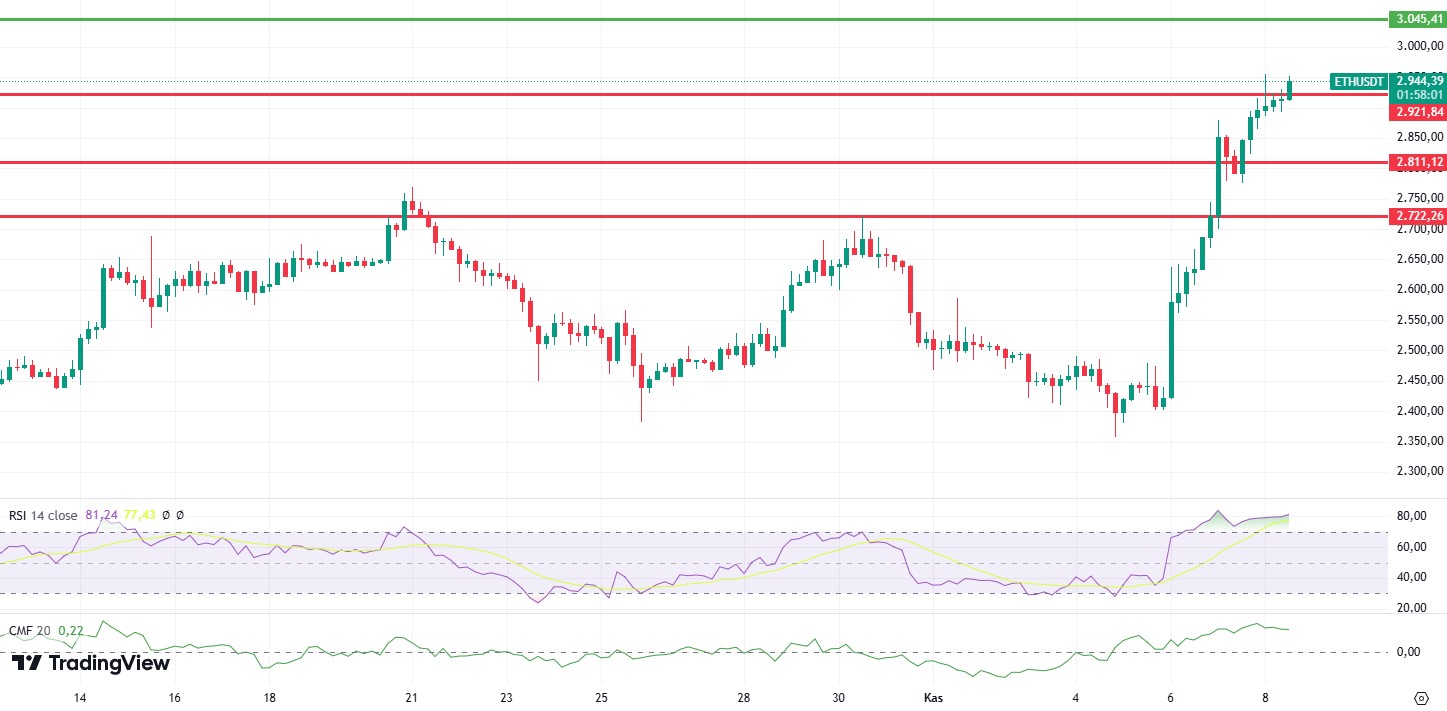
At 2,921, the uptrend slowed down for ETH, while the Relative Strength Index (RSI) remained in the overbought zone, we see that there are positive structures on Chaikin Money Flow (CMF) and momentum. At the same time, looking at the Cumulative Volume Delta (CVD), we see that a downward trend continues on the futures side, rising on the spot side. This can be counted as another effect that looks quite positive. As the 2,921 level was exceeded during the day, we can see that the psychological resistance of $ 3,000 was exceeded and the next resistance level of 3,045 was reached. In addition, it can be said that attention should be paid to the 2,811 level, which is a critical support level, and that a downward trend may begin with the break of this level.
Supports 2,921 – 2,811 – 2,722
Resistances 3,045 – 3,216 – 3,360
LINK/USDT
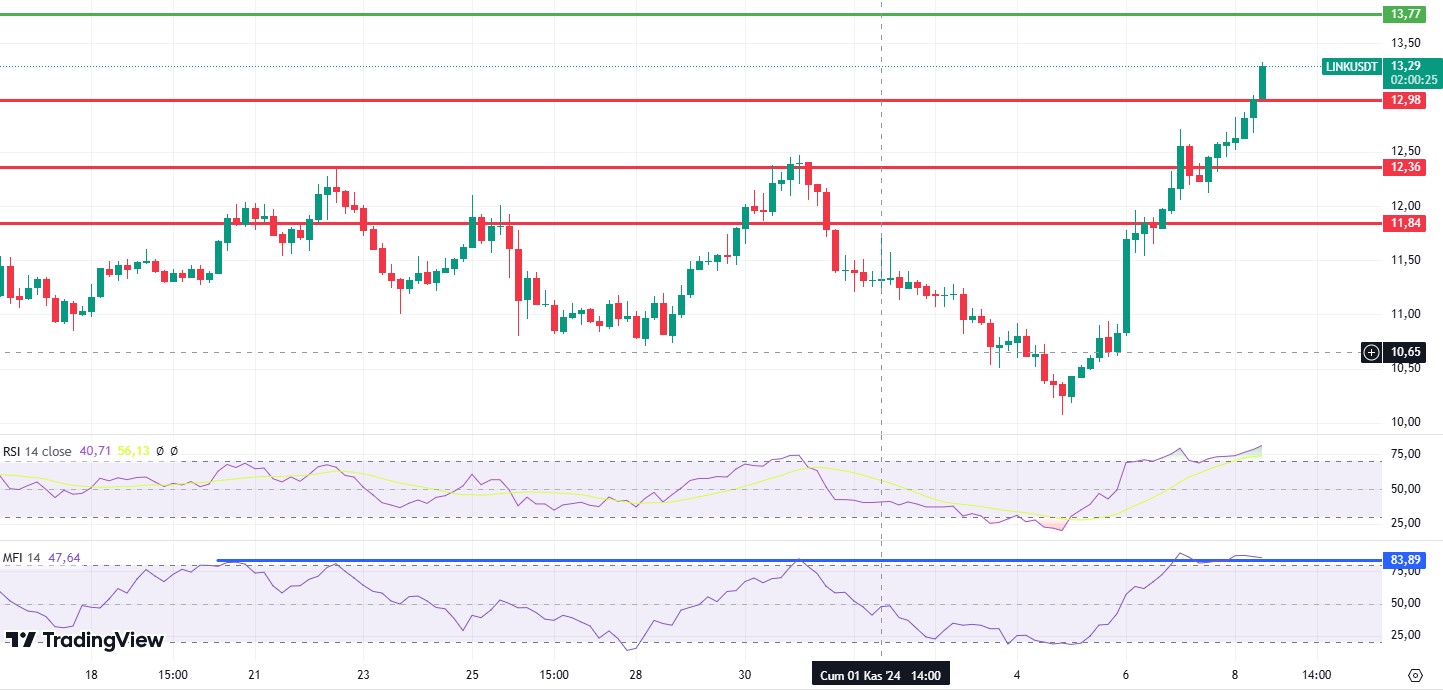
Breaking the 12.98 level, one of the most important resistance levels for LINK, looks very positive. With the break of this level, it can be said that an uptrend with high volatility may begin. It is also clearly seen that this scenario is supported by the positive structures on Relative Strength Index (RSI), Chaikin Money Flow (CMF) and Money Flow Index (MFI). However, it should be noted that investors should pay attention to the 12.98 level and a downside breakout of this level may be a bull trap signal and thus a decline may begin.
Supports 12.98 – 12.36 – 11.84
Resistances 13.77 – 14.75 – 16.28
SOL/USDT
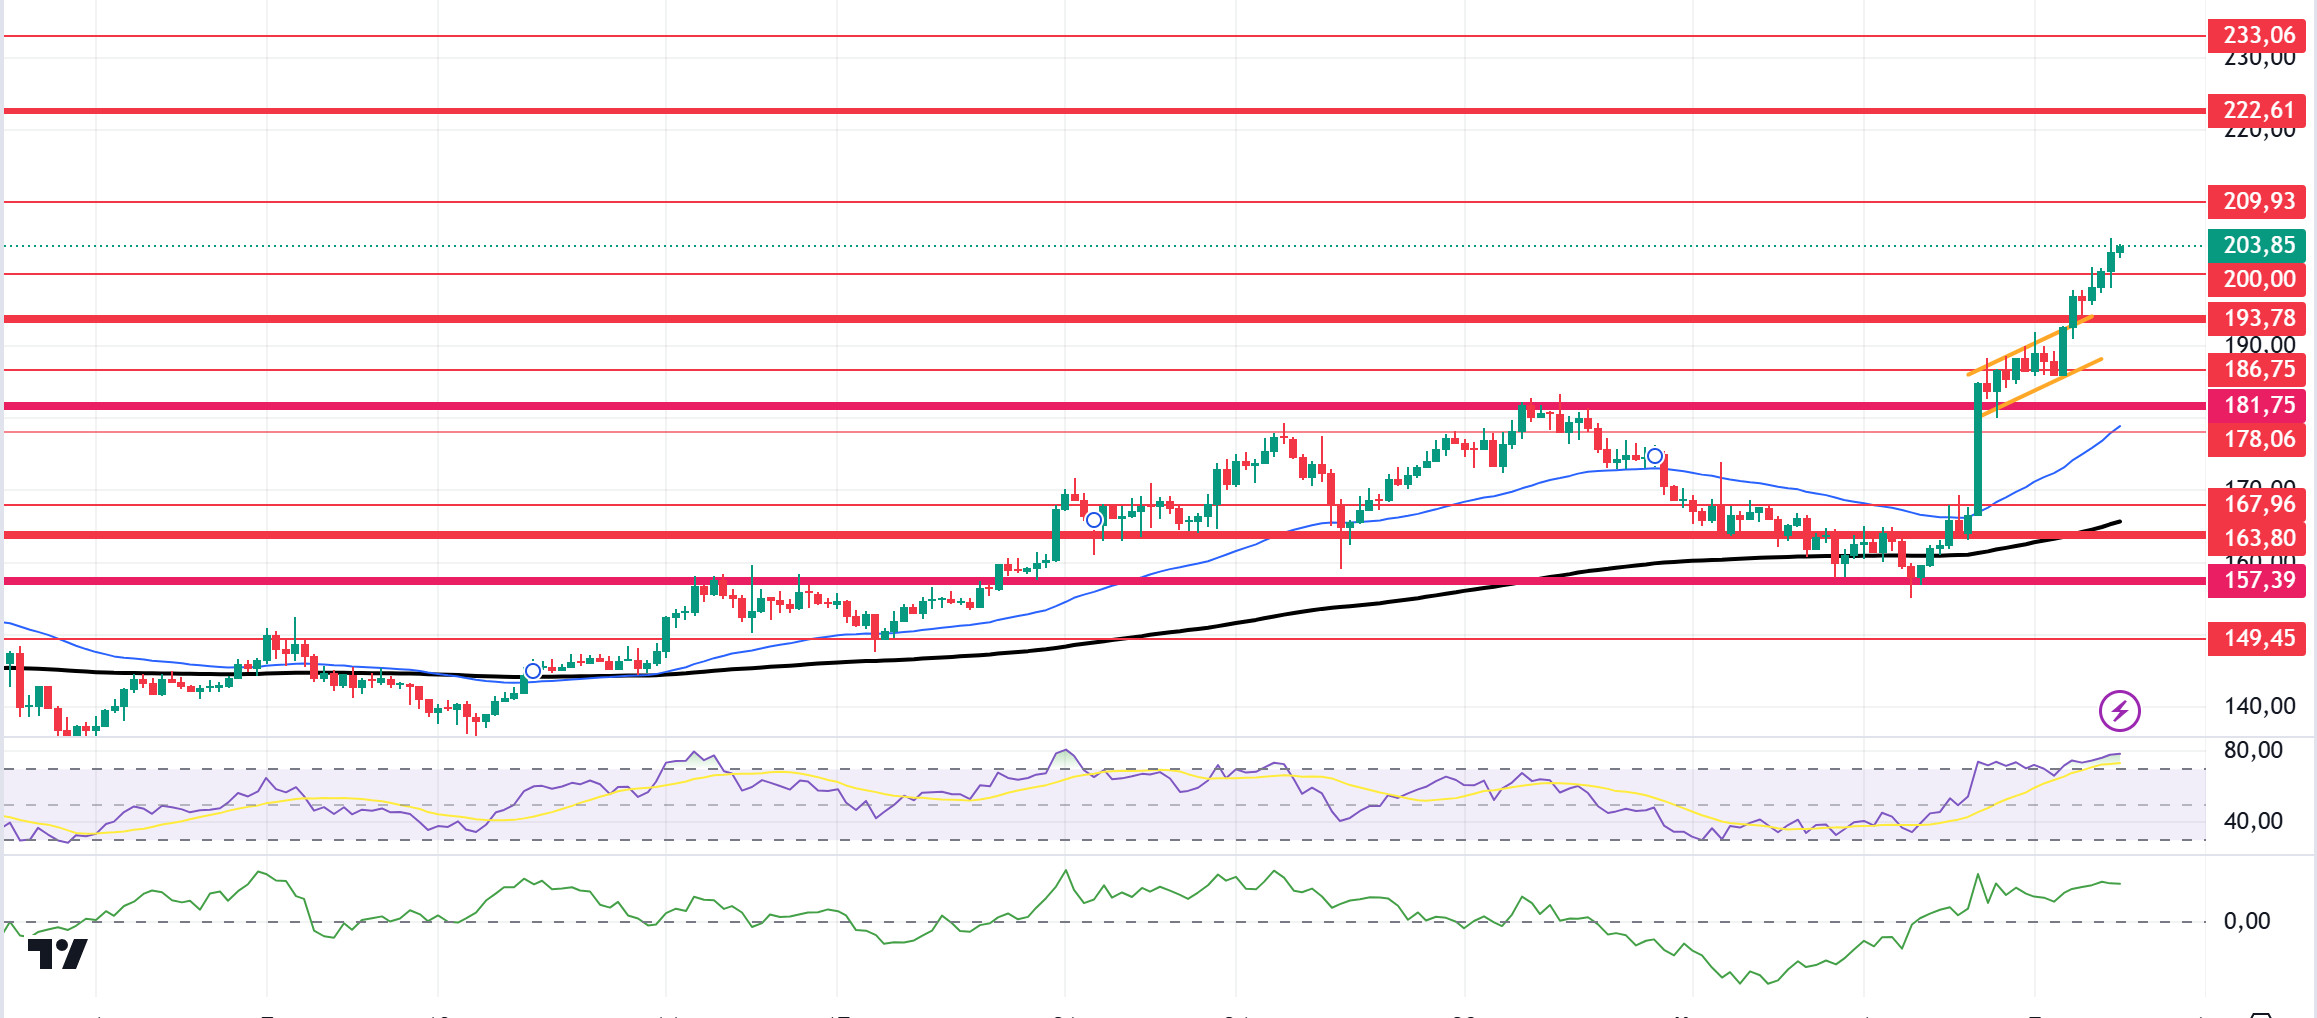
Technically speaking, SOL continues to rise. At the time of writing, SOL is trading at 203.85, the highest level it has reached since March. At the same time, it strongly broke the 193.78 level, which we call critical resistance, and ran it as a support level. On the 4-hour timeframe, the 50 EMA (Blue Line) continues to be above the 200 EMA (Black Line). This could mean that the uptrend will continue. Relative Strength Index (RSI)14 is in the overbought zone, which may bring profit sales. However, when we examine the Chaikin Money Flow (CMF)20 indicator, although money inflows are positive, inflows have started to decline. The 193.78 level is a very strong resistance point in the uptrend driven by both macroeconomic conditions and innovations in the Solana ecosystem. If it rises above this level, the rise may continue strongly. In case of retracements due to possible political reasons or profit sales, the 181.75 support level may be triggered again. If the price hits this support level, momentum may increase and a potential bullish opportunity may arise.
Supports 200.00 – 193.78 – 186.75
Resistances 209.93 – 222.61 – 233.06
ADA/USDT
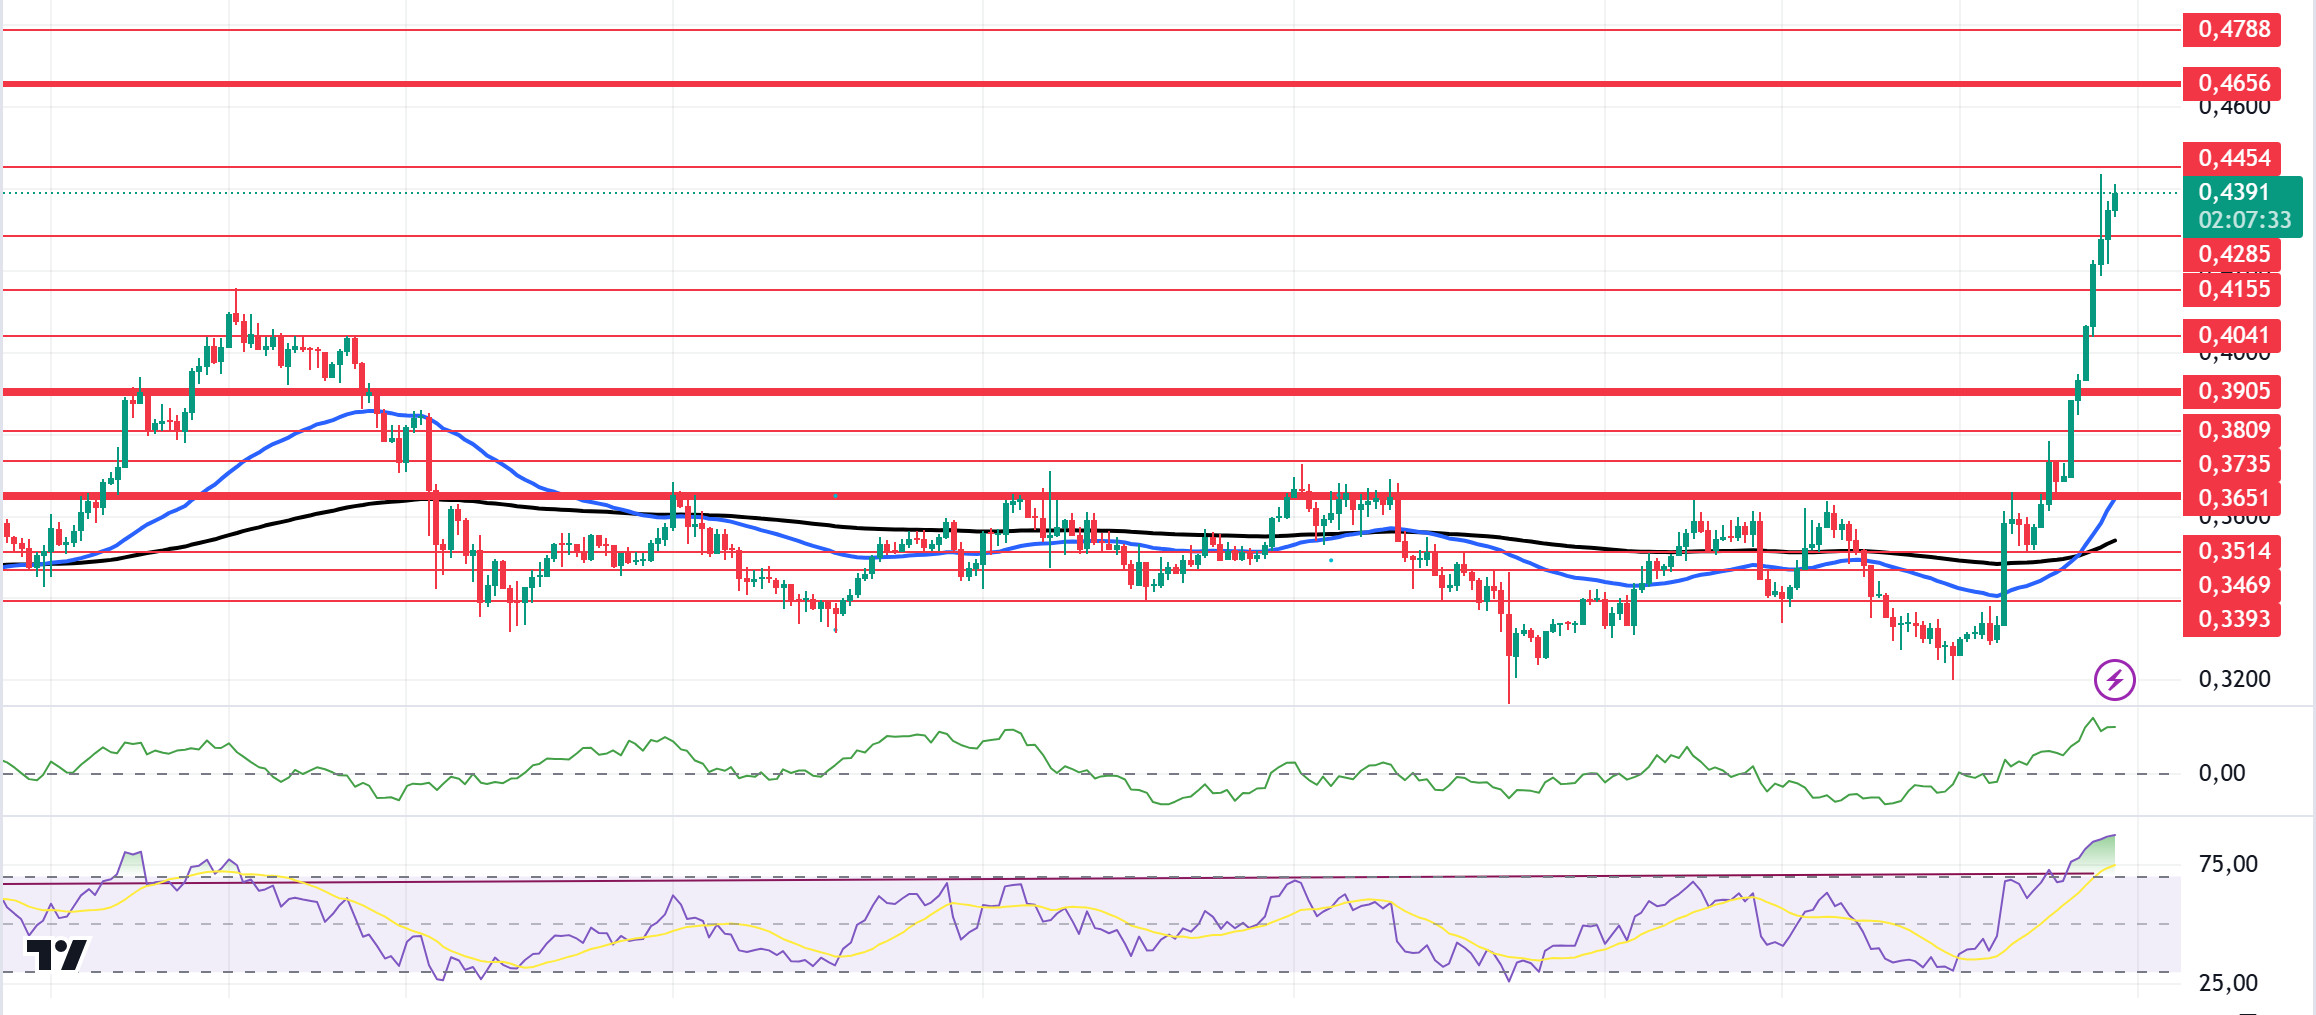
In the Cardano ecosystem, ADA’s Open Interest data shows that ADA’s Open Interest rose from $217.71 million on Wednesday to $329.01 million on Friday, the highest level since mid-April. This steady increase in address activity and whale trades suggests that market confidence is growing, with potential FOMO (Fear of Missing Out) building among investors. As Cardano continues this bullish wave, the community is watching closely to see if the momentum will continue. Data from Santiment revealed an increase in Cardano whale activity over the past few days. According to the on-chain data provider, the number of ADA transactions exceeding $100,000 per day has skyrocketed. On Thursday, 697 of these transactions took place. All this data explains the rise. When we look technically, it broke the place where it has been accumulated since October 1 and started its rise. ADA, which has increased by about 17.06% in the last 24 hours, is trading at 0.4391 at the time of writing. The price is pricing above the 50 EMA (Blue Line) and 200 EMA (Black Line) on the 4-hour chart. However, the 50 EMA has moved above the 200 EMA. This shows us that the trend is bullish. At the same time, when we examine the Chaikin Money Flow (CMF)20 indicator, we can say that there is an excessive flow of money in the positive zone. However, Relative Strength Index (RSI)14 is in the overbought zone, which may bring profit sales. Considering all this, it has made the 0.3905 level support, which works as a strong resistance. The support level of 0.3951 should be followed in the decline that will be experienced due to the macroeconomic data and negativities in the ecosystem or in the retracements brought by profit sales. It may be appropriate to buy when it comes to this price level. In the rises caused by macroeconomic data or developments in the ecosystem, the 0.4656 level should be followed. If it breaks this level, the rise may strengthen.
Supports 0.4285 – 0.4155 – 0.4041
Resistances 0.4454 – 0.4656 – 0.4788
AVAX/USDT
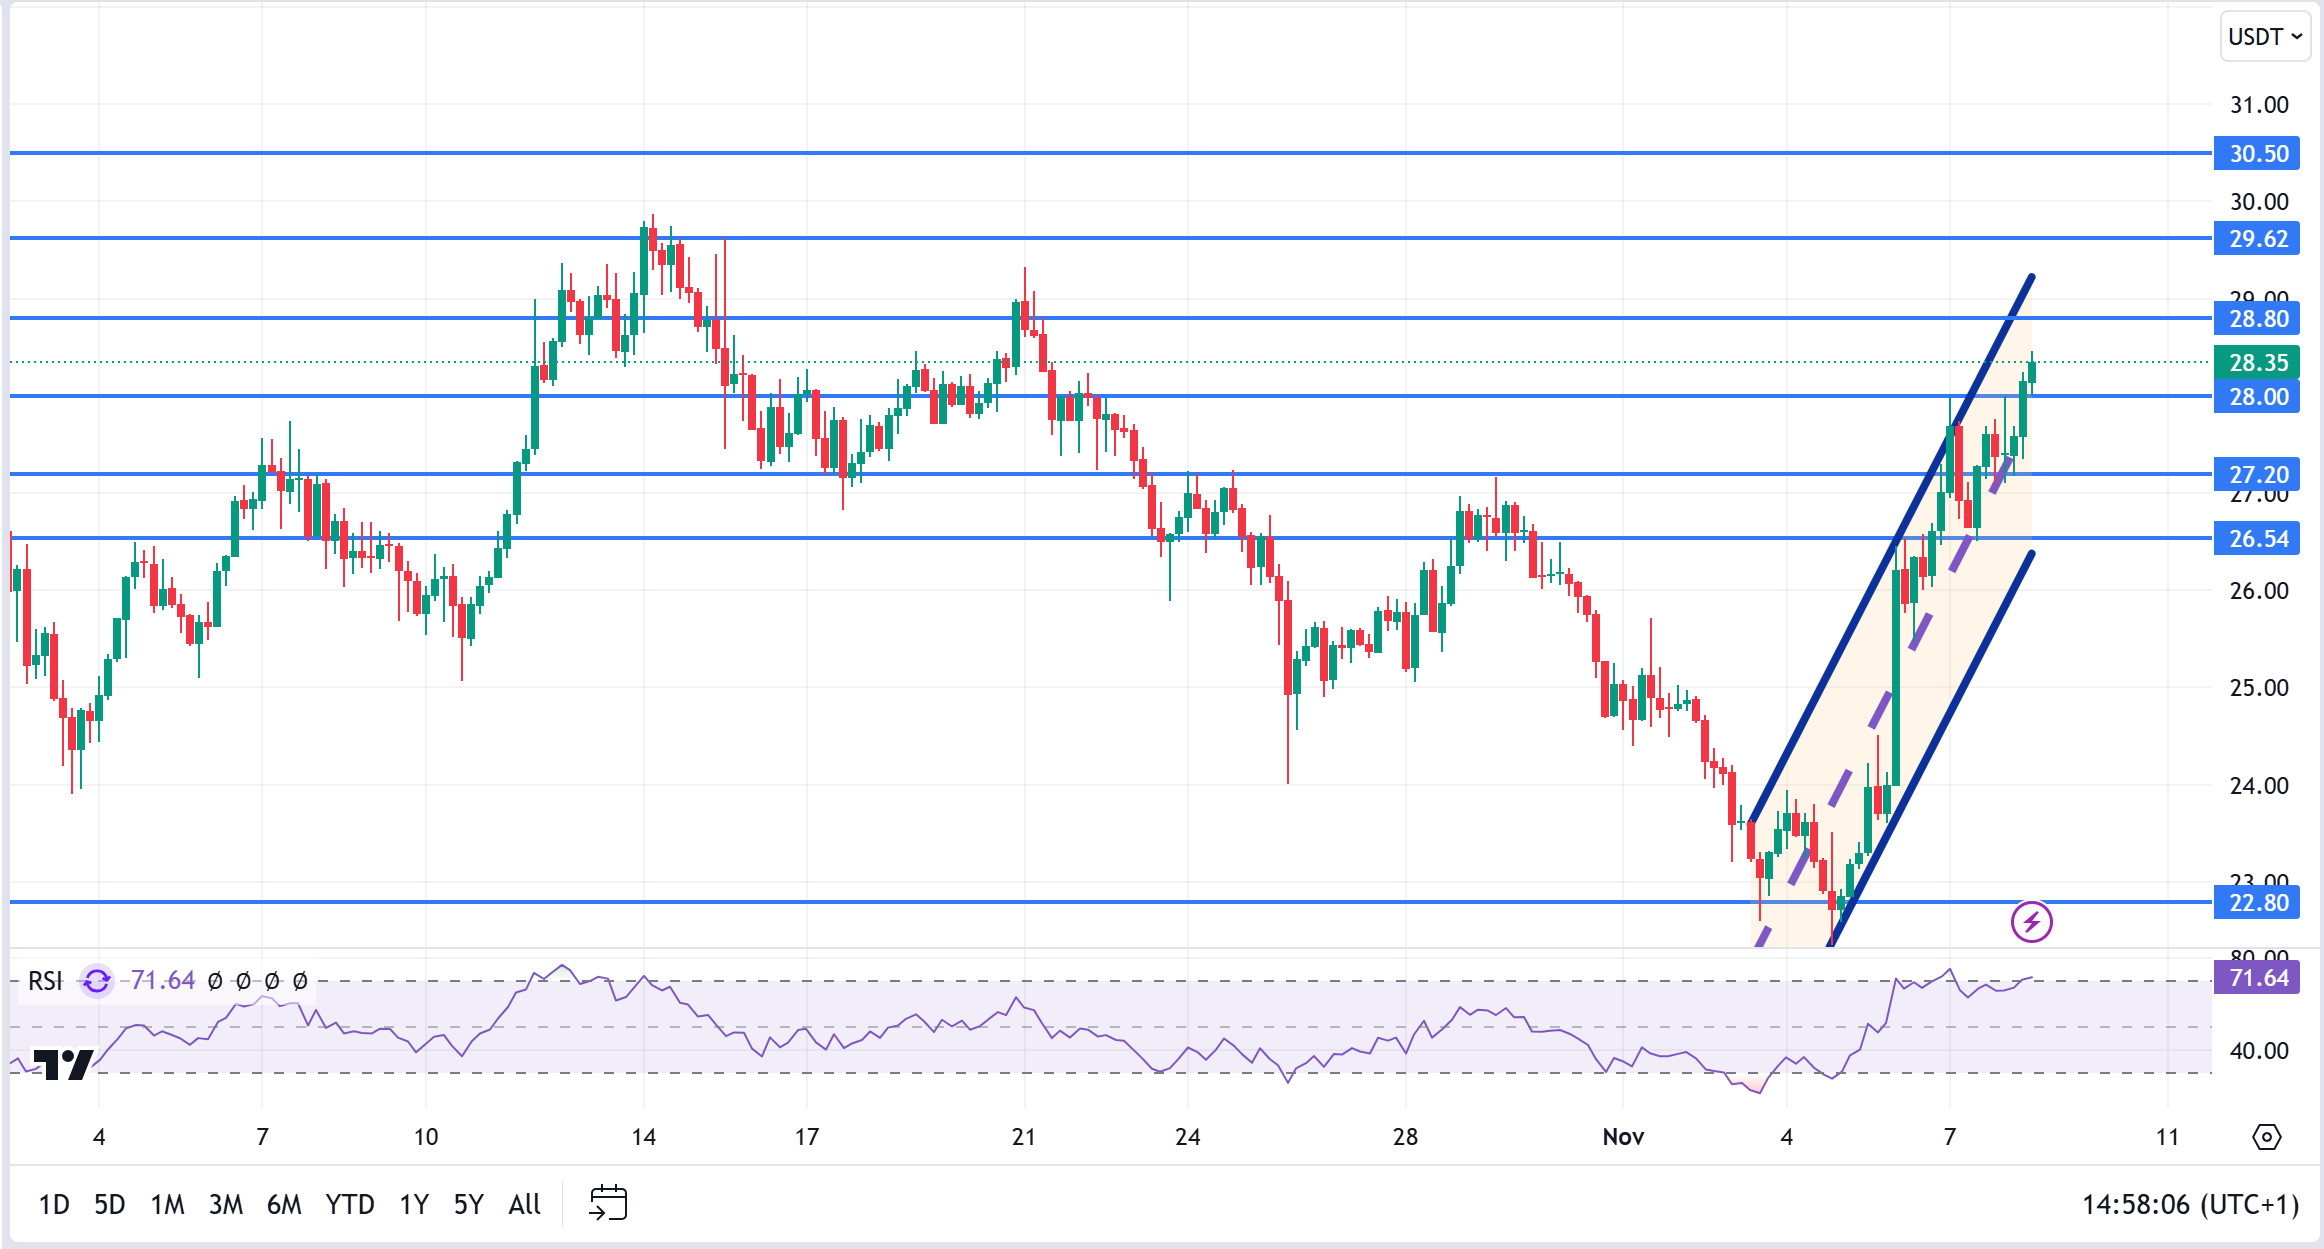
AVAX, which opened today at 27.39, is trading at 28.35, up about 3.5% during the day. There is no planned data coming from the US today. Therefore, it may be a day when price movement will be limited. News flows from the Middle East will be important for the market.
On the 4-hour chart, the bullish channel is in its mid-band and the Relative Strength Index is in overbought territory at 71. Some decline can be expected from these levels. In such a case, it may test the 28.00 and 27.20 supports. On the other hand, reports are emerging that the BlackRock tokenization fund BUIDL may be launched in Avalanche. If this situation becomes clear, it may test the 28.80 resistance with the volume purchases that may occur. As long as it stays above 22.80 support during the day, the desire to rise may continue. With the break of 22.80 support, sales may increase.
Supports 28.00 – 27.20 – 26.54
Resistances 28.80 – 29.62 – 30.50
TRX/USDT
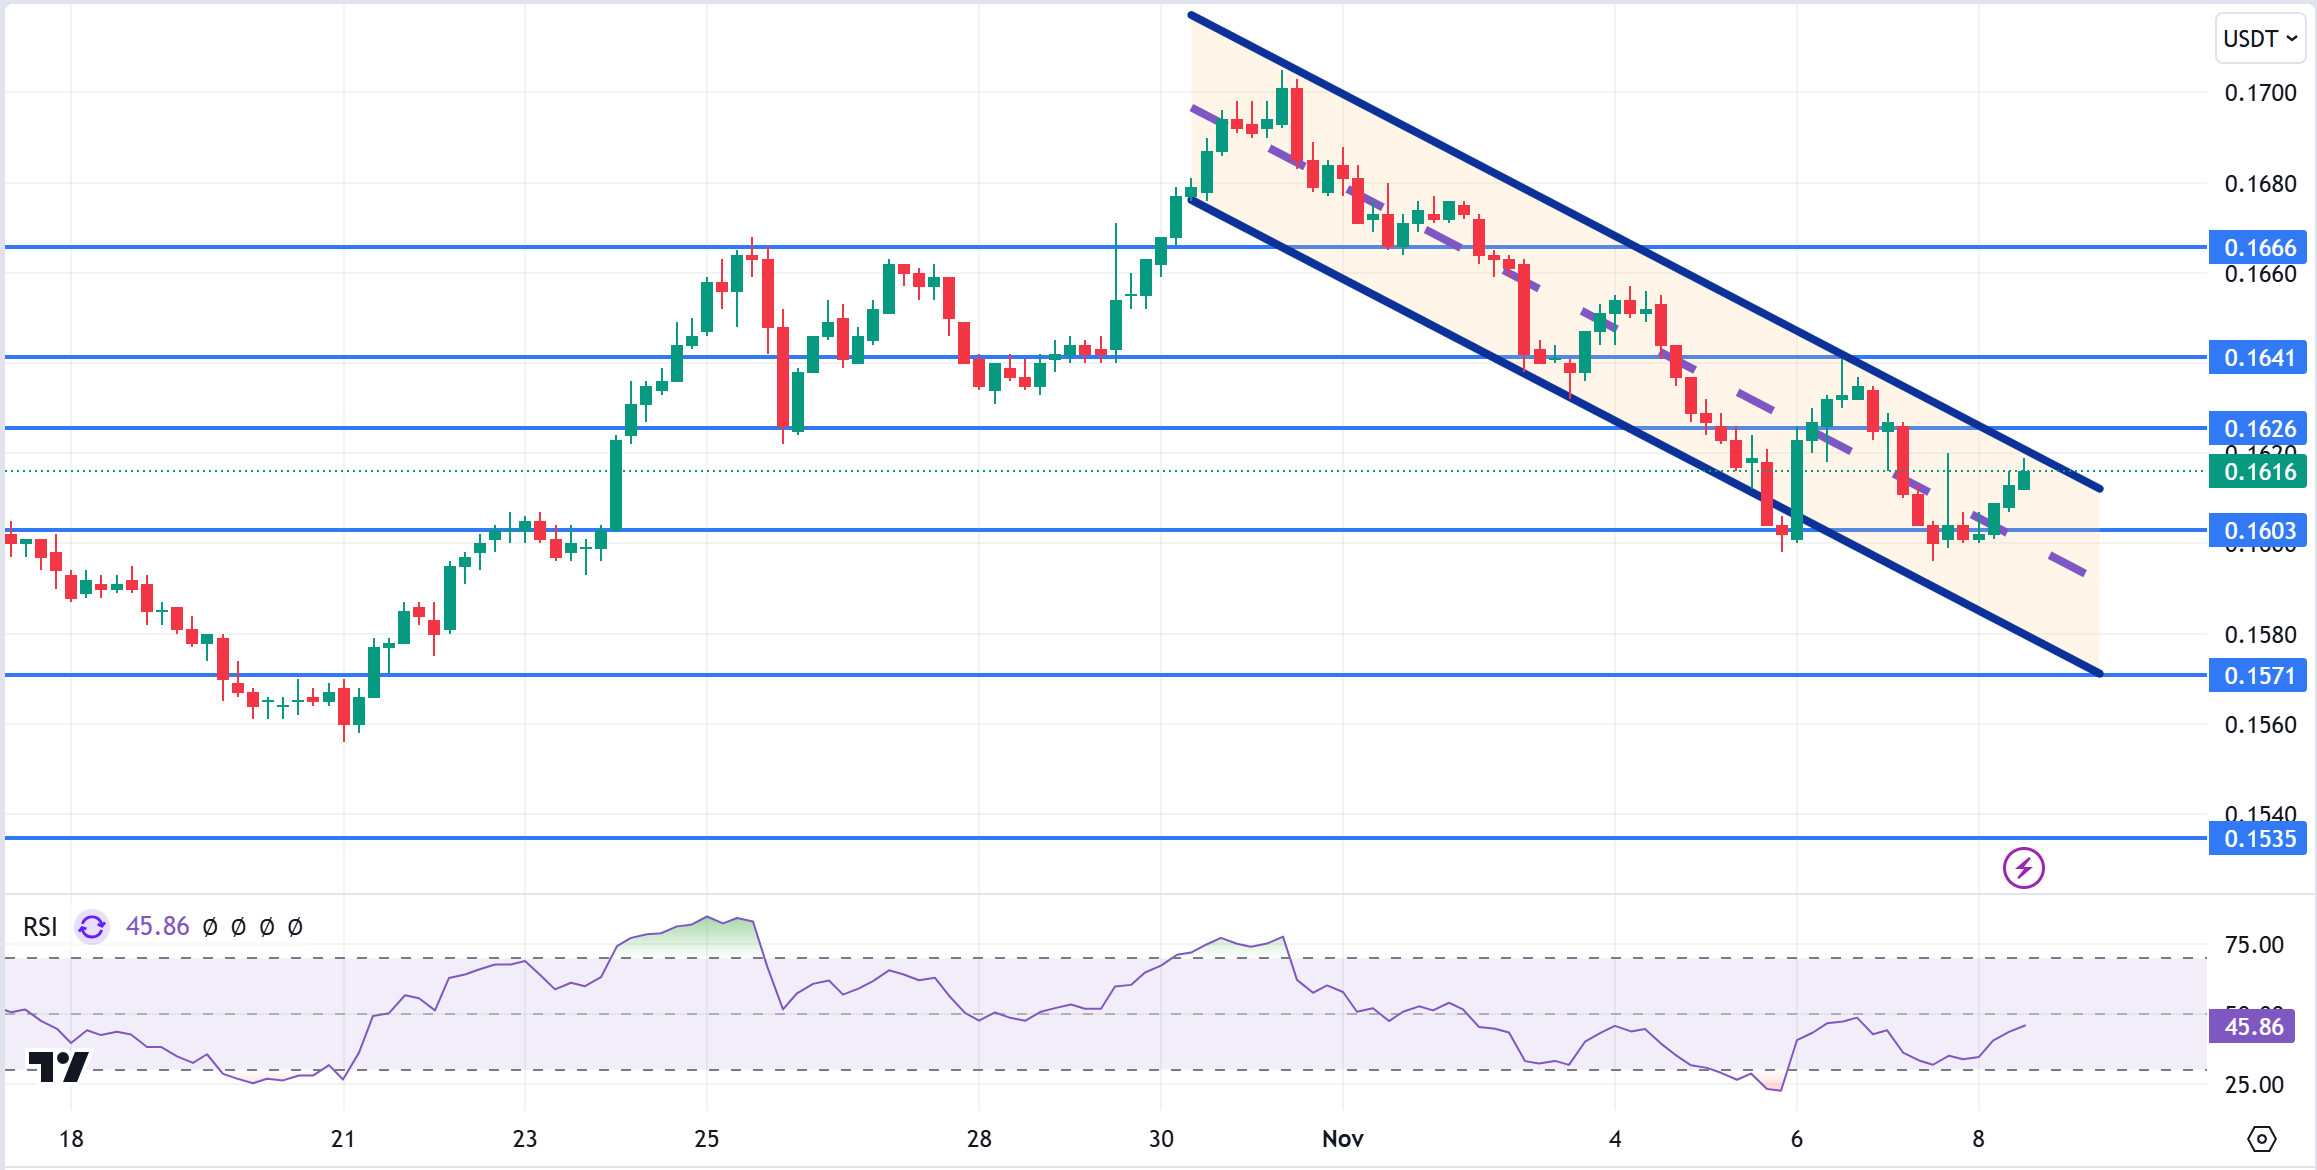
TRX, which started today at 0.1601, is trading at 0.1616, up about 1% during the day. There is no planned data expected to affect the market today. The market will be closely following the news flows regarding the tension in the Middle East.
On the 4-hour chart, the bearish channel is in its upper band. With a Relative Strength Index value of 45, it can be expected to decline slightly from its current level. In such a case, it may move to the middle and lower band of the channel and test the 0.1603 support. However, it cannot close the candle below 0.1603 support and may test the 0.1626 and 0.1641 resistances with the buying reaction that may occur with the news that the tension is over from the Middle East. As long as TRX stays above 0.1482 support, the desire to rise may continue. If this support is broken downwards, sales can be expected to increase.
Supports 0.1603 – 0.1571 – 0.1535
Resistances 0.1626 – 0.1641 – 0.1666
DOT/USDT
Hyper Bridge has officially launched its mainnet on Polkadot, enabling secure, scalable and verifiable cross-chain communication with Ethereum, Optimism, BNB Chain and many more blockchains. This launch could increase Polkadot’s cross-blockchain integration power by making cross-blockchain interaction more accessible and secure. Hyperbridge’s reliance on a ZK-proof and finality-based security model could provide a more robust infrastructure for developers in the Polkadot ecosystem, allowing DeFi and DAO projects to grow.
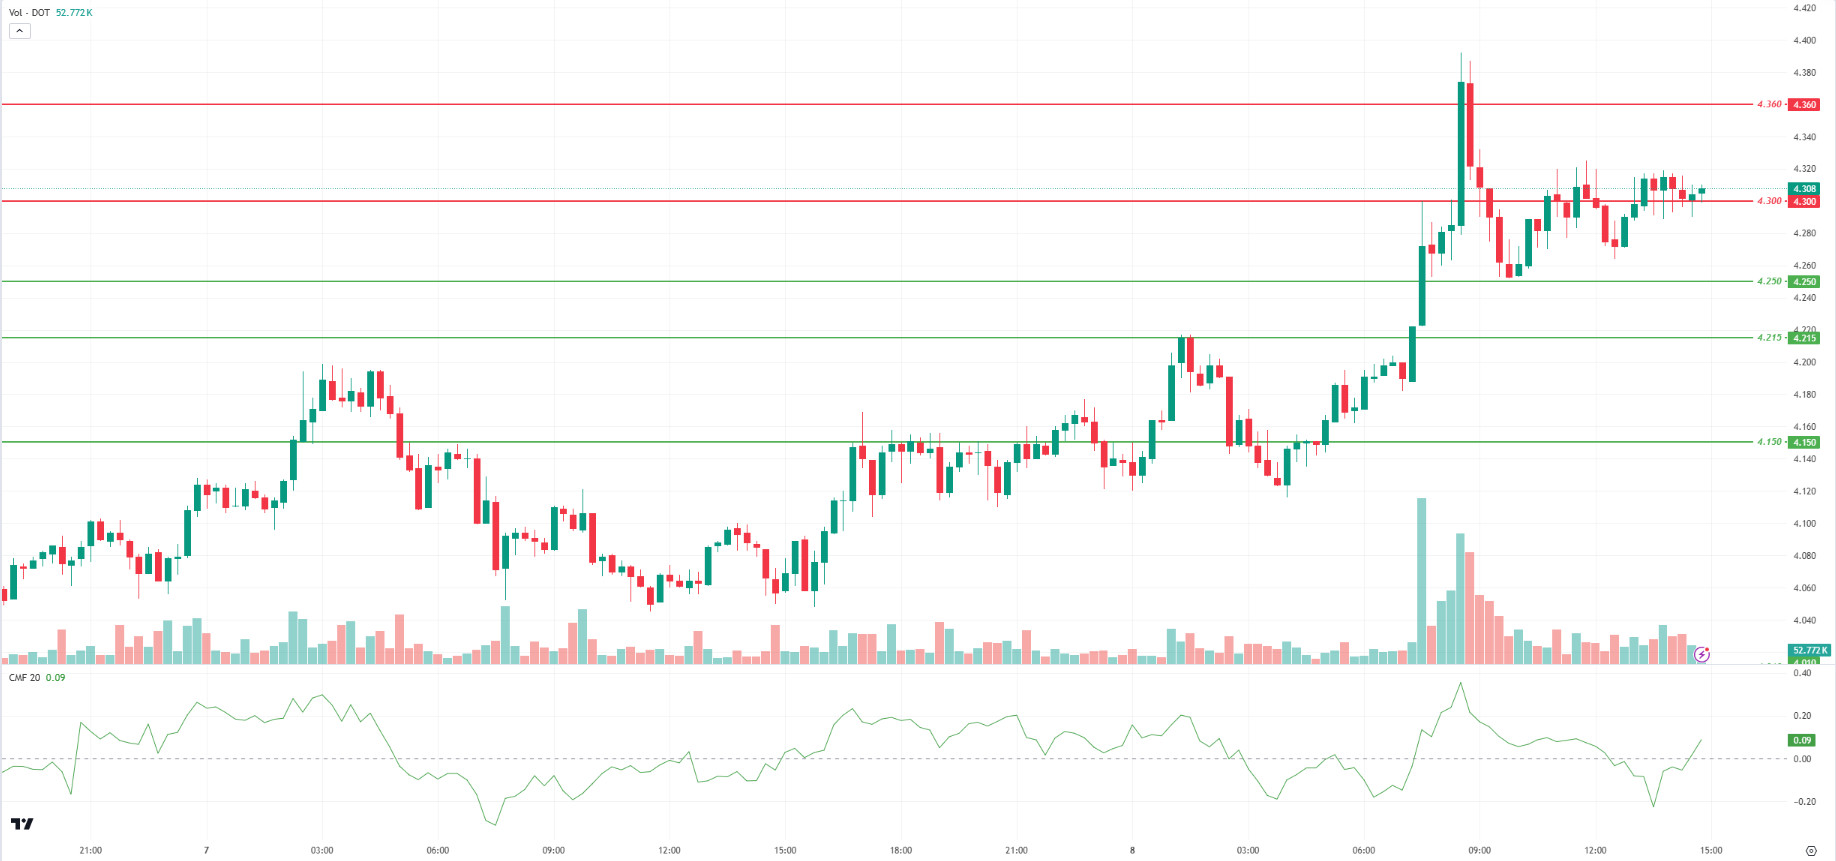
When we examine Polkadot (DOT) technically, the price seems to have risen to the resistance level of 4,360. Reacting from the 4.360 level, the price is hovering at 4.300. When we examine the Chaikin Money Flow (CMF) oscillator, it is in the positive area. In this context, if the price persists above the 4.300 level, we can see a movement towards the 4.360 level. On the other hand, if the price falls below the 4,300 level, it may want to test the 4,250 levels.
Supports 4,250 – 4,215 – 4,150
Resistances 4.300 – 4.360 – 4.430
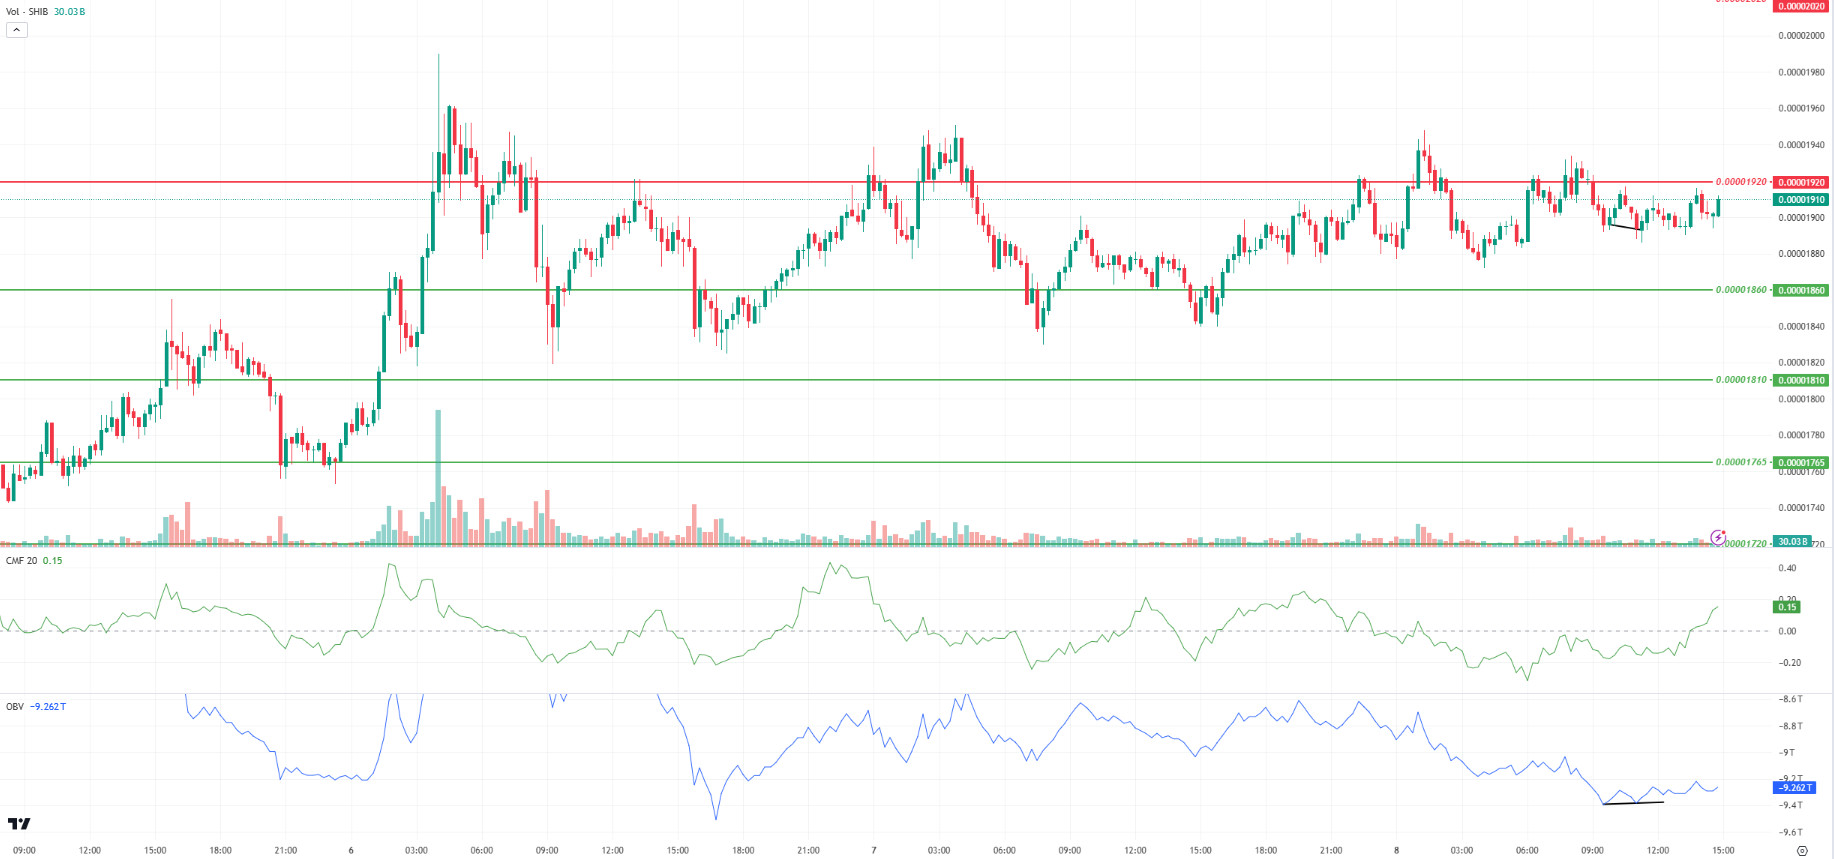
SHIB/USDT
Technically analyzing Shiba Inu (SHIB), we see that the price is trending sideways. Chaikin Money Flow (CMF) oscillator is in positive territory. If the price, which moves upwards after the positive divergence between the On Balance Volume (OBV) oscillator and the price, can break the 0.00001920 resistance level upwards and provide permanence, we can see an uptrend towards the next resistance level of 0.00002020. On the other hand, if the price fails to break the selling pressure at 0.00001920, the price may retreat towards 0.00001860.
Supports 0.00001860 – 0.00001810 – 0.00001765
Resistances 0.00001920 – 0.00002020 – 0.00002065
LEGAL NOTICE
The investment information, comments and recommendations contained herein do not constitute investment advice. Investment advisory services are provided individually by authorized institutions taking into account the risk and return preferences of individuals. The comments and recommendations contained herein are of a general nature. These recommendations may not be suitable for your financial situation and risk and return preferences. Therefore, making an investment decision based solely on the information contained herein may not produce results in line with your expectations.


