
MARKET SUMMARY
Latest Situation in Crypto Asset
| Assets | Last Price | 24h | Dominance | Market Cap |
|---|---|---|---|---|
| BTC | $65,932.00 | 1.84% | 57.04% | $1.30 T |
| ETH | $2,607.00 | 2.20% | 13.75% | $313.84 B |
| SOLANA | $153.68 | 0.54% | 3.16% | $72.13 B |
| XRP | $0.5407 | 0.43% | 1.34% | $30.60 B |
| DOGE | $0.1144 | 1.35% | 0.73% | $16.76 B |
| TRX | $0.1583 | -1.03% | 0.60% | $13.70 B |
| CARDANO | $0.3613 | 2.00% | 0.55% | $12.62 B |
| AVAX | $28.77 | -1.55% | 0.51% | $11.71 B |
| SHIB | $0.0000181 | 0.66% | 0.47% | $10.66 B |
| LINK | $11.51 | 4.44% | 0.32% | $7.23 B |
| DOT | $4.467 | 4.16% | 0.29% | $6.72 B |
*Prepared on 10.15.2024 at 14:00 (UTC)
WHAT’S LEFT BEHIND
Japanese Investment Giant
According to Metaplanet, the company spent 1 billion yen (about $6.7 million) to acquire 106,976 more Bitcoins. Metaplanet paid $62,520 per coin for them. BTC is trading at just over $65,700 at the time of writing, according to CoinGecko.
FTX Solana Lock
New management at FTX has unlocked the Solana wallet once again. The exchange removed 178,631 SOL tokens worth about 30 million dollars from the stake. Last month, a $ 24 million Solana sale was made.
Bitcoin Statement by Fed Member
Minneapolis Fed President Neel Kashkari stated that Bitcoin is still not considered a valuable asset. It was emphasized that the upcoming US elections could have a serious impact on Bitcoin prices. Bitcoin’s performance is carefully monitored by investors, especially with the interest in ETFs.
HIGHLIGHTS OF THE DAY
Important Economic Calendar Data
| Time | News | Expectation | Previous |
|---|---|---|---|
| 15:30 | USFOMC Member Daly Speaks | ||
| 17:00 | USFOMC Member Kugler Speaks |
INFORMATION
*The calendar is based on UTC (Coordinated Universal Time) time zone. The economic calendar content on the relevant page is obtained from reliable news and data providers. The news in the economic calendar content, the date and time of the announcement of the news, possible changes in the previous, expectations and announced figures are made by the data provider institutions. Darkex cannot be held responsible for possible changes that may arise from similar situations.
MARKET COMPASS
The rally in digital assets, which started late last week, came to a halt during Asian and European trading today. US futures point to a slightly negative opening after European stock markets showed a mixed picture with rises and falls. While the dollar continued to hold on to its gains, the yield on US 10-year yields fell slightly today in the bond market, which was closed yesterday in the country.
In addition to China’s stimulus agenda, which is a decisive dynamic in asset prices, investors are following the balance sheet season that started with the financials of major banks on the US front. Goldman Sachs, Bank of America and Citigroup results exceeded forecasts. Empire State Manufacturing Index declined more than forecasts. In addition, as the presidential election approaches, the statements of the candidates are also evaluated. Finally, Harris’ regulatory, not restrictive, approach to crypto assets attracted attention. For this front, inflows in ETFs were also important.
While the hope that tensions in the Middle East may not escalate (for now) and the markets and asset prices adapting to the US Federal Reserve’s interest rate cut course have moved away from finding direction with these two variables, for digital assets, the reduced fear that investors will fund the (spoken) opportunity in Chinese equities by selling digital assets has been an important equation. Accordingly, while we maintain our view that the long-term direction is up, we continue to think that the potential for a short-term pullback is on the table. However, we do not ignore that if the major crypto assets, which continue to hold on to their recent gains, continue to maintain this course, the potential for a downward correction may gradually diminish.
TECHNICAL ANALYSIS
BTC/USDT
The Bitcoin wind continues to blow on the first day of the week. The election enthusiasm on the US side has turned Bitcoin into an election campaign. Kamala Harris taking steps in this direction against D.Trump causes us to experience a rally in Bitcoin price. The fact that institutions accompany Bitcoin funds in the cutthroat race is another factor that reinforces the rise.
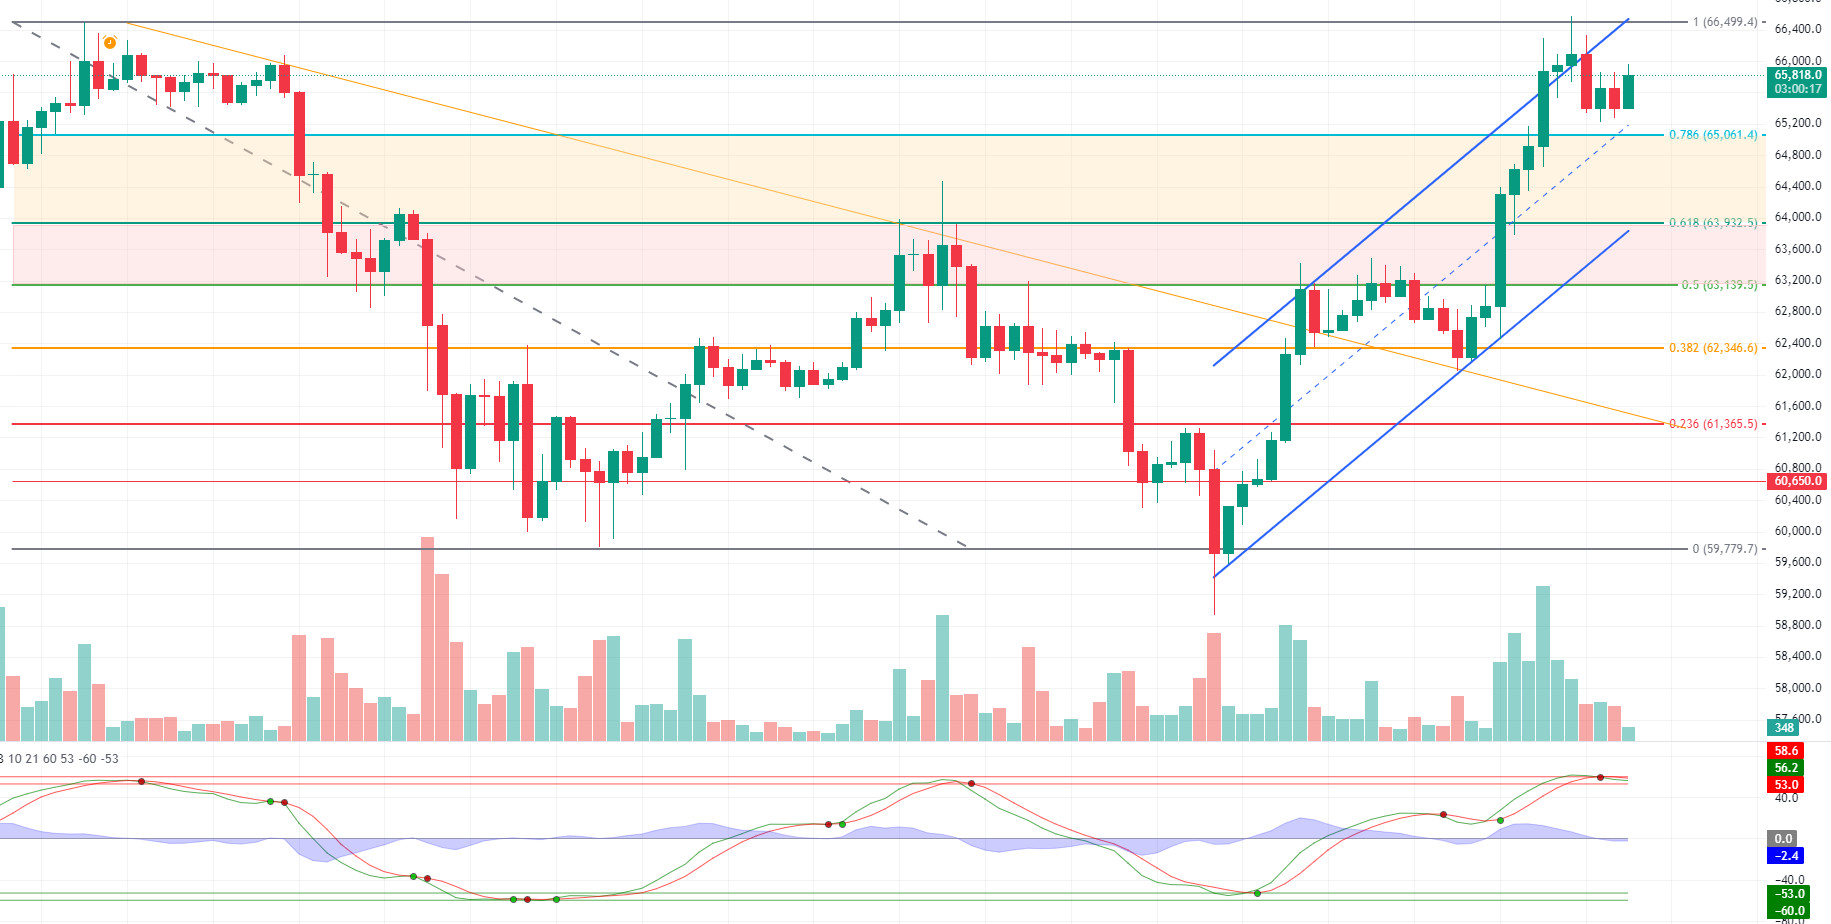
BTC continues to push the fibonacci resistance level of 0.786 (65,061) in the 4-hour technical analysis. BTC, which we observed preparing for a correction before the US market opened, displayed an upward attack again with the positive opening of the US opening session. With momentum weakening, our technical indicators are moving in the overbought zone hourly, which could trigger a possible correction. The support level we will follow in case of a pullback will be 0.618 (63.932).
Supports 63,932 – 63,139 – 62,346
Resistances 65,061 – 66,076 – 67,000
ETH/USDT
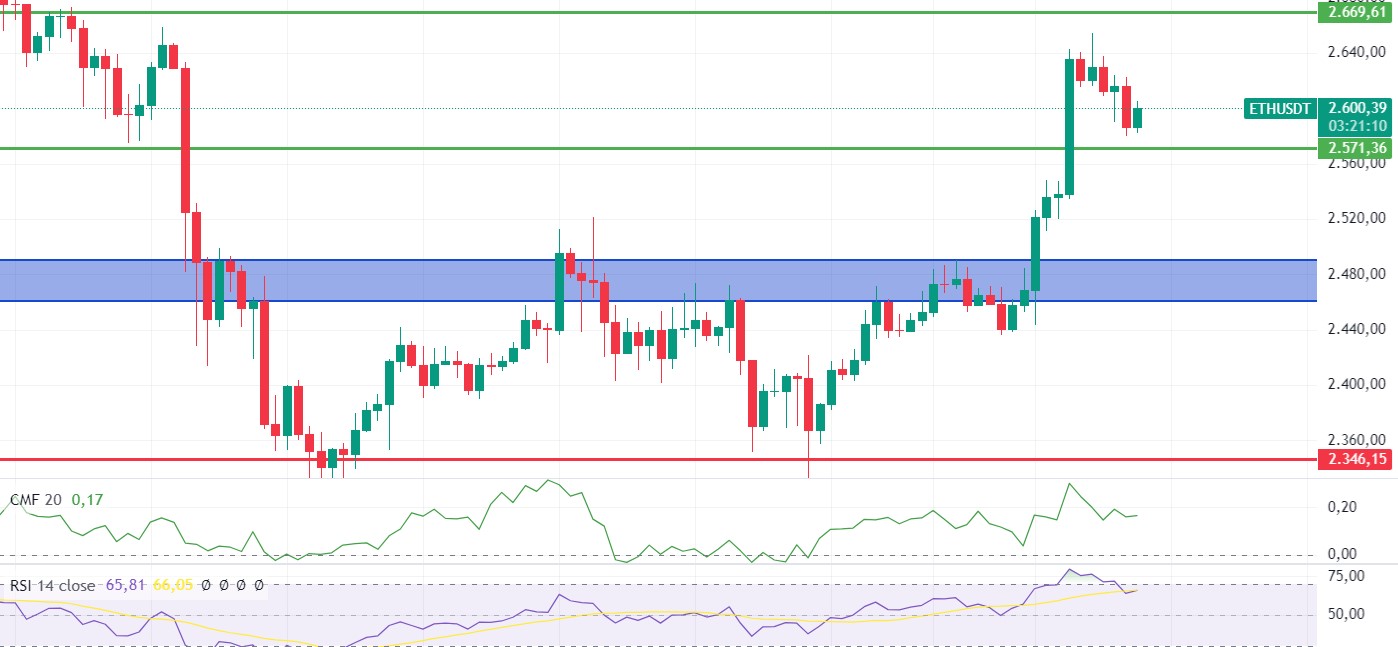
Although Ethereum fell close to the 2,571 level targeted by the morning analysis, futures are trying to hold on to the 2,600 level again with purchases from the channel. RSI and CMF are converging to a positive outlook again. Looking at the open interest, we see a slight increase in positions. However, both the stagnation in spot volume and the negative outlook on MFI indicate that the decline may continue. A test to 2,571 levels may be seen again during the day. Below this level, the decline may deepen. In order to maintain the positive trend, the most important resistance level of 2.669 needs to be broken with volume. With the break of this level, it seems likely that the rises will continue aggressively.
Supports 2,571 – 2,490 – 2,460
Resistances 2,669 – 2,731 – 2,815
LINK/USDT
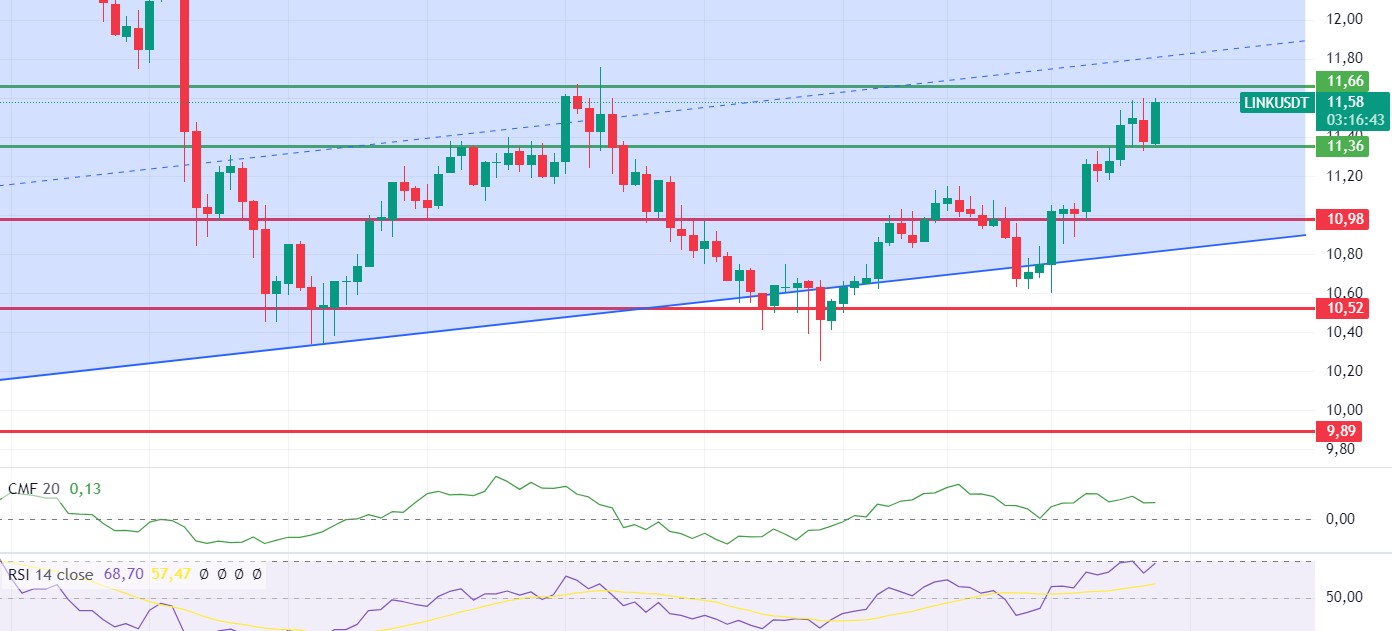
LINK, which fell to 11.36 support with the decline in the morning hours, is pushing 11.66 resistance again with the reaction it received from here. As the RSI approaches the overbought zone, we see horizontal movement on CMF. In this context, it can be said that the horizontal movement between 11.36 – 11.66 levels may continue for a while. However, the voluminous break of the 11.66 level may bring rises up to the middle band of the rising channel, while the break of the 11.36 level may bring declines back to 10.98 support.
Supports 11.36 – 10.98 – 10.52
Resistances 11.66 – 12.26 – 12.71
SOL/USDT
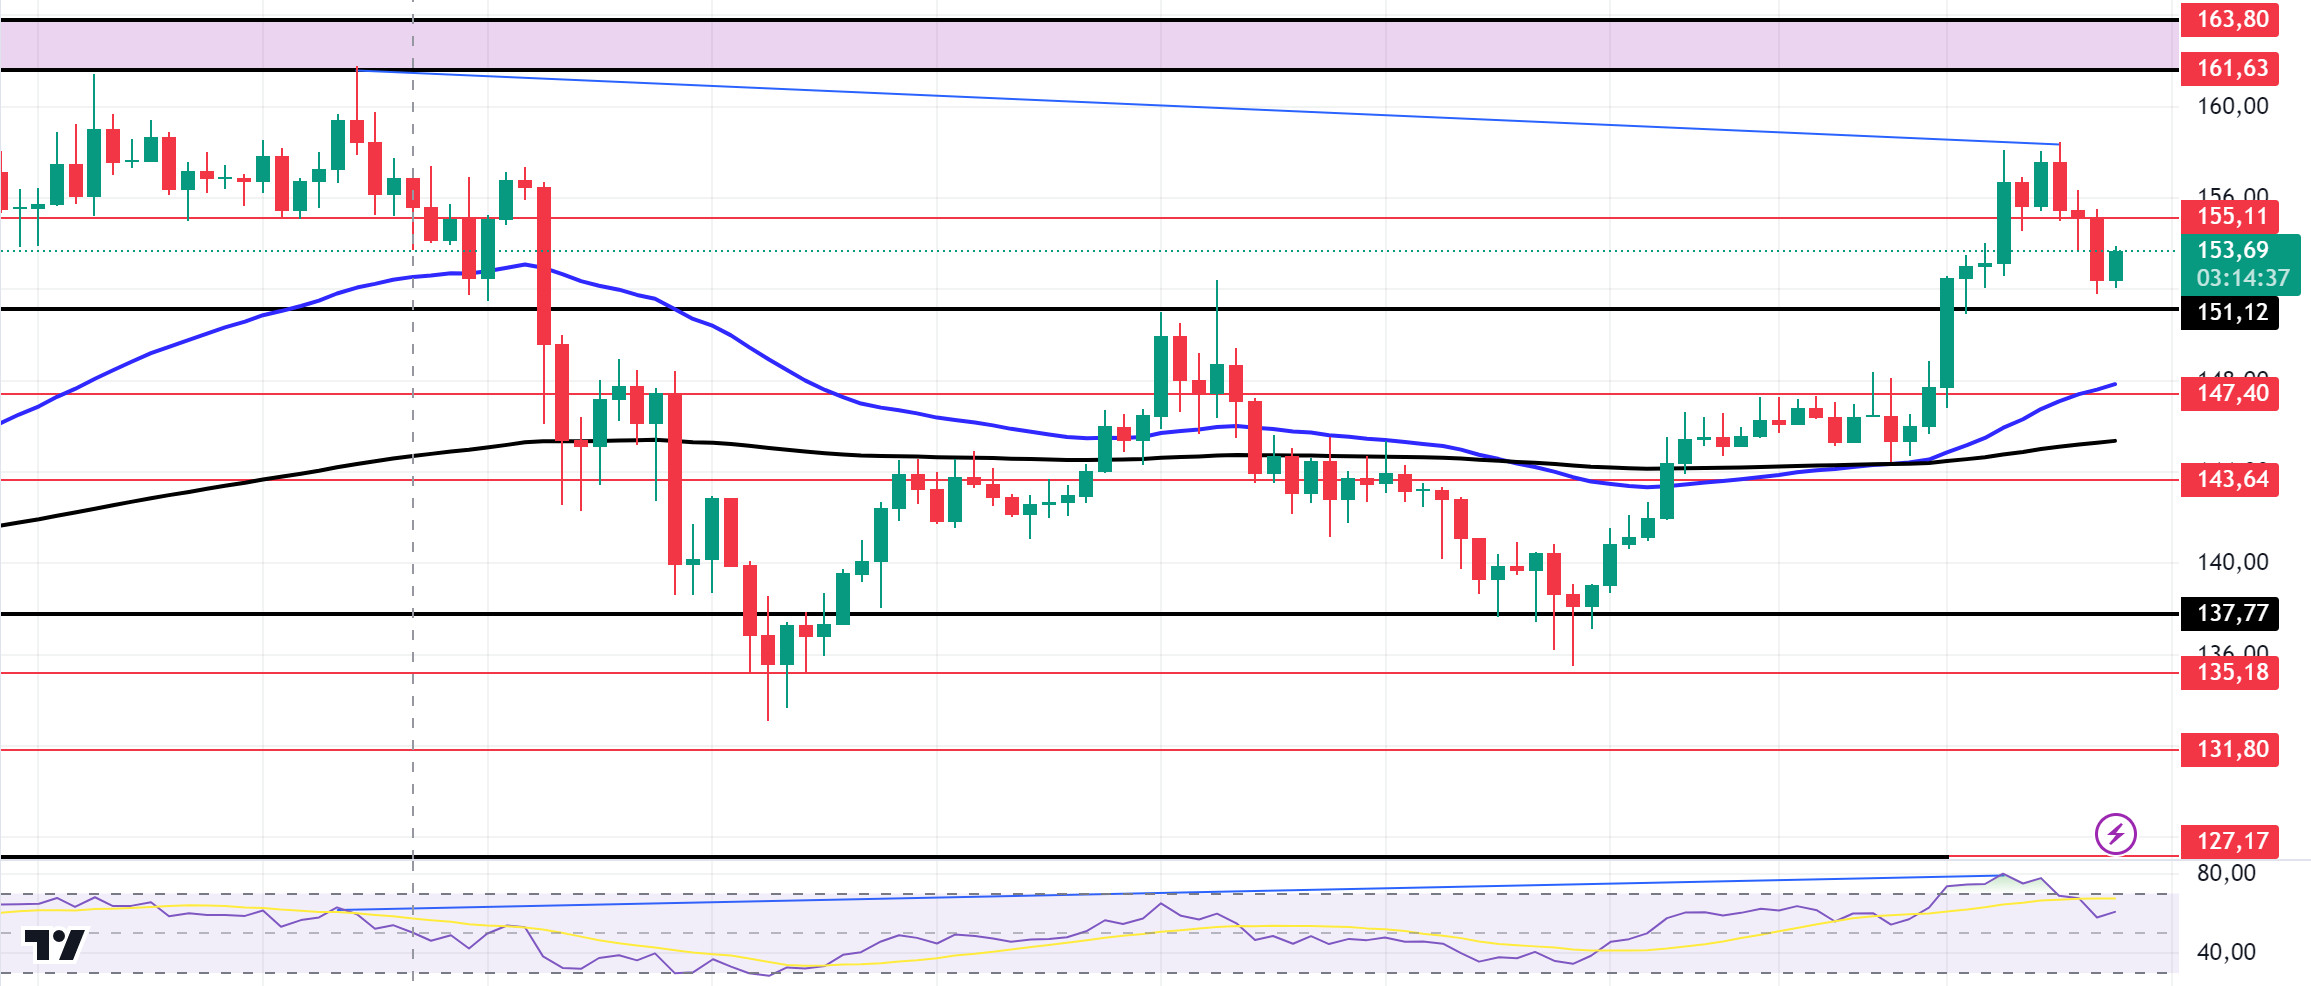
A wallet owned by FTX and its sister company Alameda Research has withdrawn 178,631 Solana (SOL) tokens from the Solana Proof-of-Stake (PoS) network. This transaction is worth approximately $28 million and there is talk in the crypto community that these tokens will be transferred to centralized exchanges. With this news, SOL slightly lost value, but recovered in a short time. On the 4-hour timeframe, the 50 EMA continues to be above the 200 EMA. This may mean that the rise will continue. It decisively broke the 151.12 level, an important resistance. This means that it could test the 163.80 level, the ceiling level of the band where it has been consolidating for a long time. When we look at our RSI (14) indicator, there is a mismatch. This could lead to profit taking and, technically, to a sell-off as traders consider a possible pullback. The 161.63 level is a very strong resistance point in the uptrend driven by both macroeconomic conditions and innovations in the Solana ecosystem. If it rises above this level, the rise may continue strongly. In the sales that investors will make due to profit sales, the support level of 151.12 – 147.40, which is the place of retreat, should be followed. If the price comes to these support levels, a potential bullish opportunity may arise.
Supports 151.12 – 147.40 – 143.64
Resistances 155.11 – 161.63 – 163.80
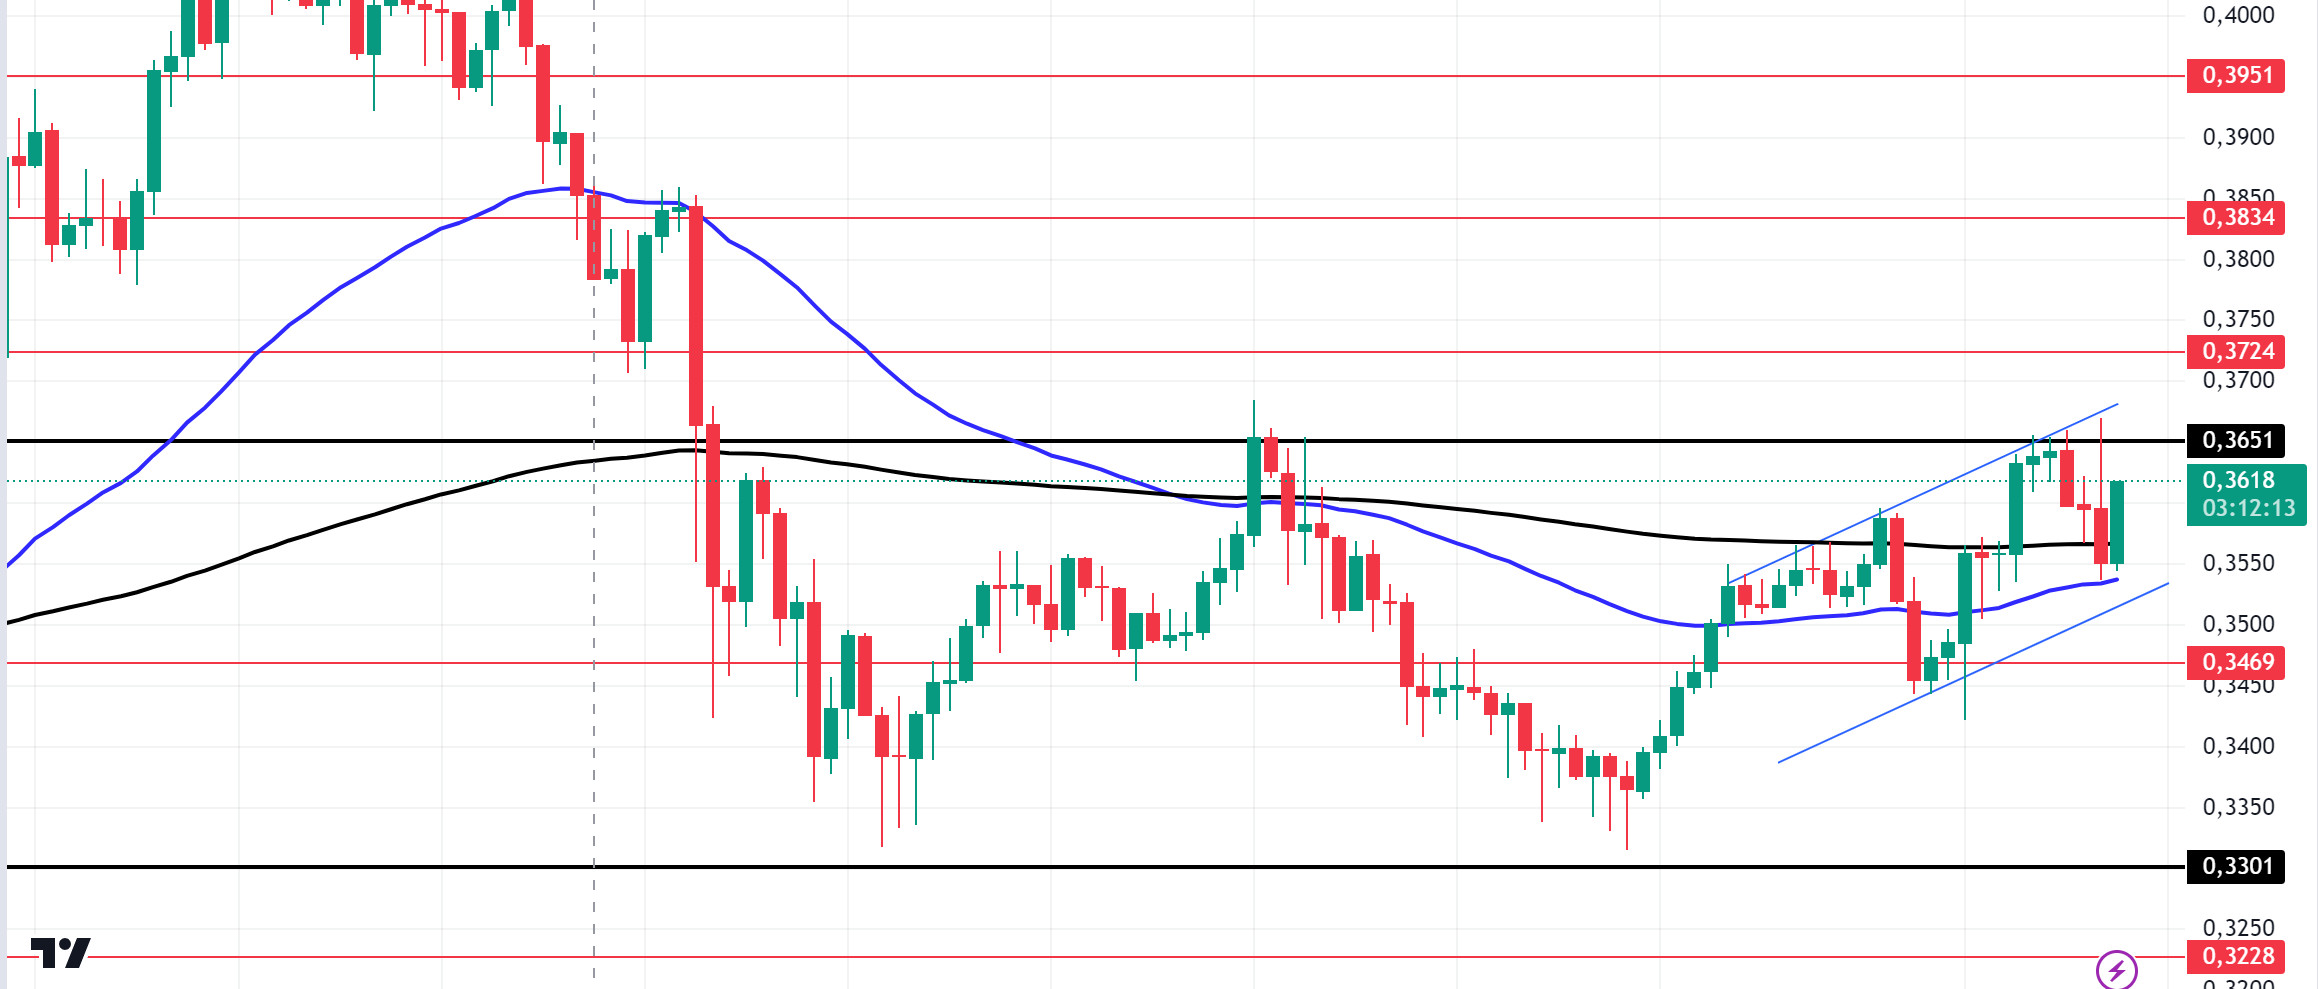
ADA/USDT
ADA tested the critical resistance level of 0.3651 and retreated slightly from that level. On the 4-hour chart, the downtrend that started on September 27 was broken by whale movements and seems to have received support from the downtrend level. This could be a bullish sign. On the other hand, the 50 EMA continues to hover below the 200 EMA. The 50 EMA has supported the price. More signals may be needed for a rise. If macroeconomic data is positive for cryptocurrencies, it will retest the 0.3651 resistance level. If the money flow decreases and macroeconomic data is negative for cryptocurrencies, 0.3469 is a support level and can be followed as a good buying place.
Supports 0.3469 – 0.3301 – 0.3228
Resistances 0.3651 – 0.3724 – 0.3834
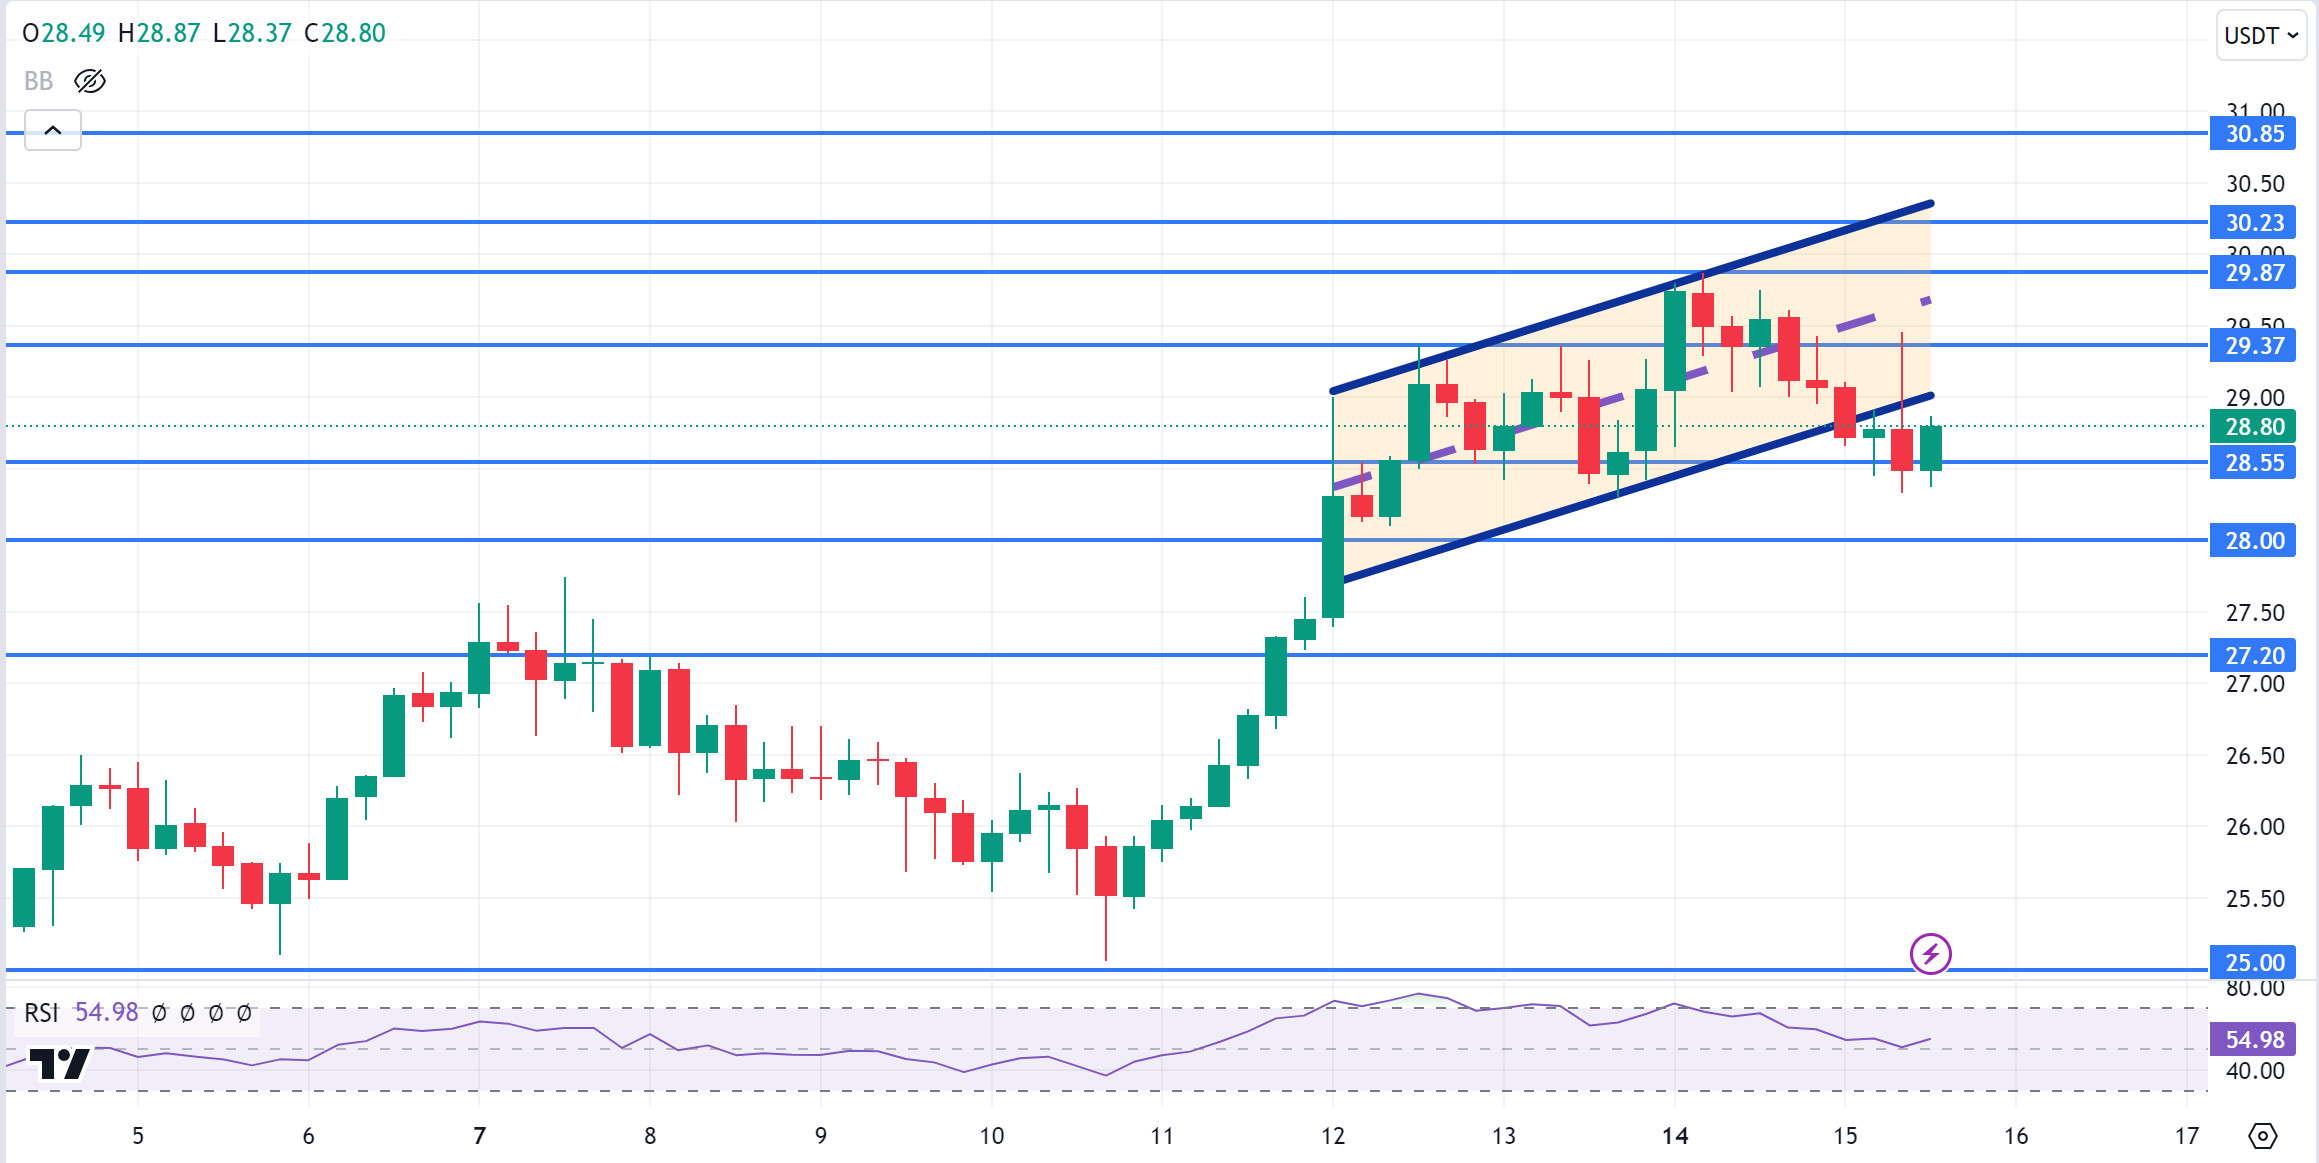
AVAX/USDT
AVAX, which opened today at 29.07, is trading at 28.80, down about 1% during the day. Today, there is no planned data to be announced especially by the US and expected to affect the market. For this reason, it may be a low-volume day where we may see limited movements. News flows from the Middle East will be important for the market.
On the 4-hour chart, it moves in the lower band of the rising channel. It is trying to break the channel downwards and in order to get confirmation that this break has occurred, it needs to close the candle below the support of 28.55. With the RSI 54 value, it can be expected to rise from here and move to the middle band. In such a case, it may test 29.37 resistance. Sales may increase in case of negative news about the increasing tension in the Middle East. In such a case, it may test 28.00 support. As long as it stays above 25.00 support during the day, the desire to rise may continue. With the break of 25.00 support, sales may increase.
Supports 28.55 – 28.00 – 27.20
Resistances 29.37 – 29.87 – 30.23
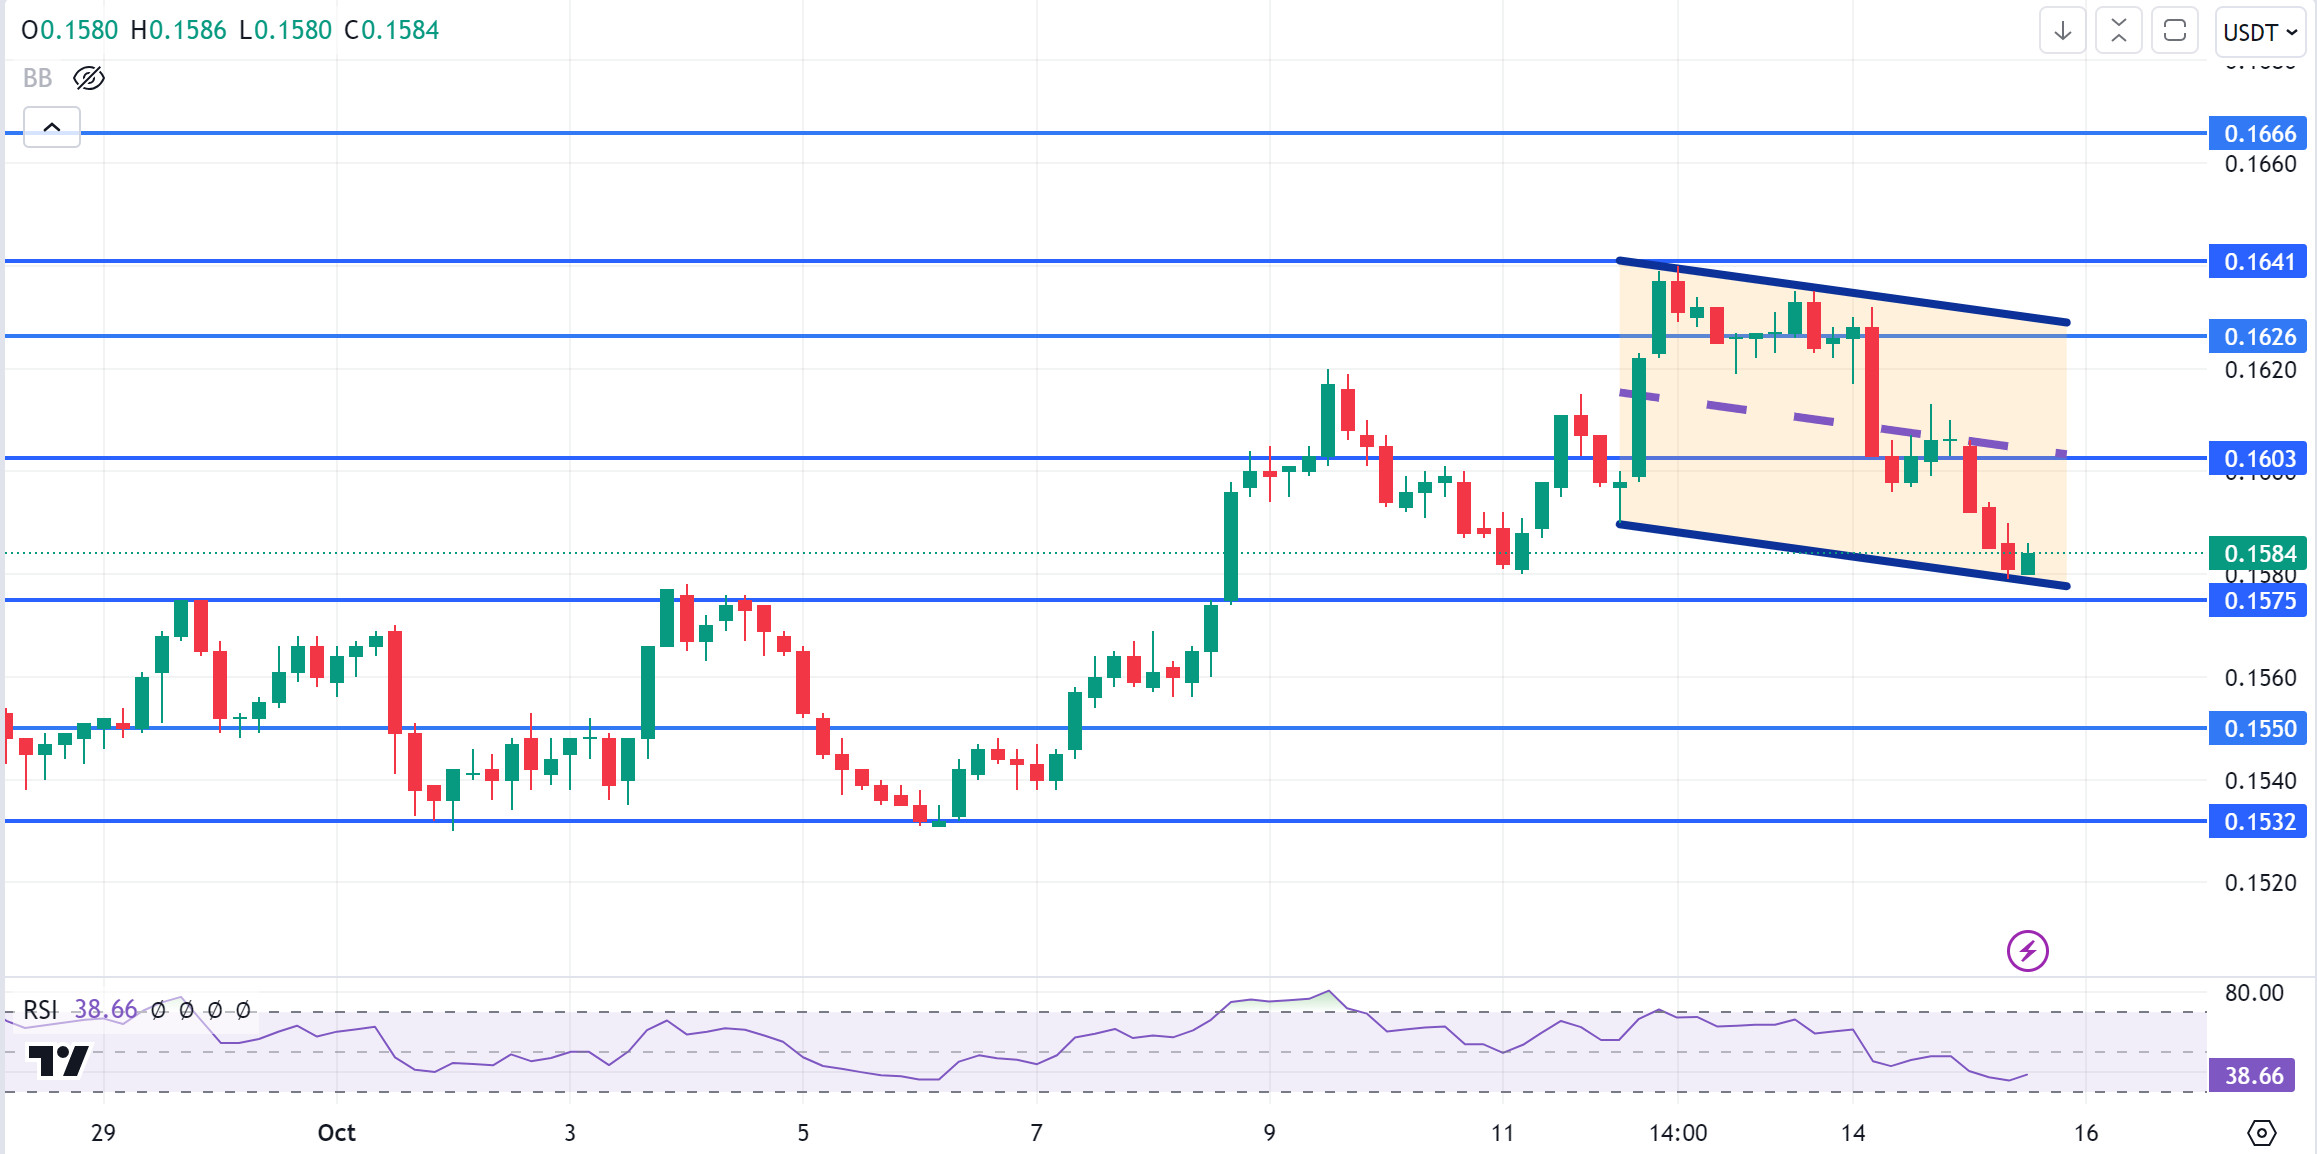
TRX/USDT
TRX, which started today at 0.1605, is trading at 0.1583, down about 1.5% during the day. There is no scheduled data for the market today. The market will be closely following the news flows regarding the tension in the Middle East.
On the 4-hour chart, it moves within the falling channel. It is in the lower band of the falling channel and has approached the oversold zone with an RSI value of 37. It can be expected to rise slightly from its current level. In such a case, it may move to the middle band of the channel and test the 0.1603 resistance. However, if it cannot close the candle above 0.1603 resistance, it may test 0.1575 support with the selling pressure that may occur. As long as TRX stays above 0.1482 support, the desire to rise may continue. If this support is broken downwards, sales can be expected to increase.
Supports 0.1575 – 0.1550 – 0.1532
Resistances 0.1603 – 0.1626 – 0.1641
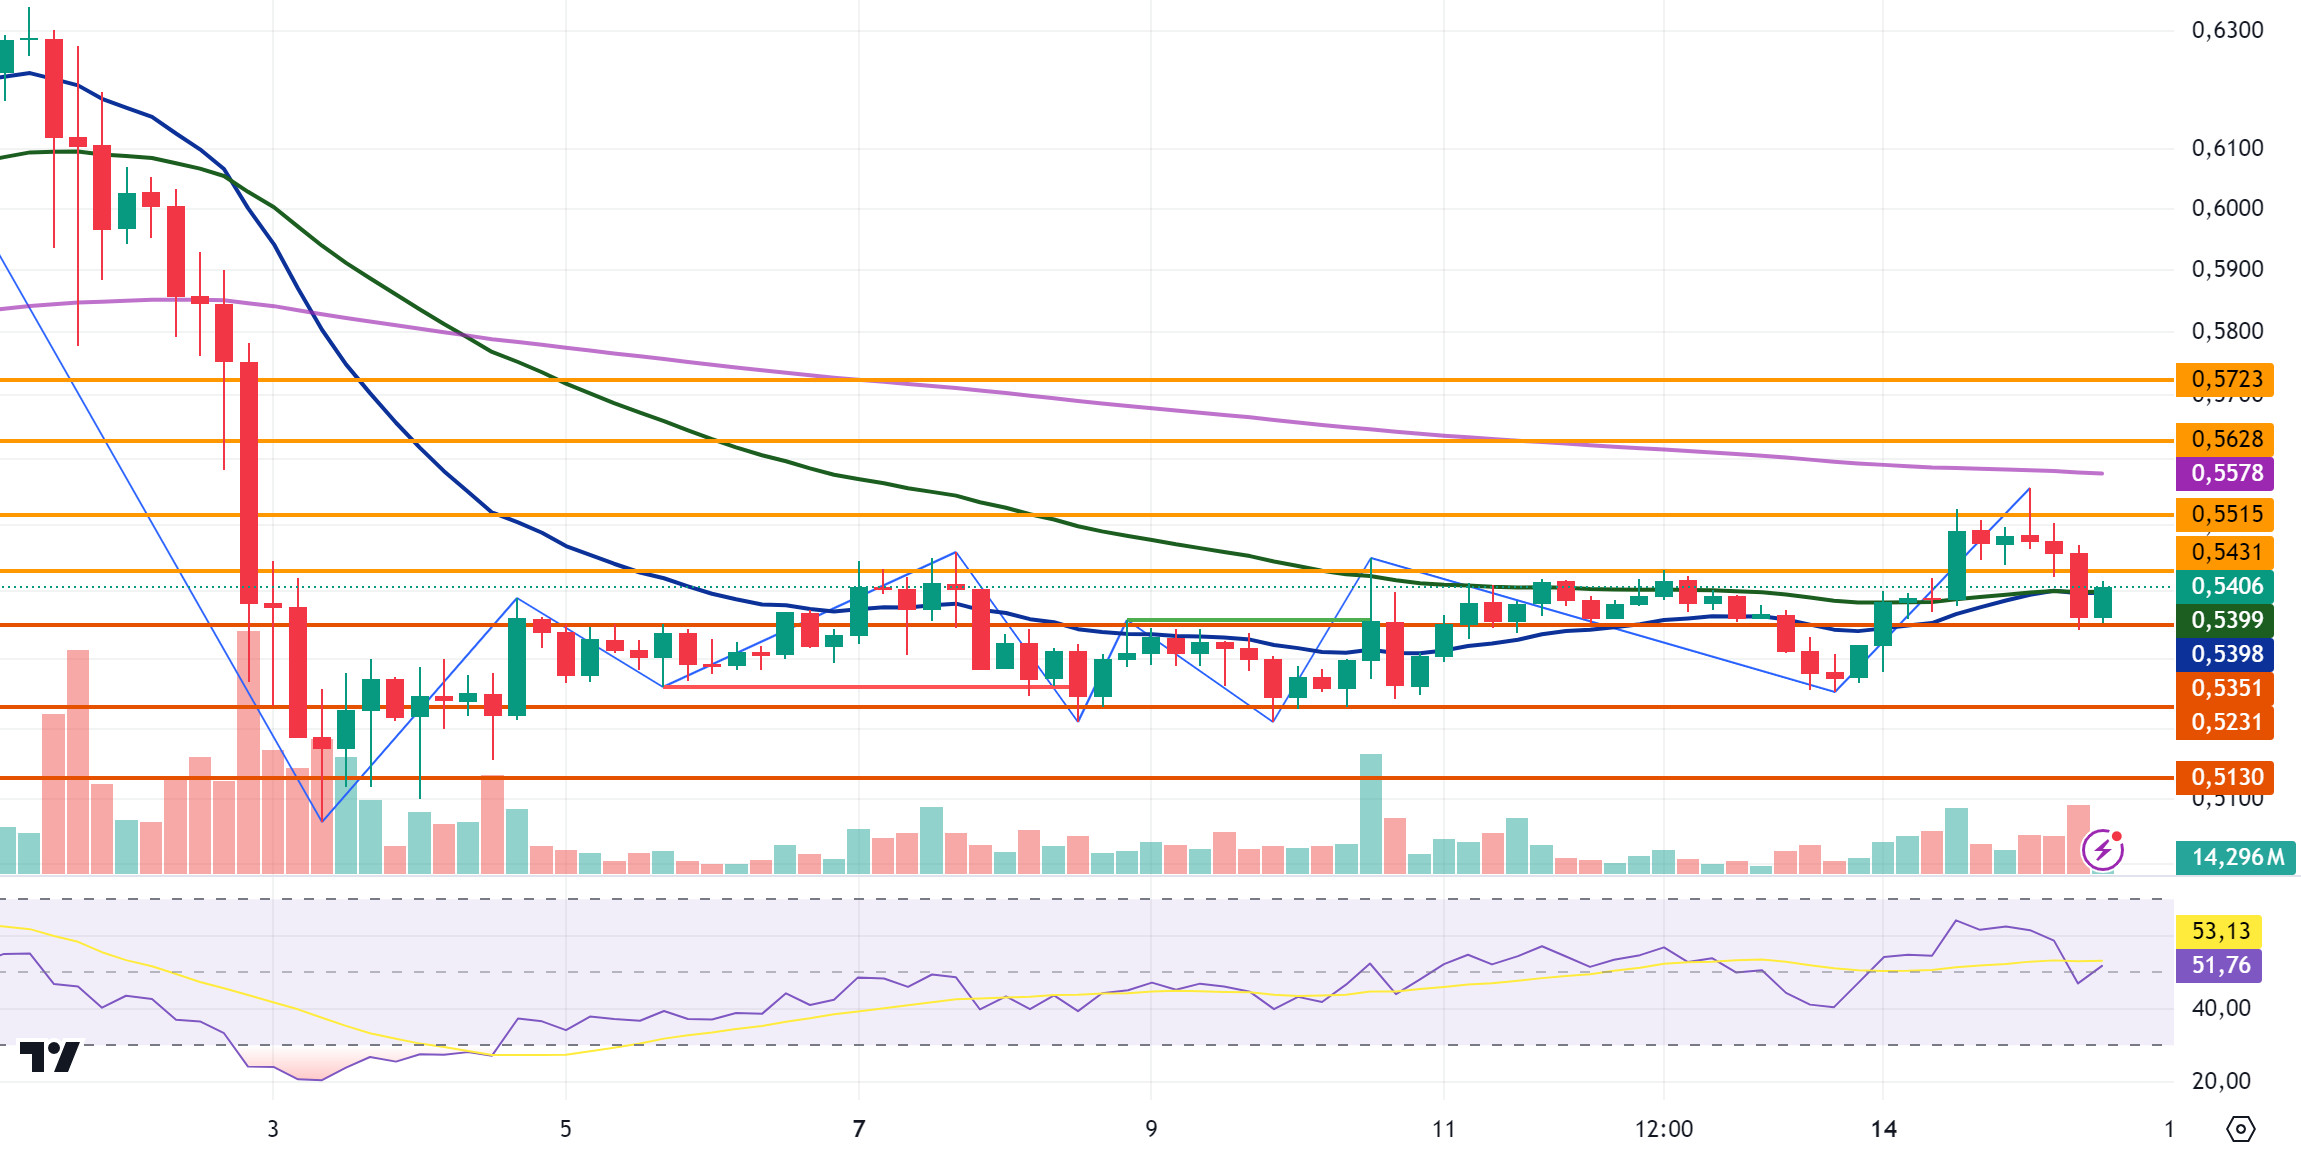
XRP/USDT
XRP rose as high as 0.5555 on the opening candle in the 4-hour analysis today, then fell with the incoming sales and fell to the 0.5351 support level. XRP started to rise after testing and failing to break the 0.5351 support level in its decline. XRP is currently trading at 0.5406. XRP is testing the EMA20 and EMA50 levels with its rise. After the rise continues and the EMA20 and EMA50 levels are broken, XRP may test the resistance levels of 0.5431-0.5515-0.5628 in the continuation of the rise. After the EMA20 and EMA50 levels cannot be broken upwards, it may test the support levels of 0.5351-0.5231-0.5130 if it declines with the selling pressure that may occur below the EMA levels.
XRP may decline on its rise with possible sales at 0.55 with EMA200 and may offer a short trading opportunity. In its decline, it may rise with possible purchases at 0.53 and may offer a long trading opportunity.
EMA20 (Blue Line) – EMA50 (Green Line) – EMA200 (Purple Line)
Supports 0.5351 – 0.5231 – 0.5130
Resistances 0.5431 – 0.5515 – 0.5628
DOGE/USDT
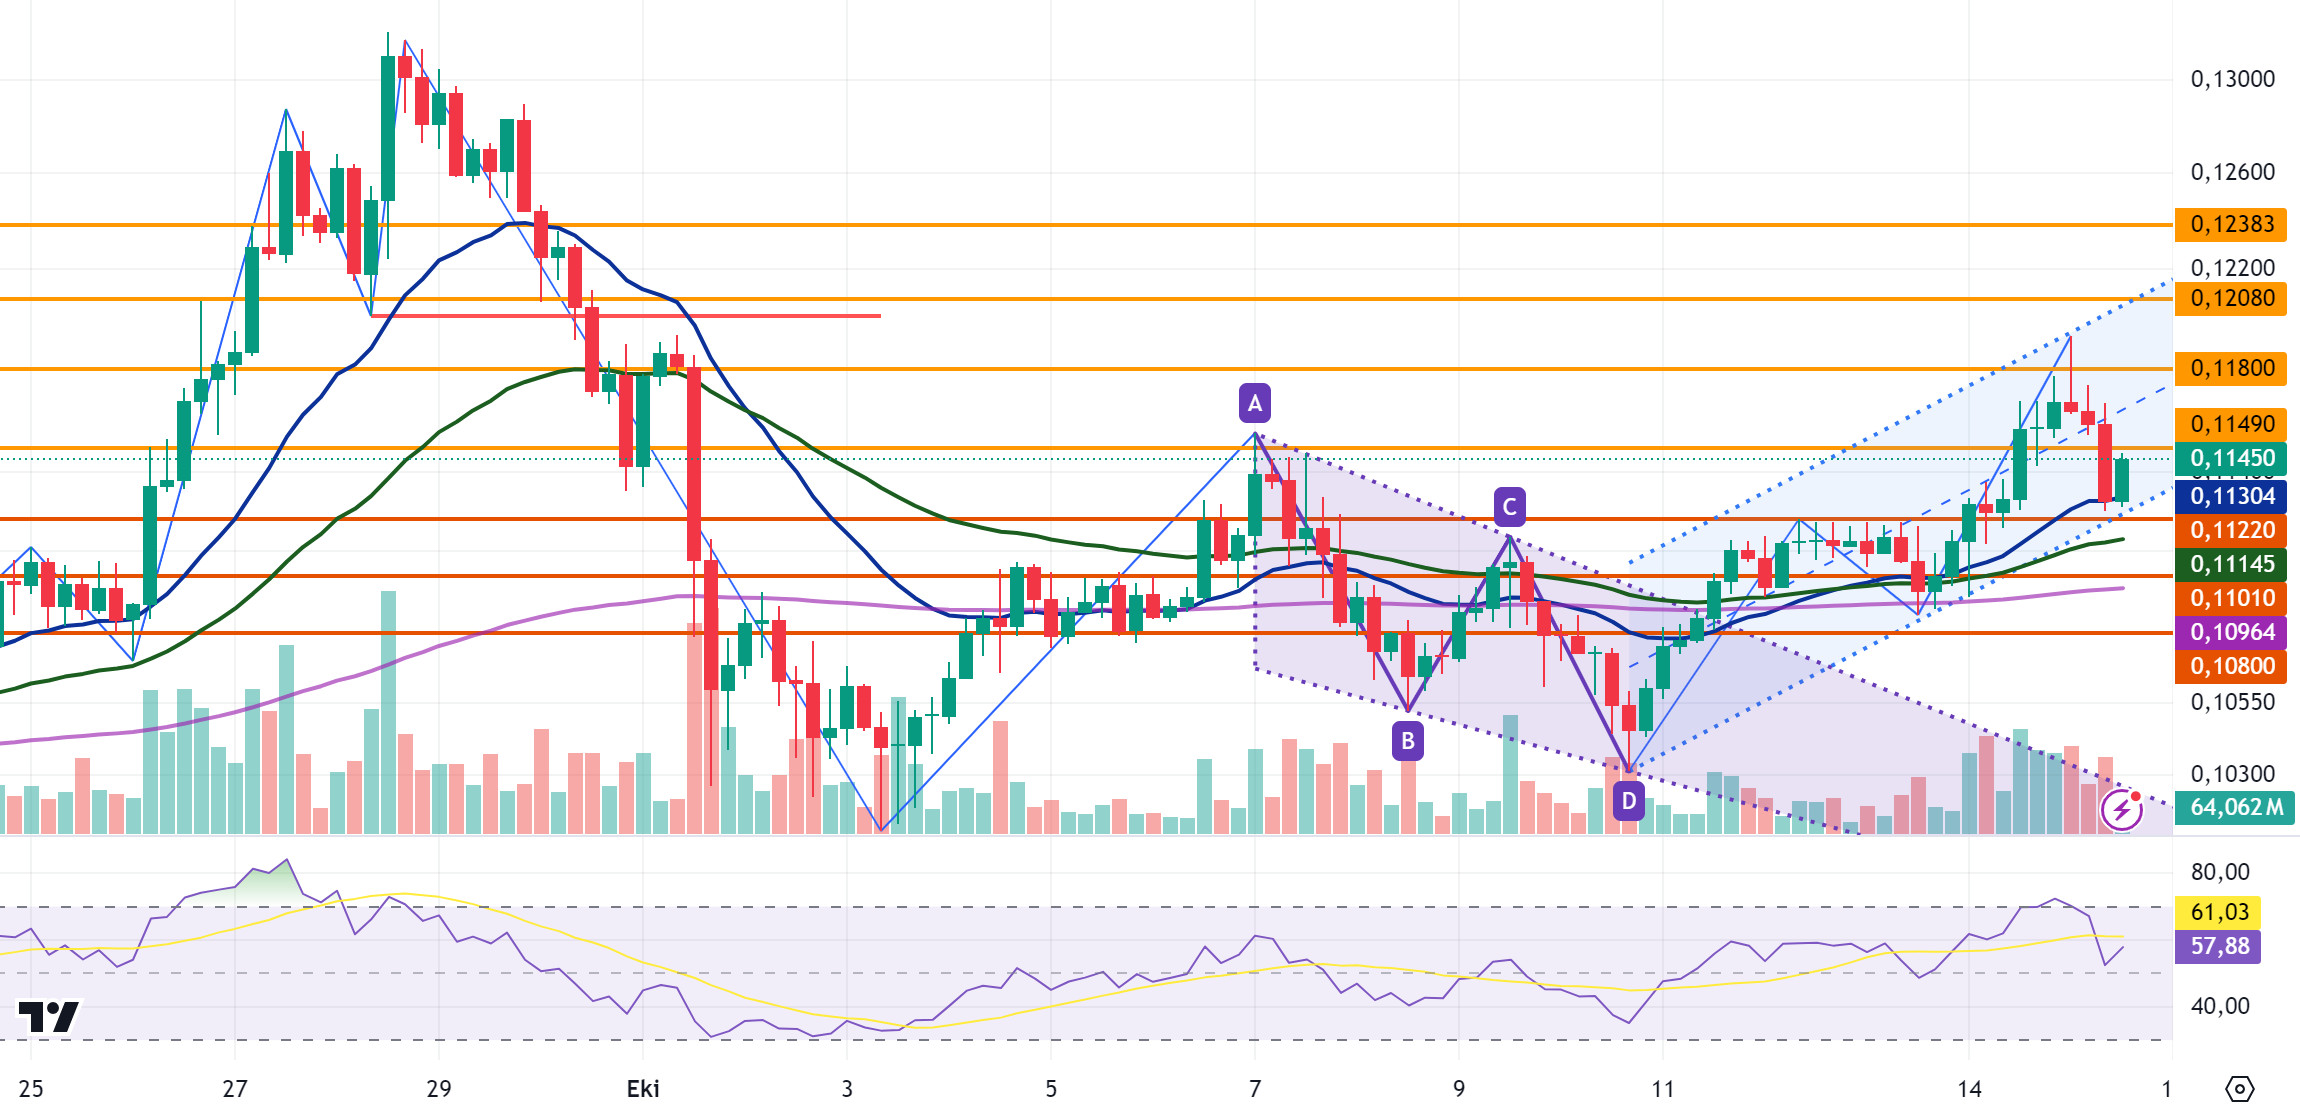
After starting at 0.1166 today, DOGE rose as high as 0.1193. DOGE, which fell with the sales at the upper limit of the ascending channel, tested the EMA20 level in its decline and could not break it and started to rise again. DOGE is currently trading at 0.1145. DOGE, which is traded above the EMA levels, may test the resistance levels of DOGE 0.1149-0.1180-0.1208 as it continues to rise with purchases. In case of a decline with possible negative developments, it may test 0.1122-0.1101-0.1080 support levels.
DOGE, which is in the ascending channel, may decline with possible sales at 0.12 and may offer a short trading opportunity. In case of a decline, it may rise with purchases at EMA20 and 0.1122 and may offer a long trading opportunity.
(Blue Line) – EMA50 (Green Line) – EMA200 (Purple Line)
Supports 0.1122 – 0.1101 – 0.1080
Resistances 0.1149 – 0.1180 – 0.1208
DOT/USDT
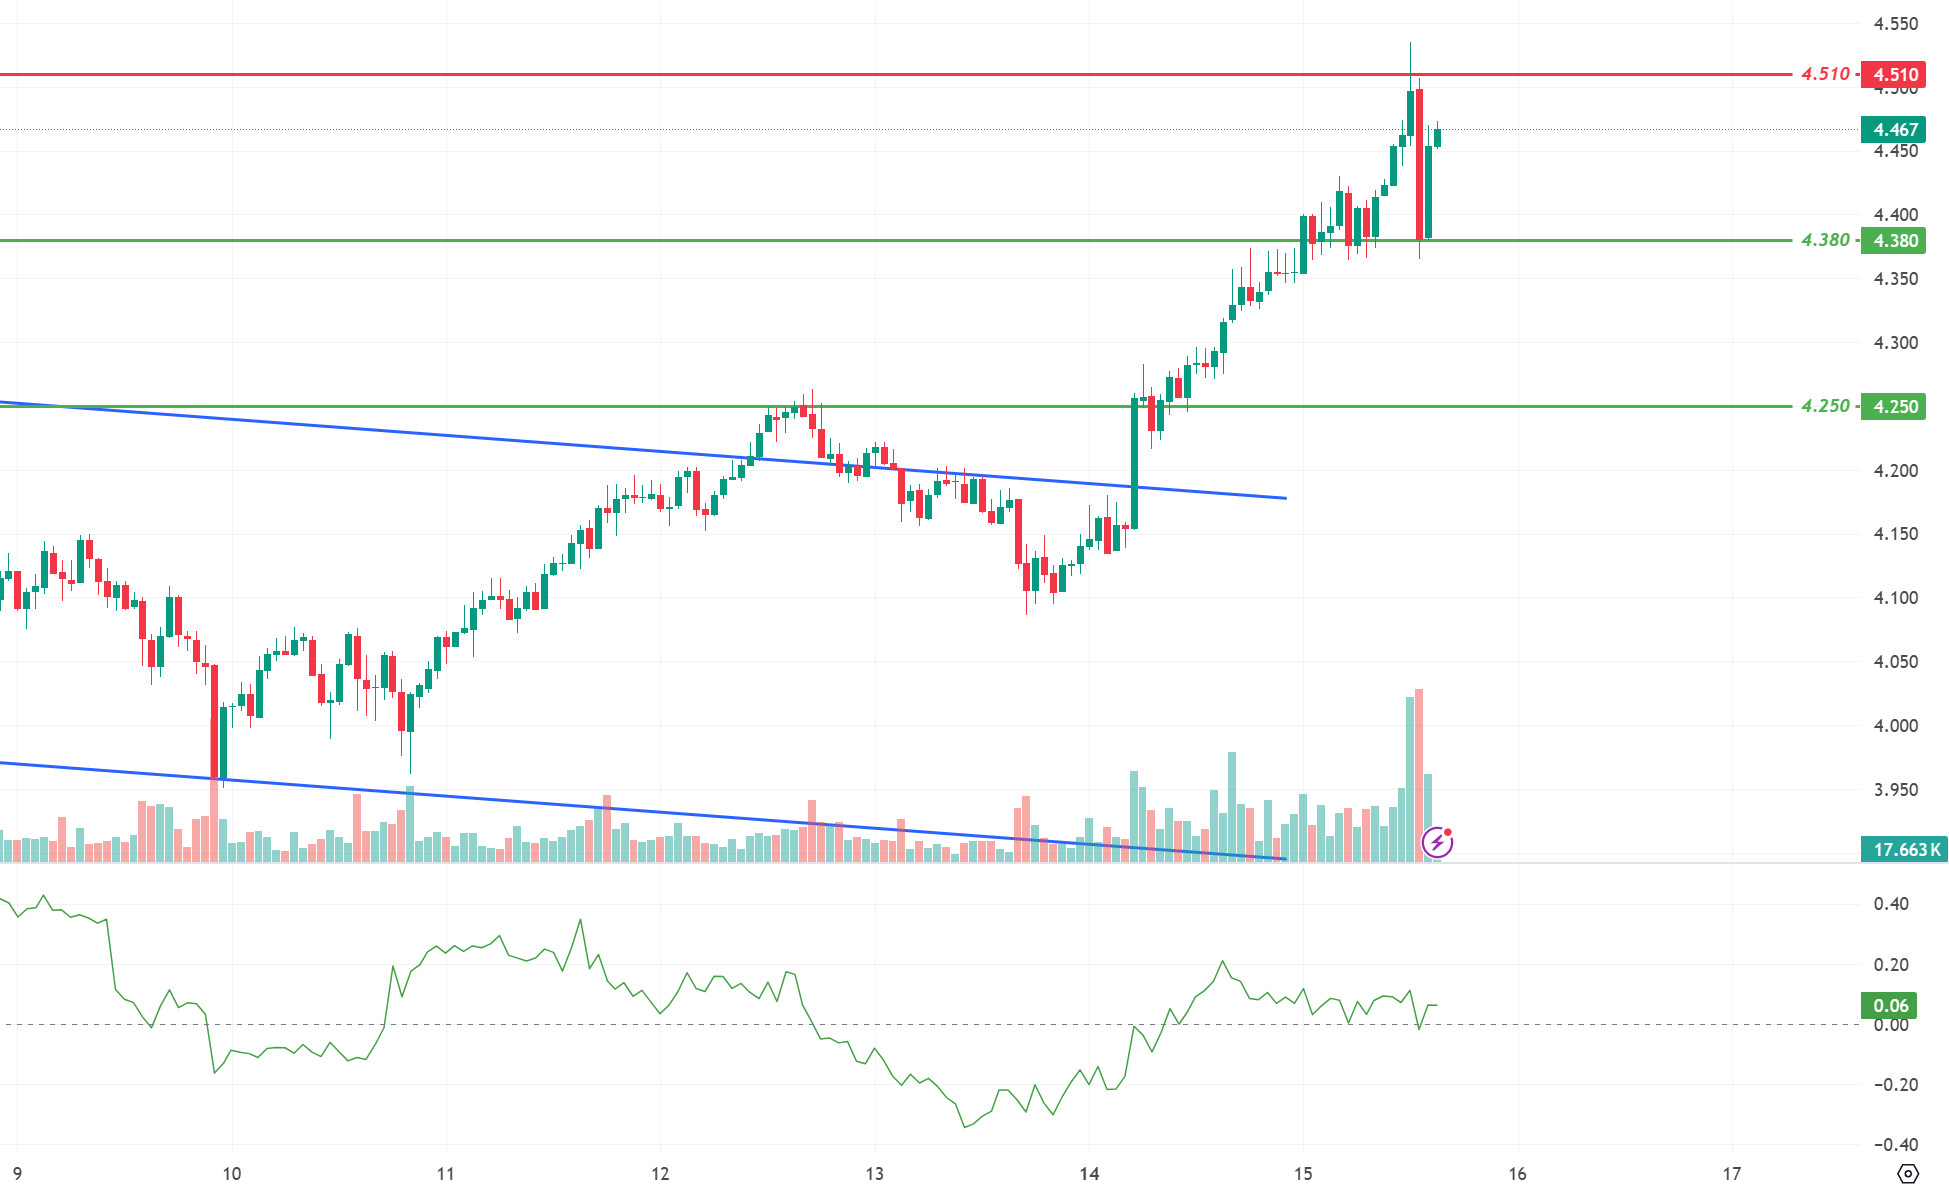
Polkadot (DOT) rose up to the 4.510 resistance level. DOT, which fell sharply with the reaction from the 4.510 level, continues its upward movement with the reaction from the 4.380 support level. According to the CMF oscillator, we can say that the buyer pressure is stronger. The price may want to test the 4.510 resistance level again with the reaction from 4.380 levels. On the other hand, if the selling pressure at the 4.510 level cannot be broken, the price may fall to the 4.380 band.
Supports 4.380 – 4.250 – 4.165
Resistances 4.450 – 4.510 – 4.655
SHIB/USDT
Shiba Inu (SHIB) continues to fall with increasing selling pressure at the 0.00001900 resistance level. According to the CMF oscillator, we can say that the selling pressure continues to be strong. If the price persists below the 0.00001810 level, we may see a movement towards the next support level of 0.00001765. On the other hand, if the price persists above the 0.00001810 support level as the selling pressure decreases, its next move may be towards the 0.00001865 resistance level.
Supports 0.00001810 – 0.00001765 – 0.00001690
Resistances 0.00001865 – 0.00001900 – 0.00001950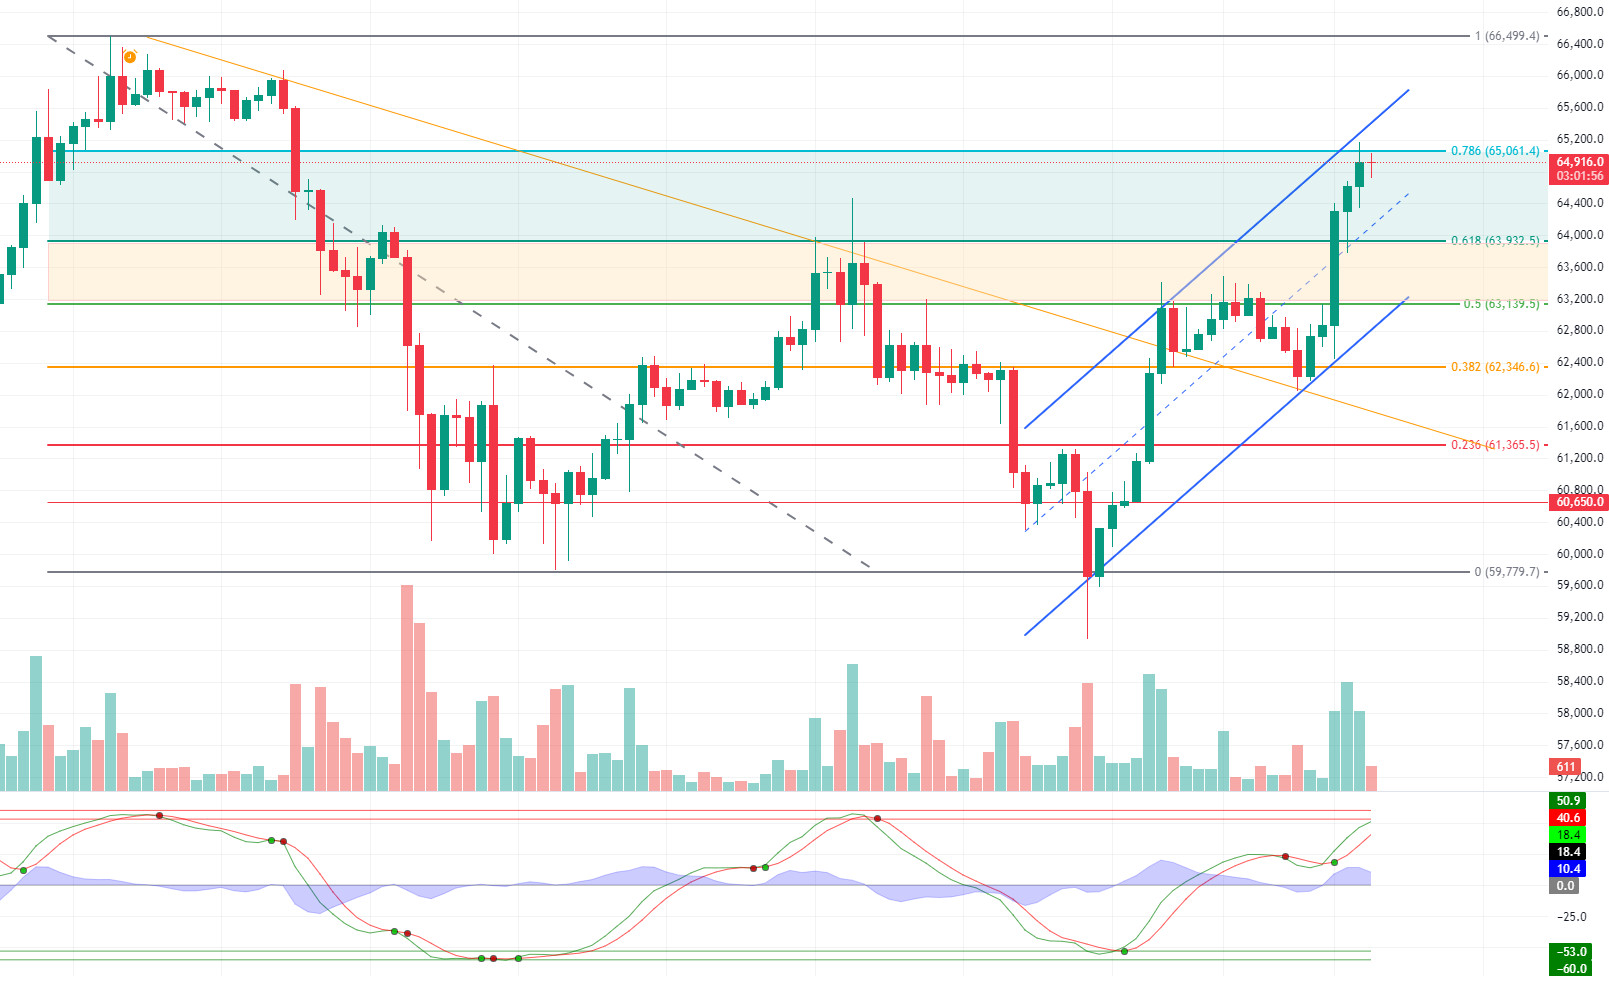
LEGAL NOTICE
he investment information, comments and recommendations contained herein do not constitute investment advice. Investment advisory services are provided individually by authorized institutions taking into account the risk and return preferences of individuals. The comments and recommendations contained herein are of a general nature. These recommendations may not be suitable for your financial situation and risk and return preferences. Therefore, making an investment decision based solely on the information contained herein may not produce results in line with your expectations.
