MARKET SUMMARY
Latest Situation in Crypto Assets
| Assets | Last Price | 24h Change | Dominance | Market Cap. |
|---|---|---|---|---|
| BTC | 71,970.00 | 0.42% | 58.72% | 1.42 T |
| ETH | 2,697.00 | 2.28% | 13.38% | 324.76 B |
| SOLANA | 176.02 | -1.88% | 3.42% | 82.80 B |
| XRP | 0.5233 | -0.36% | 1.22% | 29.66 B |
| DOGE | 0.1703 | 1.42% | 1.03% | 25.05 B |
| TRX | 0.1684 | 2.51% | 0.60% | 14.56 B |
| CARDANO | 0.3538 | 1.65% | 0.51% | 12.37 B |
| AVAX | 26.26 | -1.46% | 0.44% | 10.69 B |
| SHIB | 0.00001848 | -0.50% | 0.45% | 10.90 B |
| LINK | 12.14 | 5.76% | 0.31% | 7.61 B |
| DOT | 4.173 | 0.14% | 0.26% | 6.29 B |
*Prepared on 10.30.2024 at 13:30 (UTC)
What’s Left Behind
Critical Economic Data Released in the US
US Gross Domestic Product (GDP): Previous: 3.0%, Expected: 3.0%, Announced: 2.8
US – Core Personal Consumption Expenditures: Previous: 2.8%, Expected: 2.1%, Announced: 2.2%
Technology Companies Balance Sheets
Microsoft and Meta Platforms (Facebook’s parent company) will report their third quarter earnings on Wednesday, October 30, while Apple and Amazon will report their third quarter earnings on Thursday, October 31. As these companies make up the bulk of the S&P 500 and have a significant influence on the markets, their earnings reports could have an impact on pricing.
New Development in Ripple and XRP Case
In the lawsuit against Ripple Labs Inc. and XRP II LLC, Ripple CEO Brad Garlinghouse and other representatives of the company asked the court to enter a final judgment and indefinitely suspend the individual state law claims. The court asked the parties to consider a new remedy, taking into account the voluntary withdrawal of the remaining individual claims.
Japan Gives Green Light to O Meme Coin
PEPE, one of the popular meme coin projects of the last period, was recorded as the first meme coin in Japan. PEPE debuted on Japan’s cryptocurrency exchange named BITPoint. Thus, it became the first meme coin traded in Japan, one of the largest countries in Asia.
Highlights of the Day
Important Economic Calender Data
| Time | News | Expectation | Previous |
|---|---|---|---|
| 14:00 | US Pending Home Sales (MoM) (Sep) | 1.9% | 0.6% |
Information
*The calendar is based on UTC (Coordinated Universal Time) time zone.
The economic calendar content on the relevant page is obtained from reliable news and data providers. The news in the economic calendar content, the date and time of the announcement of the news, possible changes in the previous, expectations and announced figures are made by the data provider institutions. Darkex cannot be held responsible for possible changes that may arise from similar situations.
Market Compass
Ahead of the upcoming presidential election and the Federal Reserve decision, the US continues to dominate the markets. Dominance of Bitcoin is at 60% and the largest digital currency is still close to record highs. Stock market indices are generally down and the dollar has fluctuated after the data releases.
Private sector employment in the world’s largest economy increased by 233K in October in the non-farm sectors, well above the expectations of 110K. We also saw that the economy expanded by 2.8% in the third quarter, slightly below forecasts (3.0%). If we evaluate this data set as a whole, we can say that the realization of the US Federal Reserve’s (FED) “soft easing” target is on the horizon and the expectations that the FED will continue to cut interest rates, albeit at a slower pace than before, have been reinforced. Markets will continue to be sensitive to the US data and will be closely monitored to predict the Fed’s next step. The critical US employment data to be released on Friday is likely to be the most important development of this week. Click here to review our report on this subject.
After the US data released, we saw a narrow fluctuation in the dollar and a decline in the yield of the 10-year bond. The dollar also generally followed a pressured course as a first effect. However, it is difficult to say that these data reshaped the main course and the basic expectations of the markets. Nevertheless, in the case of BTC, a slight retracement was observed in digital assets with this equation.
We do not see anything contrary to our long-term bullish, short-term retracement expectation, and we can underline that it would be reasonable to see a pause after the recent rapid rise in digital assets. The critical US data to be released later in the week, the presidential election agenda, developments in the Middle East, China’s possible incentives and the dose of institutional investors’ interest in digital assets via EFT will continue to play a decisive role in the direction of the market in the coming days.
Tecnical Analysis
BTC/USDT
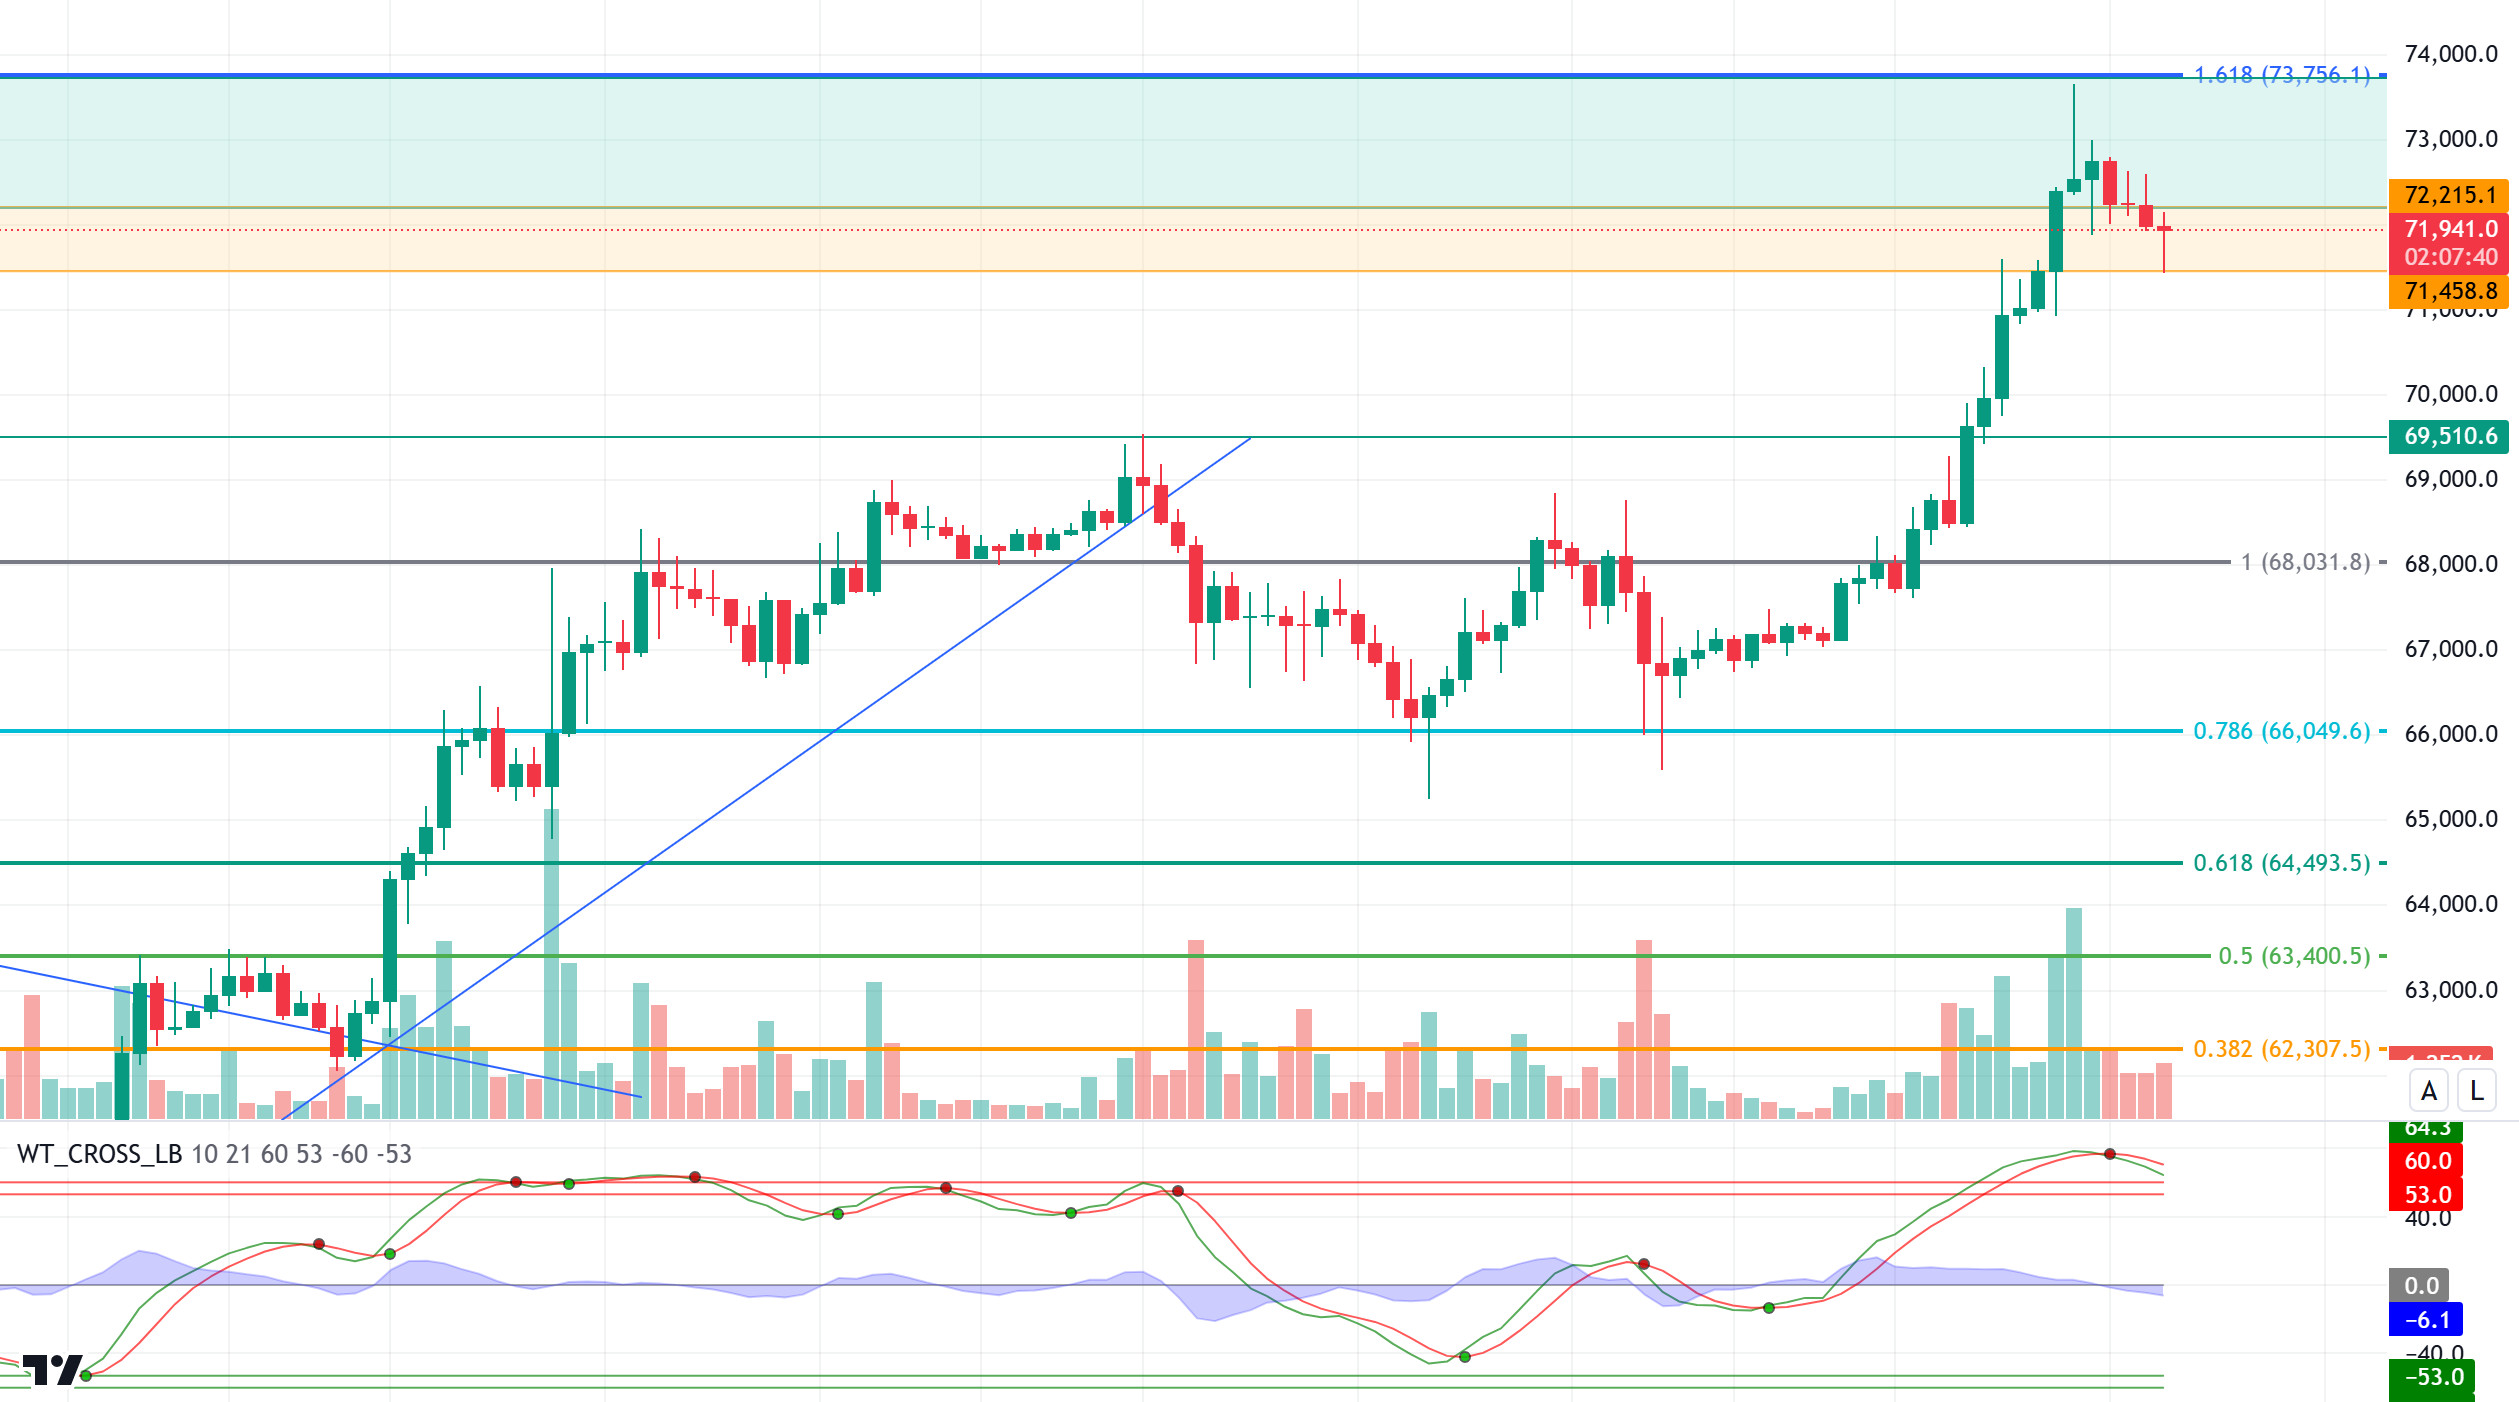
In recent days, Bitcoin has achieved a remarkable 8% rise with the momentum it has achieved and pushed the price above the 73,000 level. As Bitcoin prepares to lose some of its bullish momentum, all eyes were on the critical macroeconomic data released by the US today. The recent GDP data, which came in below expectations, may lead the FED to further interest rate cuts, which may limit the declines in Bitcoin, which is in the process of correction.
In light of all these developments, we reiterate the thesis that the correction movements are effective in gaining upward momentum in the name of bullishness, which we stated in our previous technical analysis. With the flag formation that will form on the BTC chart, which we expect to enter the short-term respite phase, the price may fall below the 71,458 support level. As a matter of fact, our technical oscillator continues to maintain its sell signal in the overbought zone. As the election atmosphere heats up in the coming week, positive catalysts such as Donald Trump’s increased likelihood of winning and China’s additional stimulus package allow us to maintain our expectation that the price will move above the ATH level.
Supports 71,458 – 69,510 – 68,125
Resistances 72,215 – 72,800 – 73,750
ETH/USDT
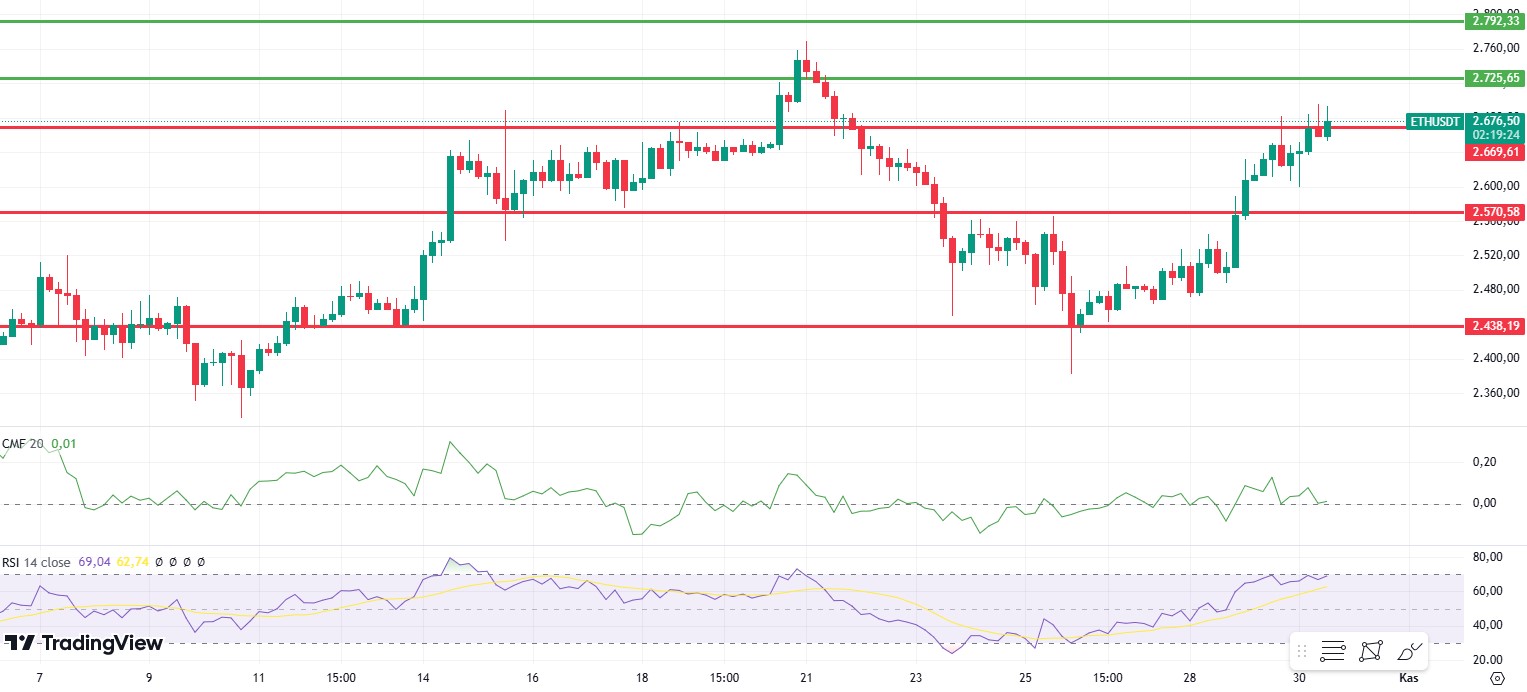
With ETH breaking the 2,669 resistance, it is seen that the momentum is positive. Chaikin Money Flow (CMF) has been on the rise again since the morning hours, supporting the positive structure. For On Balance Volume (OBV), the breakdown of the negative structure and moving back to the positive area is another factor that strengthens the structure. However, it is possible that a negative divergence may occur on the Relative Strength Index (RSI) and a correction movement may come despite the possibility of a double top. With the break of the 2,669 level, the correction can be expected to deepen. However, if this level is maintained, the rise may advance up to 2.725.
Supports 2,669 – 2,571 – 2,438
Resistances 2,725 – 2,792 – 2,933
LINK/USDT
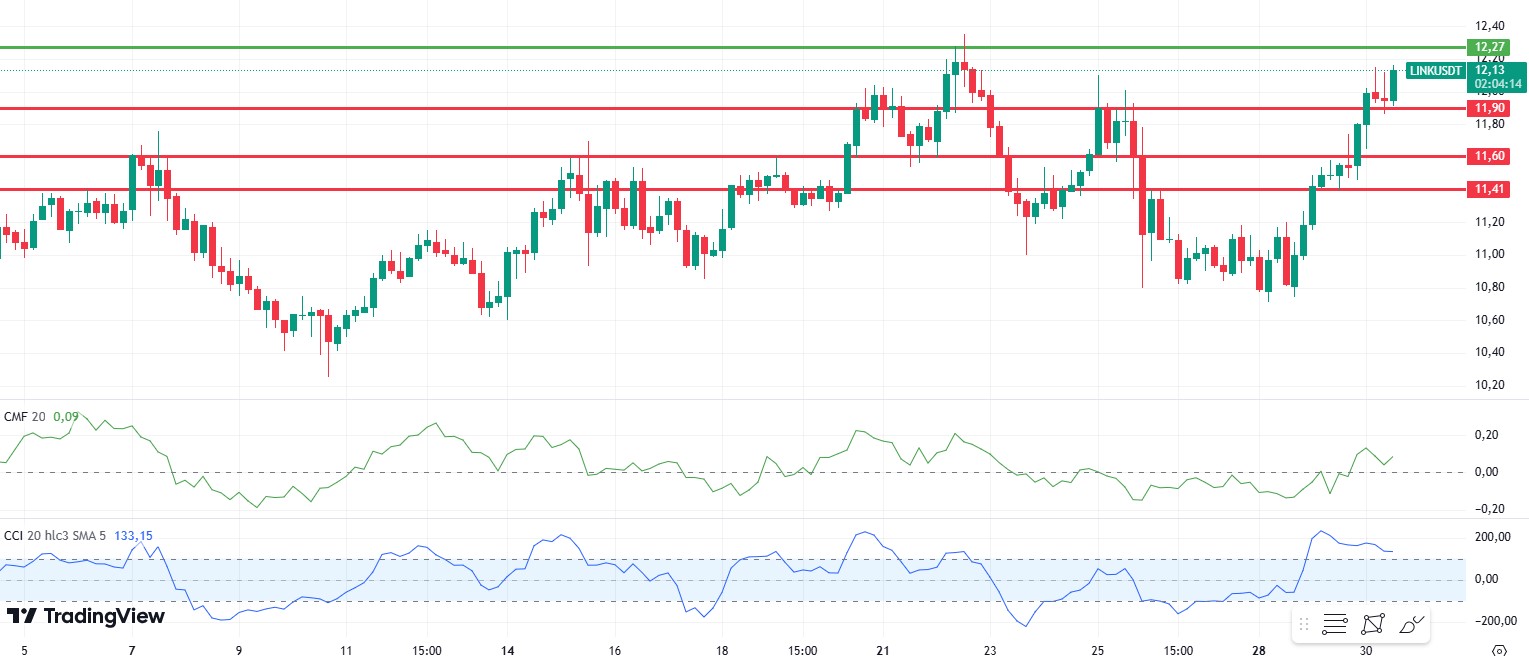
LINK maintains its strong structure by staying above the 11.90 level. However, it can be said that the rise may continue with hard candles once the 12.27 level is exceeded. With Chaikin Money Flow (CMF) turning positive again and the positive outlook on the Commodity Channel Index (CCI), it can be said that a very positive outlook prevails, provided that the 11.90 level is not broken. However, a break of the specified level may bring declines up to 11.60 again.
Supports 11.90 – 11.60 – 11.41
Resistances 12.27 – 12.98 – 13.77
SOL/USDT
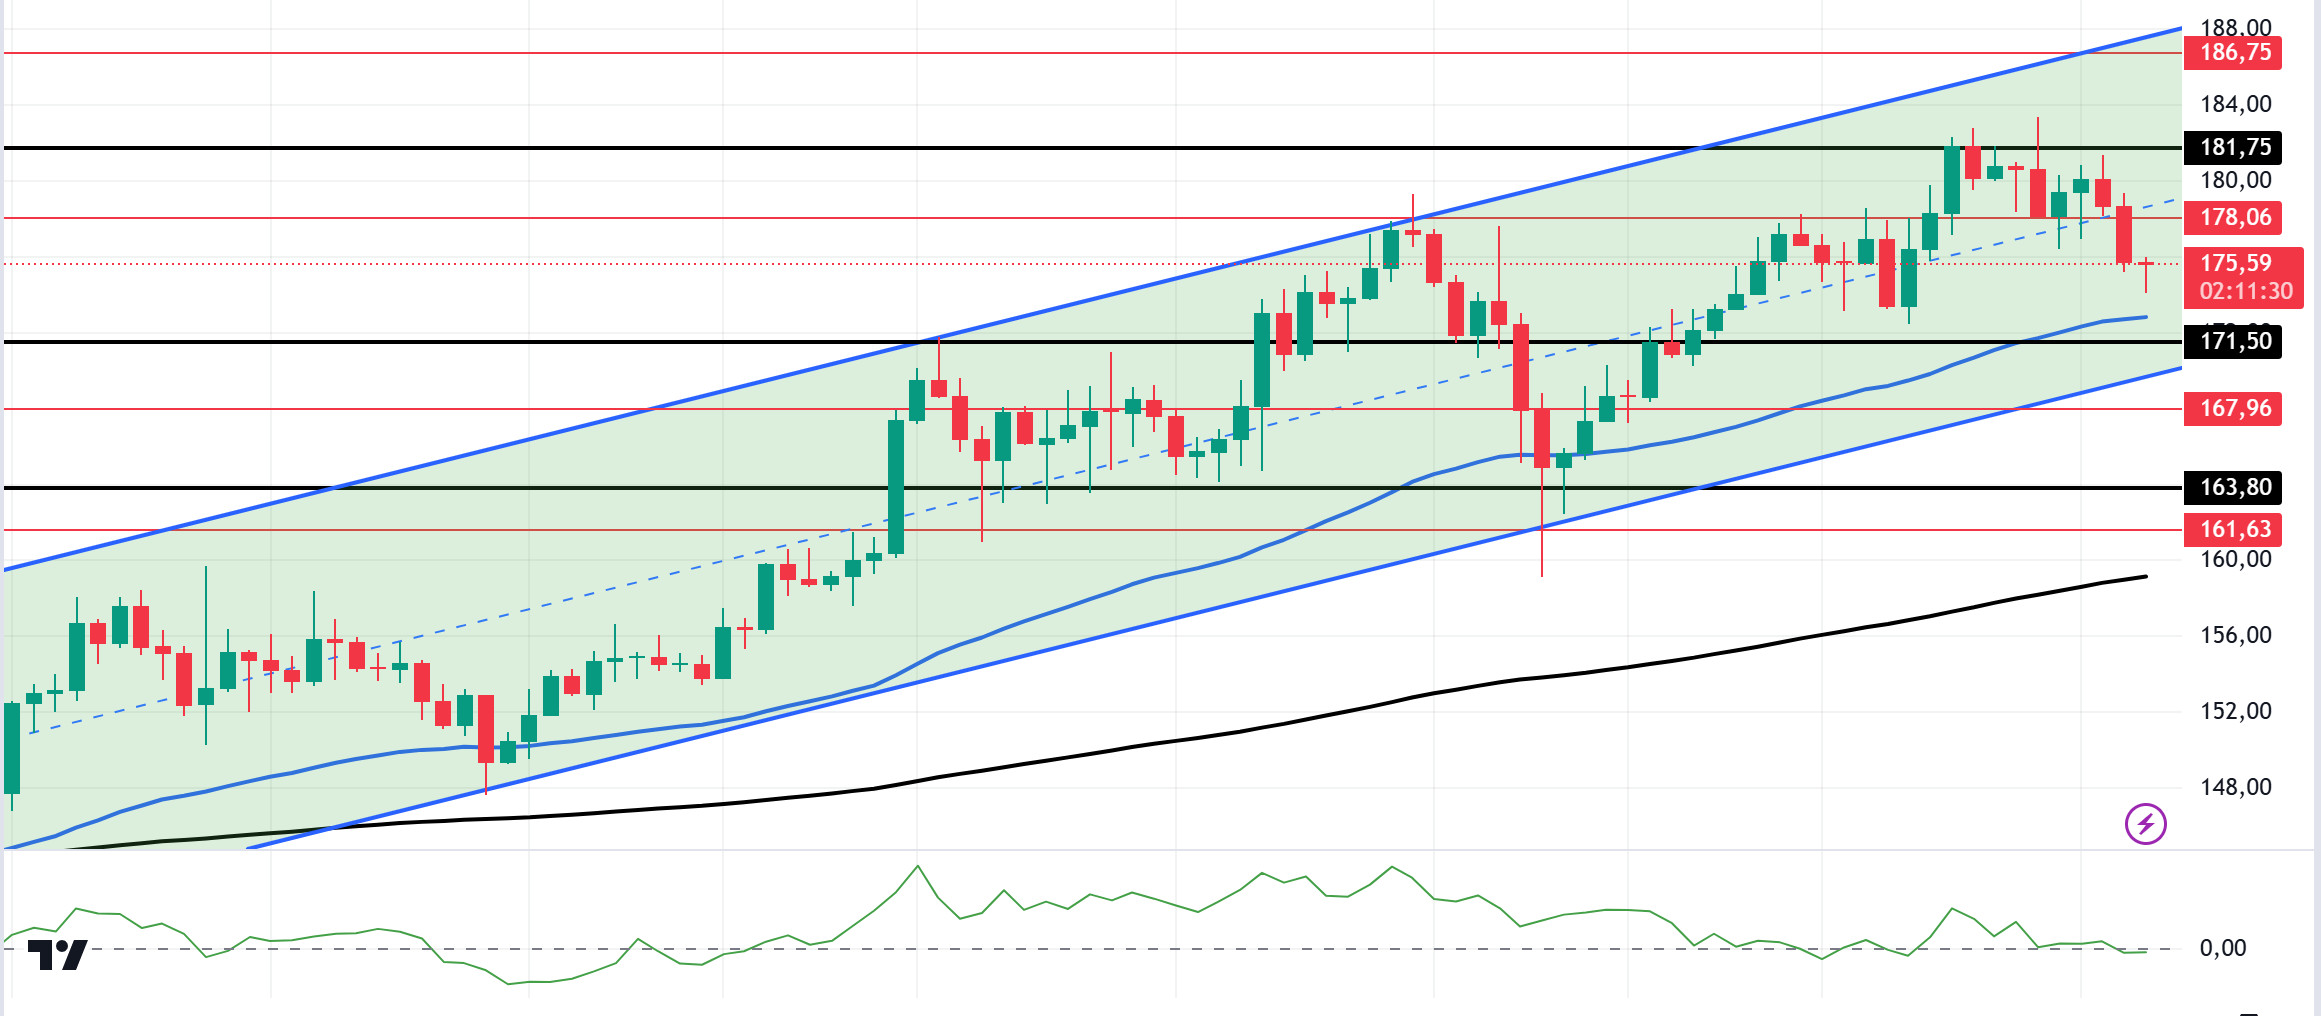
Today, the gross domestic product from the US is estimated to have expanded by 2.8% on an annualized basis in Q3. This rate was below the expected growth of 3%. This rate shows us that the FED has started the interest rate cut cycle and inflation is falling. In the Solana ecosystem, in a significant development in the digital asset management space, VanEck announced a partnership with Kiln to facilitate Solana staking as part of its comprehensive Solana Strategy. This initiative aims to provide institutional investors with an easier entry point into the Solana ecosystem through regulated products, Exchange Traded Notes (ETNs) and Exchange Traded Funds (ETFs). Technically, SOL is down 2.12% since our analysis this morning. In the 4-hour timeframe, it tested the strong resistance at $ 181.75 but failed to break it. The 50 EMA (Blue Line) continues to be above the 200 EMA (Black Line). This means that the uptrend will continue, but the large distance between them may also bring possible declines. When we examine the Chaikin Money Flow (CMF)20 indicator, it has crossed into negative territory. This shows us that the money outflow continues to increase. The 181.75 level stands out as a very strong resistance point in the rises driven by both macroeconomic conditions and innovations in the Solana ecosystem. If it rises above this level, the rise may continue strongly. In case of possible political reasons or profit sales, the support levels of 171.50 and 163.80 may be triggered again. If the price comes to these support levels, a potential bullish opportunity may arise.
Supports 171.50 – 167.96 – 163.80
Resistances 178.06 – 181.75 – 186.75
ADA/USDT
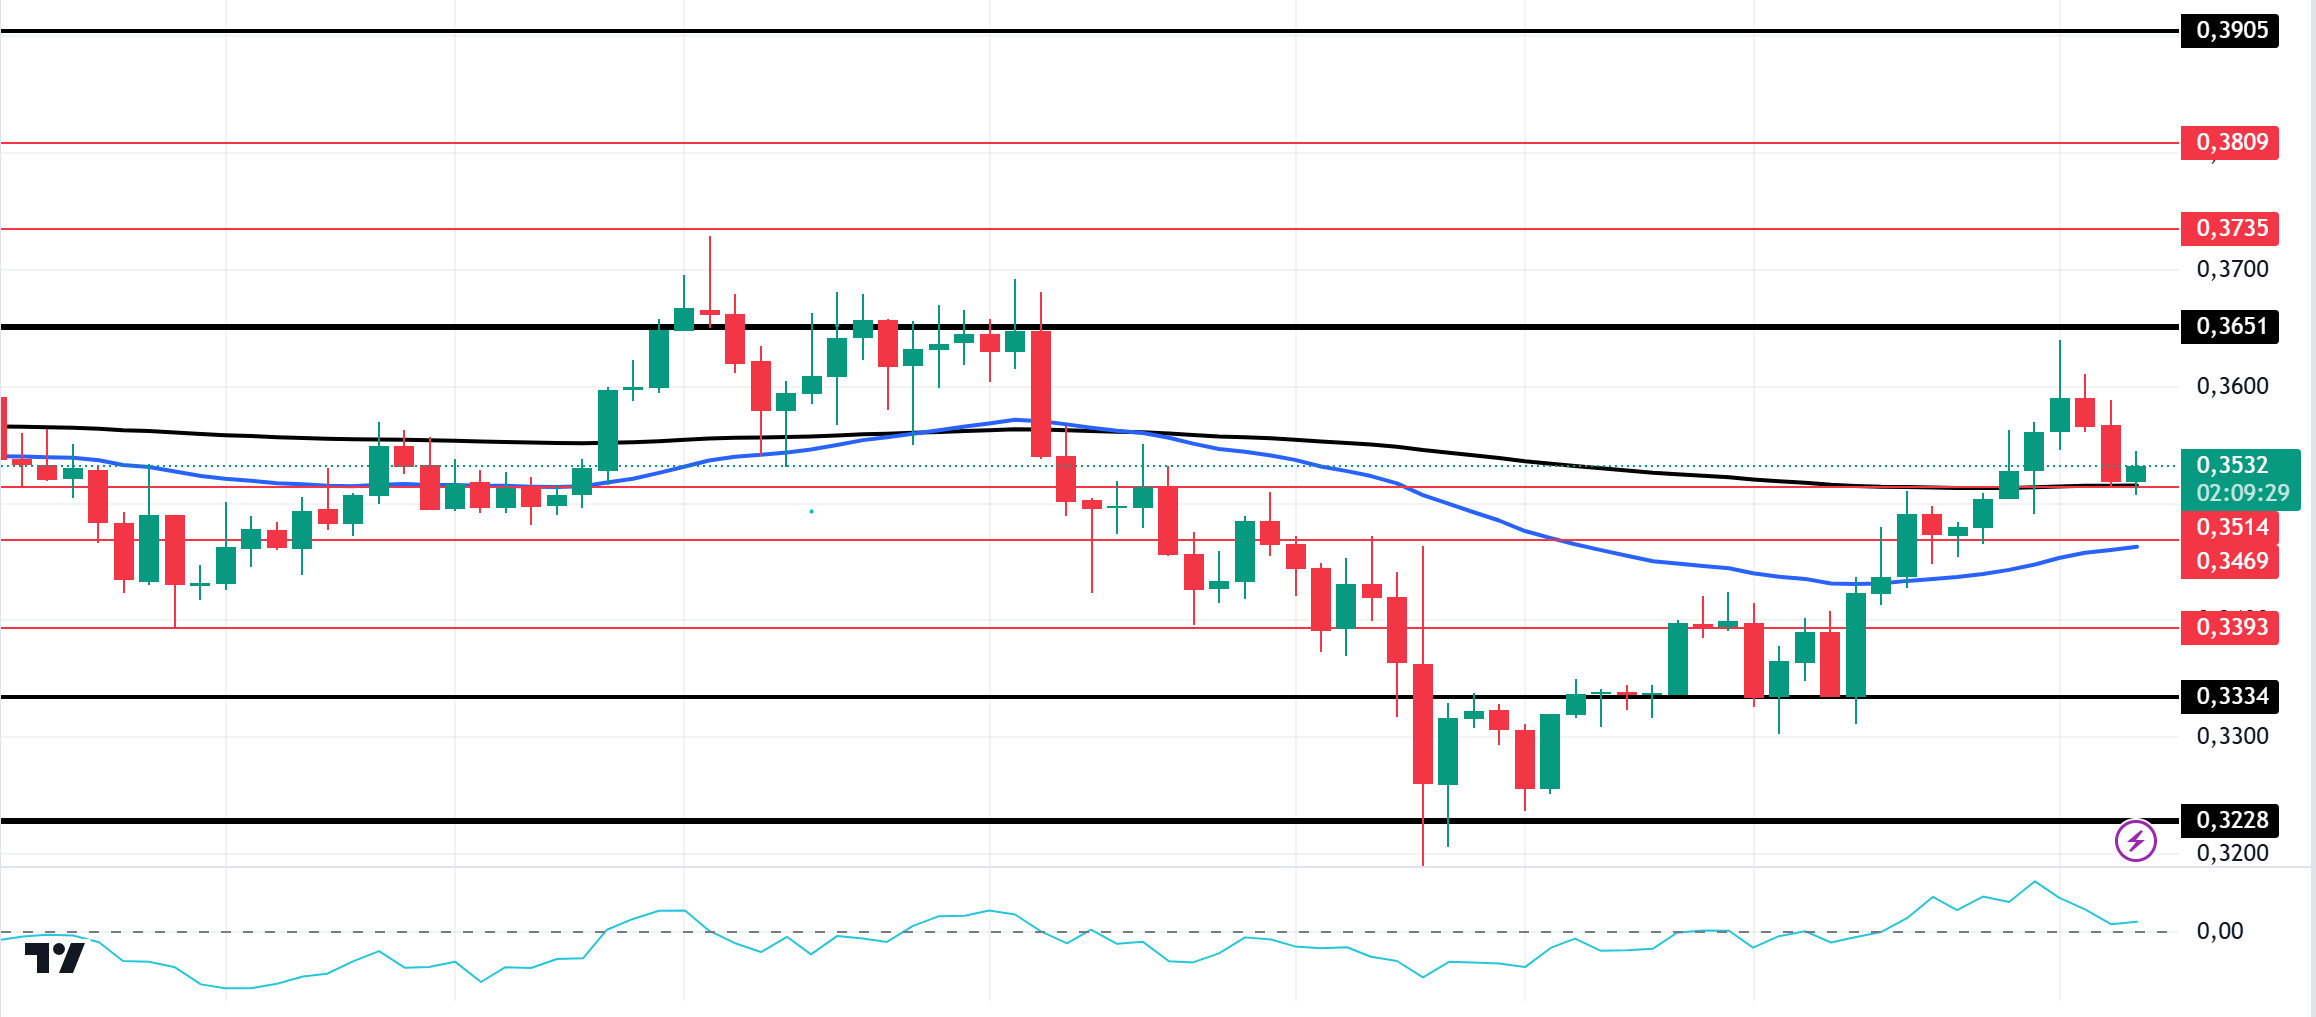
Today, the gross domestic product from the US is estimated to have expanded by 2.8% on an annualized basis in Q3. This rate was below the expected growth of 3%. This rate shows us that the FED has started the interest rate cut cycle and inflation is falling. In the Cardano ecosystem, according to IntoTheBlock, Cardano’s Network Value to Transactions Ratio (NVT) reached its highest levels ever recorded in June. This increase indicates a decrease in on-chain activity compared to the price increase. In other words, the NVT Ratio indicates an increase in speculation. It is important to note that when the NVT ratio rises, it usually precedes a price drop. Technically speaking, ADA is currently at a critical point and the price is showing signs of a potential breakout. The price continues to accelerate, increasing by 3.83% in the last 24 hours. On the 4-hour chart, the price has broken the 50 EMA (Blue Line). The 200 EMA (Black Line) seems to be the support at the moment. However, the 50 EMA is below the 200 EMA. This shows that the trend is bearish. At the same time, ADA price is currently stuck in a three-month range after testing resistance twice and support three times. The Chaikin Money Flow (CMF)20 indicator is also positive, but inflows seem to have decreased. However, ADA may test the 0.3651 level once again. In the event of a decline due to the macroeconomic data and negativity in the ecosystem, it may test the support level of 0.3334 once again. It may be appropriate to buy when it reaches this price level. In the rises due to developments in the ecosystem, if the 0.3651 level is broken in volume, the upward acceleration will increase even more and the 0.3905 level should be followed as a retracement place.
Supports 0.3514 – 0.3469 – 0.3393
Resistances 0.3651 – 0.3735 – 0.3809
AVAX/USDT
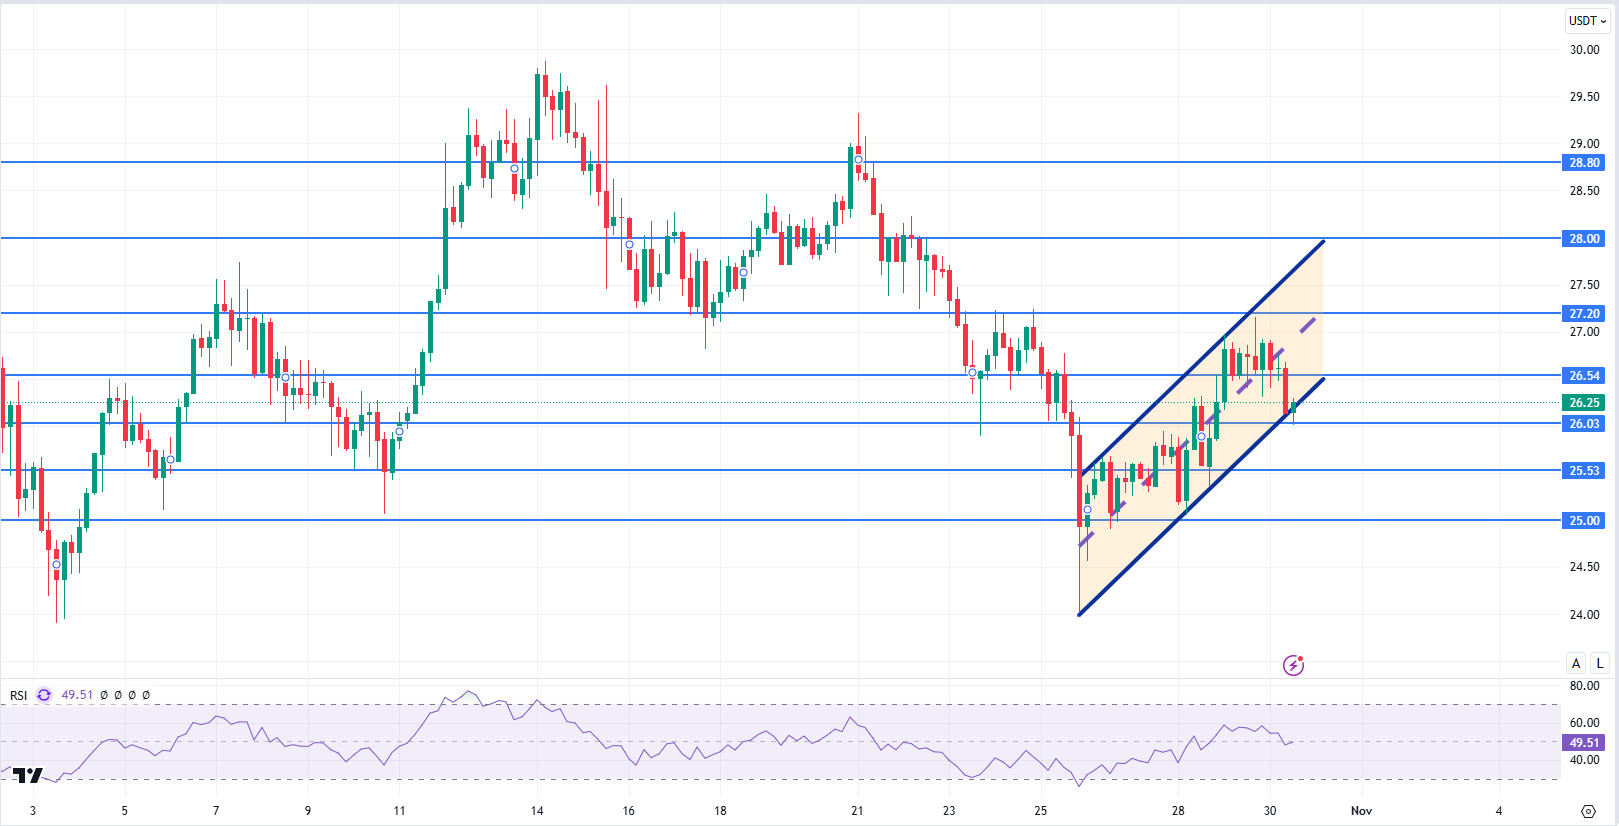
AVAX, which opened today at 26.88, is trading at 26.25, down about 2.5% during the day. Today, there is no planned data to be announced especially by the US and expected to affect the market. For this reason, it may be a low-volume day where we may see limited movements. News flows from the Middle East will be important for the market.
On the 4-hour chart, it moves within the bullish channel. It is in the lower band of the bullish channel and with a Relative Strength Index value of 49, it can be expected to rise slightly from these levels. In such a case, it may test the 26.54 resistance. On the other hand, selling pressure may increase if there is news of increasing tension in the Middle East. In such a case, it may test 26.03 support. As long as it stays above 25.00 support during the day, the desire to rise may continue. With the break of 25.00 support, sales may increase.
Supports 26.03 – 25.53 – 25.00
Resistances 26.54 – 27.20 – 28.00
TRX/USDT
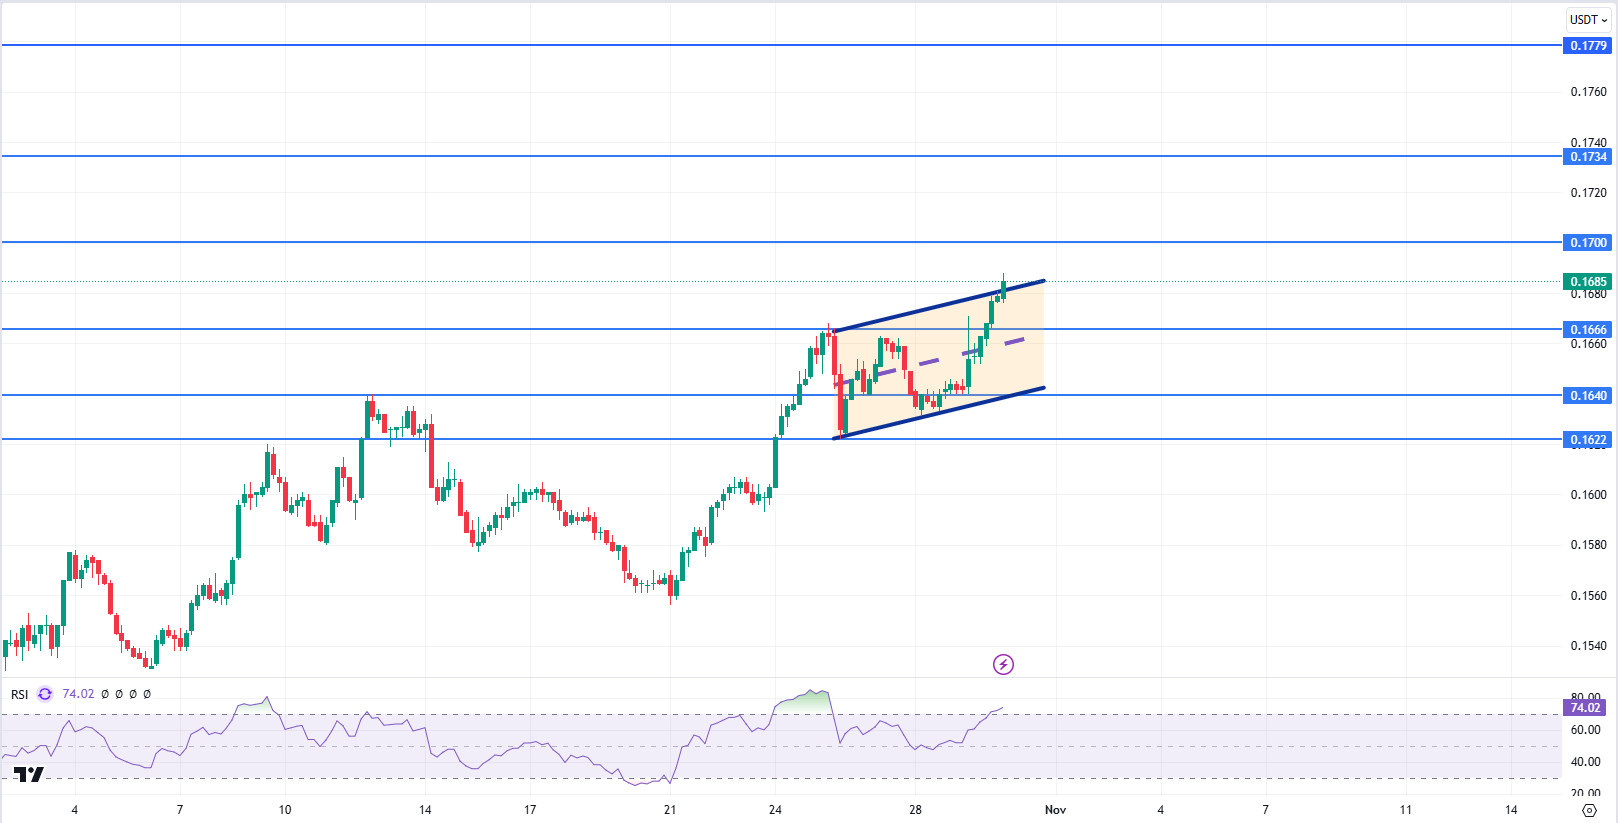
TRX, which started today at 0.1662, is trading at 0.1685, up about 1.5% during the day. There is no scheduled data for the market today. The market will also be closely following the news flows regarding the tension in the Middle East.
On the 4-hour chart, the bullish channel is in its upper band. The Relative Strength Index value is 74 and is in the overbought zone. Although it has the possibility of moving up during the day with the big news mentioned in Justin Sun’s post, it can be expected to decline slightly from its current level. In such a case, it may move to the channel mid-band and test the 0.1666 support. However, it cannot close the candle below 0.1666 support and may test 0.1700 resistance with the buying reaction that will occur if the news to be announced has a big impact. As long as TRX stays above 0.1482 support, the desire to rise may continue. If this support is broken downwards, sales can be expected to increase.
Supports 0.1666 – 0.1640 – 0.1626
Resistances 0.1700 – 0.1734 – 0.1779
DOT/USDT
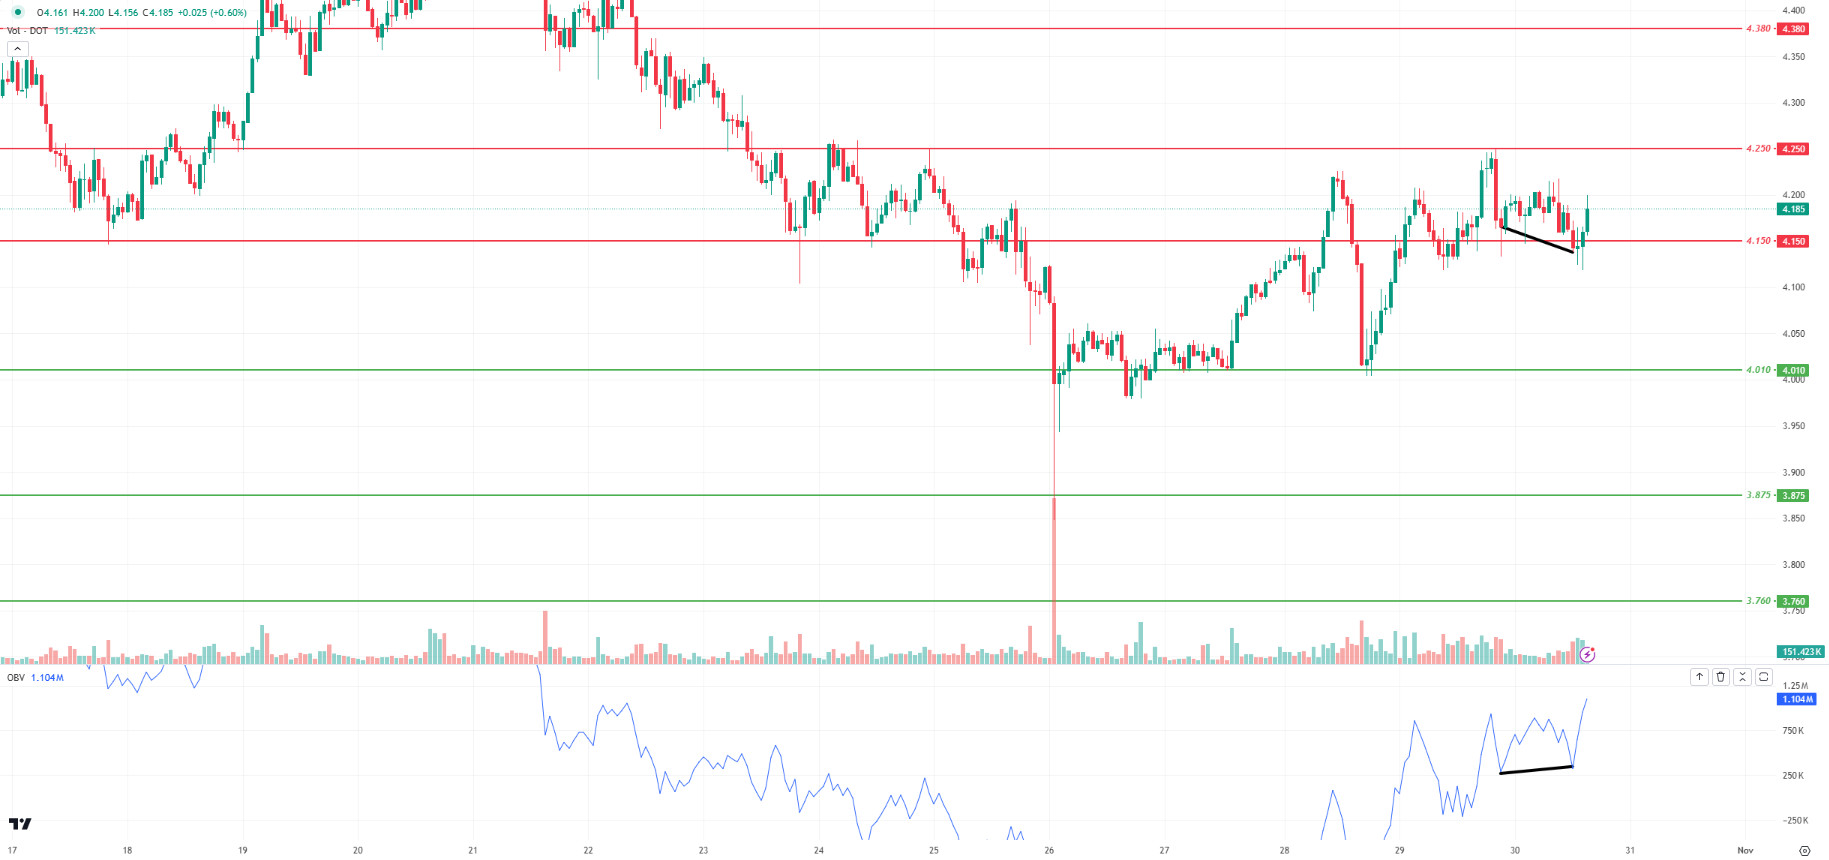
When we examine the Polkadot (DOT) chart, we see that the price broke the 4,150 level down. When we examine the Chaikin Money Flow (CMF) oscillator, we can say that the selling pressure is strong. In this context, the price may retreat to 4.010 levels. In the positive scenario, there seems to be a positive divergence between the On Balance Volume (OBV) oscillator and the price. In case the buyer pressure increases, if the price persists above the 4,150 level, its next target may be the 4,250 level.
Supports 4.010 – 3.875 – 3.760
Resistances 4.150 – 4.250 – 4.380
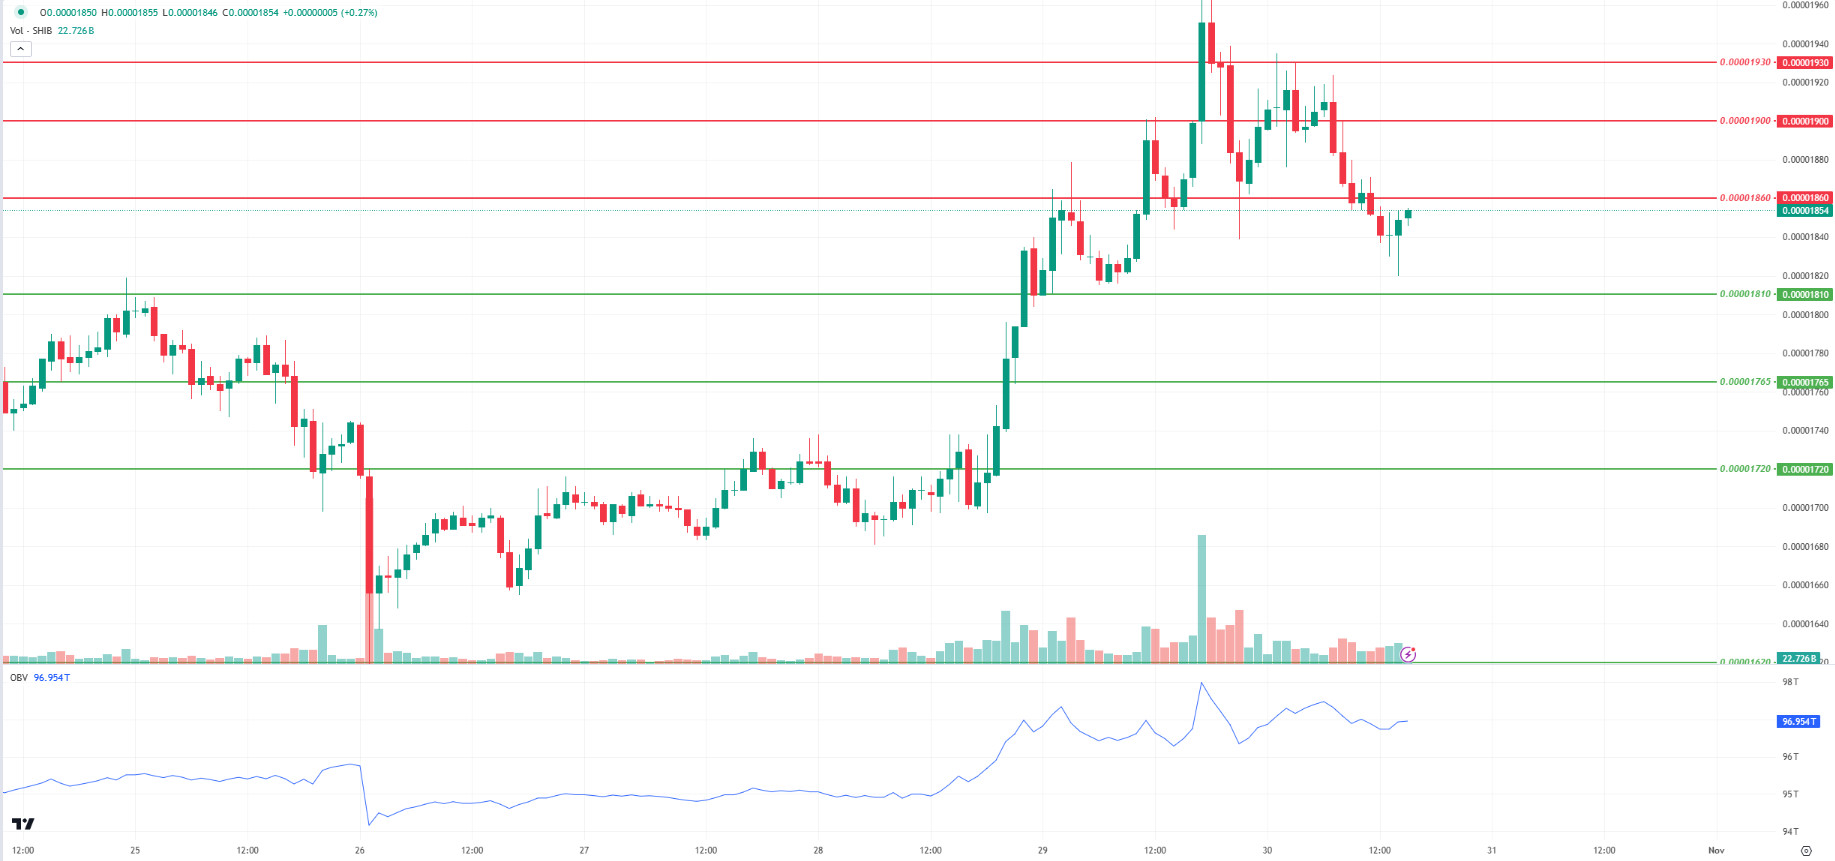
SHIB/USDT
Shiba Inu’s representative Shytoshi Kusama highlighted that the SHIB token has achieved an impressive growth of 33,774,726%, outpacing Bitcoin and other leading digital assets. This benchmark could increase investment interest in the token, highlighting SHIB’s rapid rise. Shytoshi also noted that new products will be launched soon in the SHIB ecosystem. These developments could strengthen community activity, cement SHIB’s place in the financial ecosystem and have a positive impact on the token’s value.
When we examine the Shib Inu (SHIB) chart, we see that it broke the 0.00001860 level down. When we examine the Chaikin Money Flow (CMF) oscillator, we can say that the selling pressure is strong. According to the MACD oscillator, we can see that the selling pressure increased compared to the previous hour. In this context, the price may retreat towards 0.00001810 levels. In the positive scenario, the price may want to break the selling pressure at the 0.00001860 level in the scenario where the buying pressure increases.
Supports 0.00001810 – 0.00001765 – 0.00001720
Resistances 0.00001860 – 0.00001900 – 0.00001930
Legal Notice
The investment information, comments and recommendations contained herein do not constitute investment advice. Investment advisory services are provided individually by authorized institutions taking into account the risk and return preferences of individuals. The comments and recommendations contained herein are of a general nature. These recommendations may not be suitable for your financial situation and risk and return preferences. Therefore, making an investment decision based solely on the information contained herein may not produce results in line with your expectations.


