
MARKET SUMMARY
Latest Situation in Crypto Assets
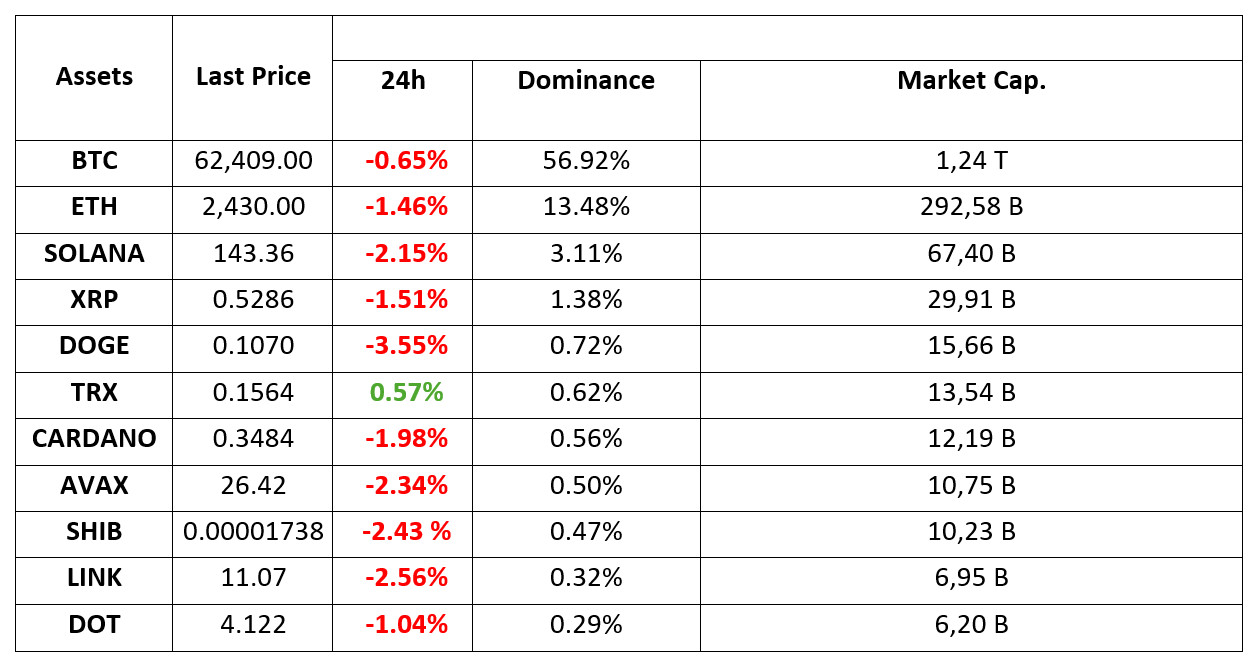
*Prepared on 10.08.2024 at 14:00 (UTC)
WHAT’S LEFT BEHIND
Bitcoin and S&P 500
So far, the idea that bitcoin (BTC) moves in tandem with the S&P 500 has been an accepted view by the market majority. However, the positive correlation is likely to be tested in the run-up to the US elections as options market pricing points to divergent trends. According to data tracked by analytics platform Block Scholes, bitcoin options listed on crypto exchange Deribit yesterday exhibited a noticeable bias in short-term call options, likely due to the US elections on November 8 and its outcome.
China Eases Stimulus Plans
The lack of new measures and new stimulus announcements in the country’s statements today dampened hopes for the stimulus package. Bitcoin (BTC) retreated in Asian morning hours, while the September rally in Chinese stocks fell as investors returned to the market after a week-long holiday.
HIGHLIGHTS OF THE DAY
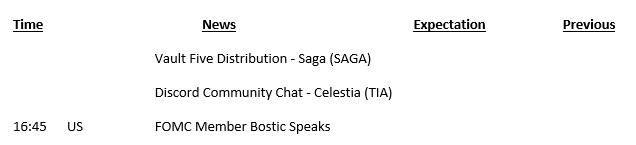
INFORMATION
*The calendar is based on UTC (Coordinated Universal Time) time zone. The economic calendar content on the relevant page is obtained from reliable news and data providers. The news in the economic calendar content, the date and time of the announcement of the news, possible changes in the previous, expectations and announced figures are made by the data provider institutions. Darkex cannot be held responsible for possible changes that may arise from similar situations.
MARKET COMPASS
The supportive measures (such as incentives, interest rate cuts) announced by the authorities of the world’s first two largest economies in recent weeks had increased risk appetite and increased demand for risky assets. This morning, however, the statements made by China’s National Development and Reform Commission (NDRC) did not meet market expectations. We also saw the repercussions of this in digital assets. In addition, expectations that the US Federal Reserve (FED) will take smaller interest rate cuts, the upcoming presidential election and the increasing tension in the Middle East gave investors the idea that it would be more logical to remain cautious.
We do not expect the effects of the developments on the Chinese front to be permanent. On the US side, we think that the markets will adapt to the FED’s new interest rate path. However, Middle East tensions are likely to remain a factor of uncertainty. Hezbollah fired rockets at Haifa, Israel today and Israel increased its military presence in Lebanon. The Israeli Defense Minister is going to Washington tomorrow. Another agenda in the capital is Trump’s narrowing lead over Harris in the polls. According to Polymarket, Trump is ahead.
US 10-year bond yields are back above 4.0%, reflecting investors adjusting their positions in the face of the new outlook for the Fed, and the dollar index is clinging to its recent gains, albeit with some easing. On the digital assets front, the decline triggered by the disappointment of China’s NDRC seems to have been limited, but it still hasn’t found enough strength to rise due to the current mood. Although we still think that the main direction is up and the area below is narrower than above, we do not rule out the possibility that the horizontal and volume-less course will continue. The rise in US index futures, which point to a positive opening, may be a distinguishing factor.
TECHNICAL ANALYSIS
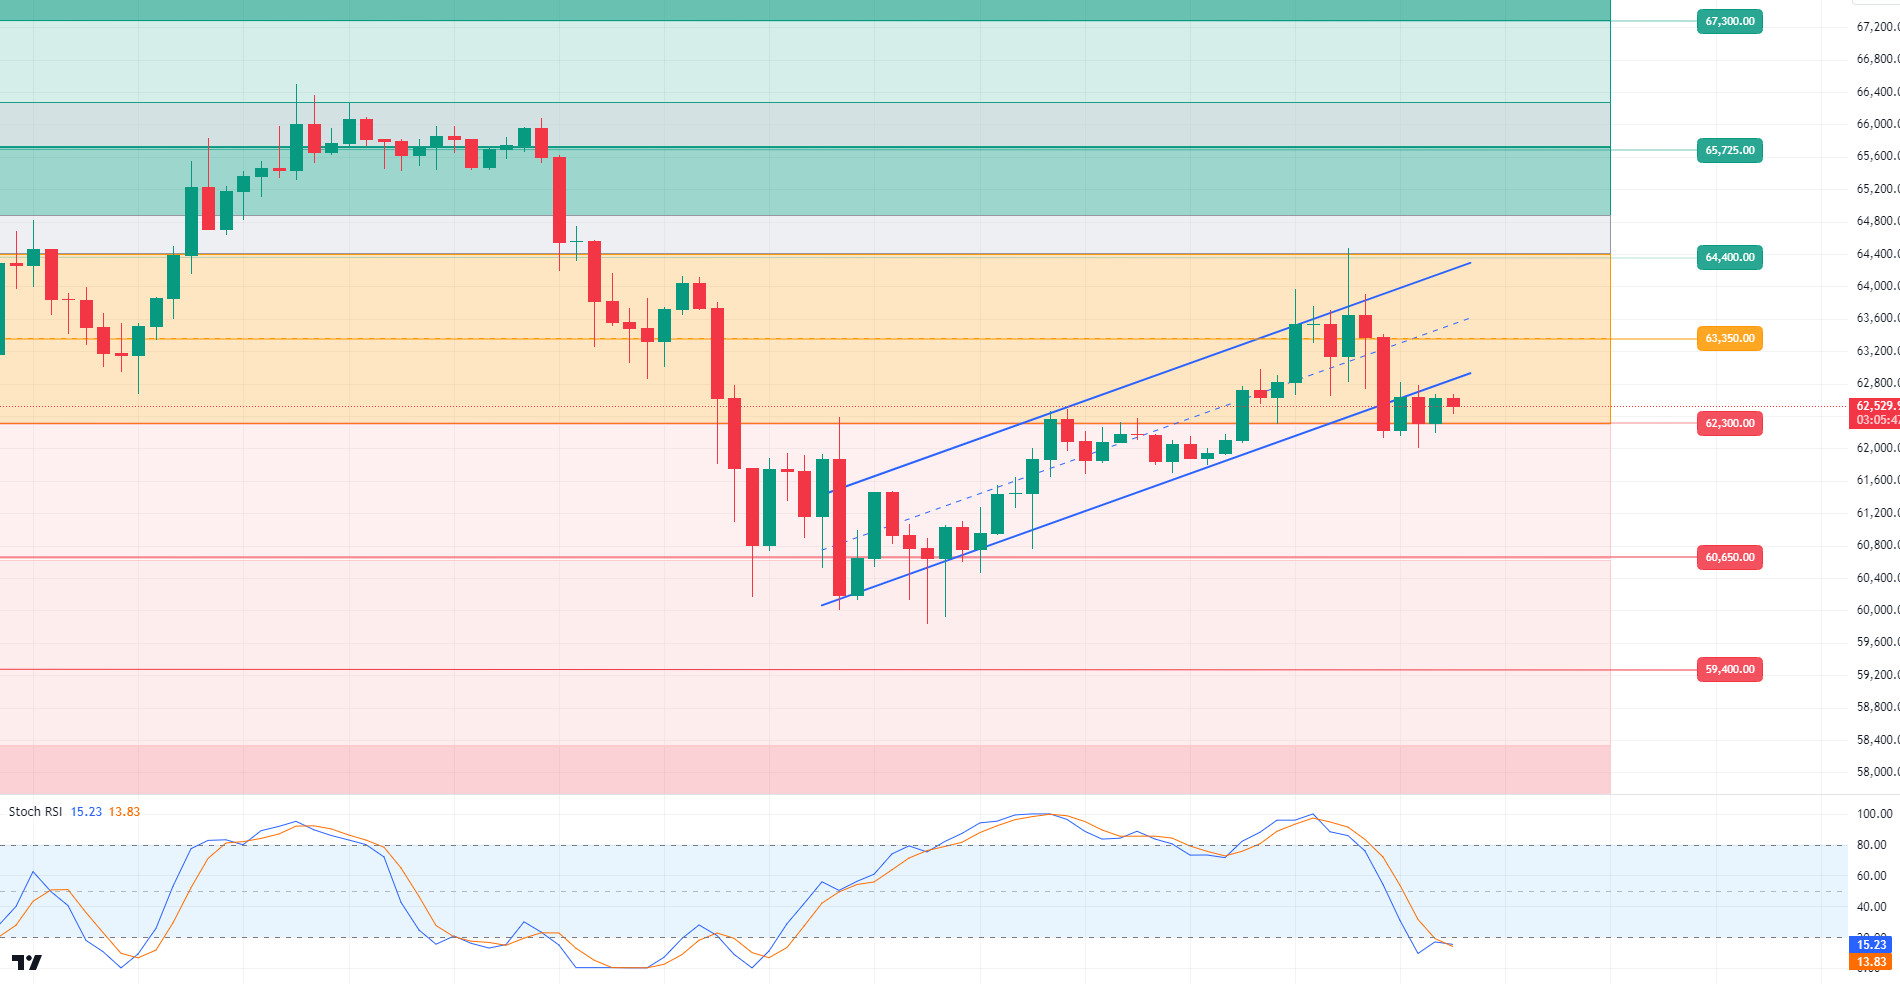
BTC/USDT
Bitcoin at Critical Support! The stimulus package previously announced by the Chinese government was met with great enthusiasm in the crypto market. However, today’s developments have dampened hopes, with no new measures being taken and no details of the stimulus package being announced. On the Asian side, the end of the holiday in China led to declines in the stock market due to this news, causing a retreat in Bitcoin. Another important development of the day was the divergence in the correlation between US stocks and Bitcoin. Yesterday, this divergence in pricing was reflected in an upward movement in Bitcoin while US stocks were in negative territory. Looking at the BTC 4-hour technical analysis, we observe that the price has not yet broken below the major support level of 62,300, although it has sagged below this level. With pricing returning to the ascending channel, a move back towards the upside resistance level of 63,350 can be expected. Our technical indicator RSI moving in the oversold zone may confirm an upward movement. In case the retracement deepens, the level we should pay attention to will be the 62,300 support point.
Supports 62,300 – 60,650 – 59,400
Resistances 64,400 – 65,750 – 67,300
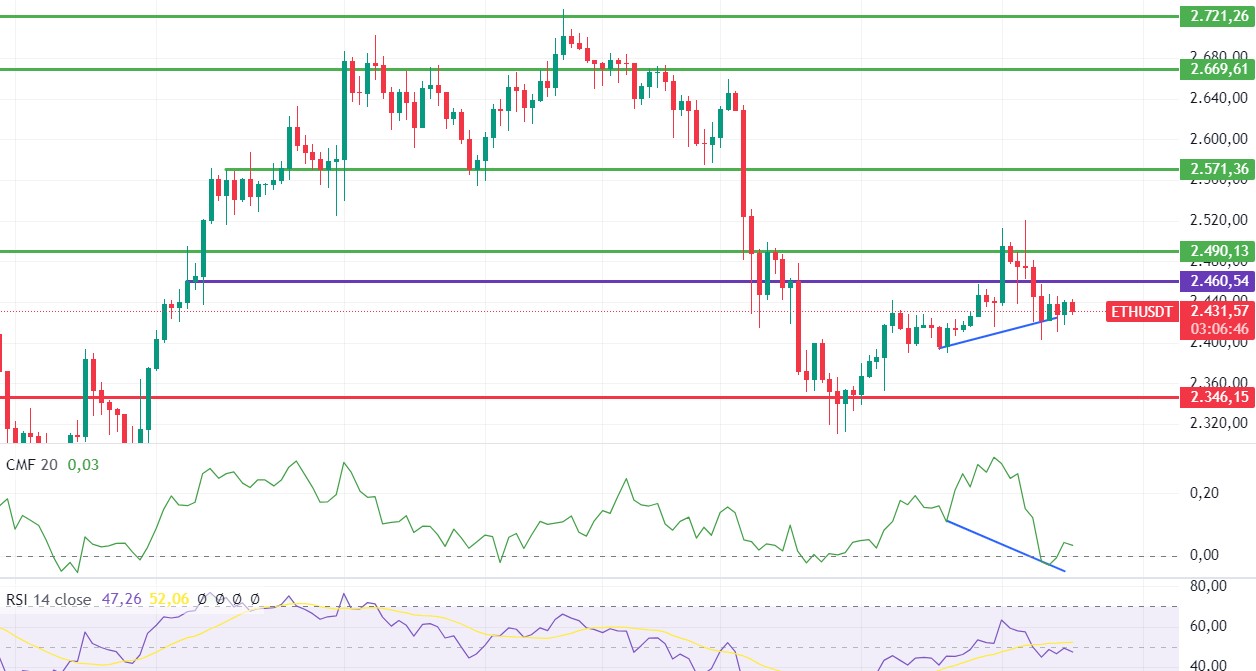
ETH/USDT
Ethereum has risen slightly during the day with the positive mismatch on CMF. For ETH, which has generally moved sideways, we see that the mismatch continues and the RSI structure has turned positive again. Considering the slightly positive outlook in Nasdaq and SP500 pre-market prices, it can be said that there may be rises up to the key resistance point 2,460 levels until the closing. Spot purchases in CVDs are also noteworthy as a contribution to the positive outlook. With the break of the 2,460 level, rises may continue up to 2,510 levels. The 2,400 level stands out as the most important support level. The breakdown of this level may deepen the declines and cause retracements down to 2,346.
Supports 2,400 – 2,346 – 2,270
Resistances 2,460 – 2,490 – 2,510
LINK/USDT
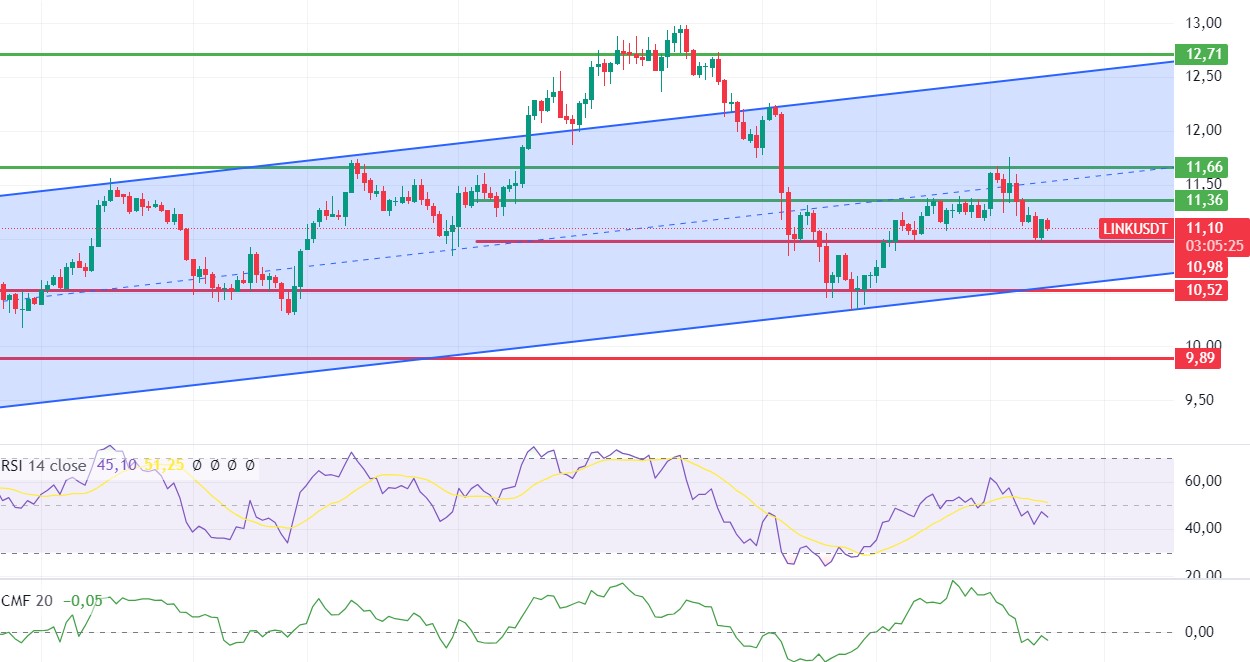
Although LINK started a slight upward trend with support at 10.98, the weakness in volume and the negative outlook on CMF draw attention. RSI and MACD are also neutral for LINK, which needs to exceed the 11.36 level to be able to say that a positive trend has started. For LINK, which we expect to spend time between 11.36 and 10.98 levels for a while, it may be healthier to act according to the breakouts. With the 11.36 breakout, LINK, which can quickly rise to 11.66 levels, may retreat to 10.52 levels with the breakdown of the 10.98 level.
Supports 10.98 – 10.52 – 9.89
Resistances 11.36 – 11.66 – 12.71
SOL/USDT
A look at the liquidations in the Solana ecosystem shows that $2.63 million worth of short positions were liquidated against $1.66 million worth of long positions. If short positions continue to be squeezed, this is likely to cause upward momentum. If the SOL token starts to rise, it may bring more buying pressure. Technically, SOL has been moving sideways since our analysis this morning. The price continues to accumulate in the 127.17 – 161.63 band since August 8. It encountered resistance at 0.618 (151.12), the Fibonacci retracement. On the 4-hour chart, the 50 EMA seems to have received support from the 200 EMA. The 151.12 level appears as a resistance point in the rises driven by both macroeconomic conditions and innovations in the Solana ecosystem. If it rises above this level, the rise may continue. In the sales that investors will make due to political and macroeconomic conditions, the support levels of 143.64 – 137.77 should be followed. If the price comes to these support levels, a potential bullish opportunity may arise.
Supports 143.64 – 137.77 – 135.18
Resistances 147.40 – 151.12 – 155.11

ADA/USDT
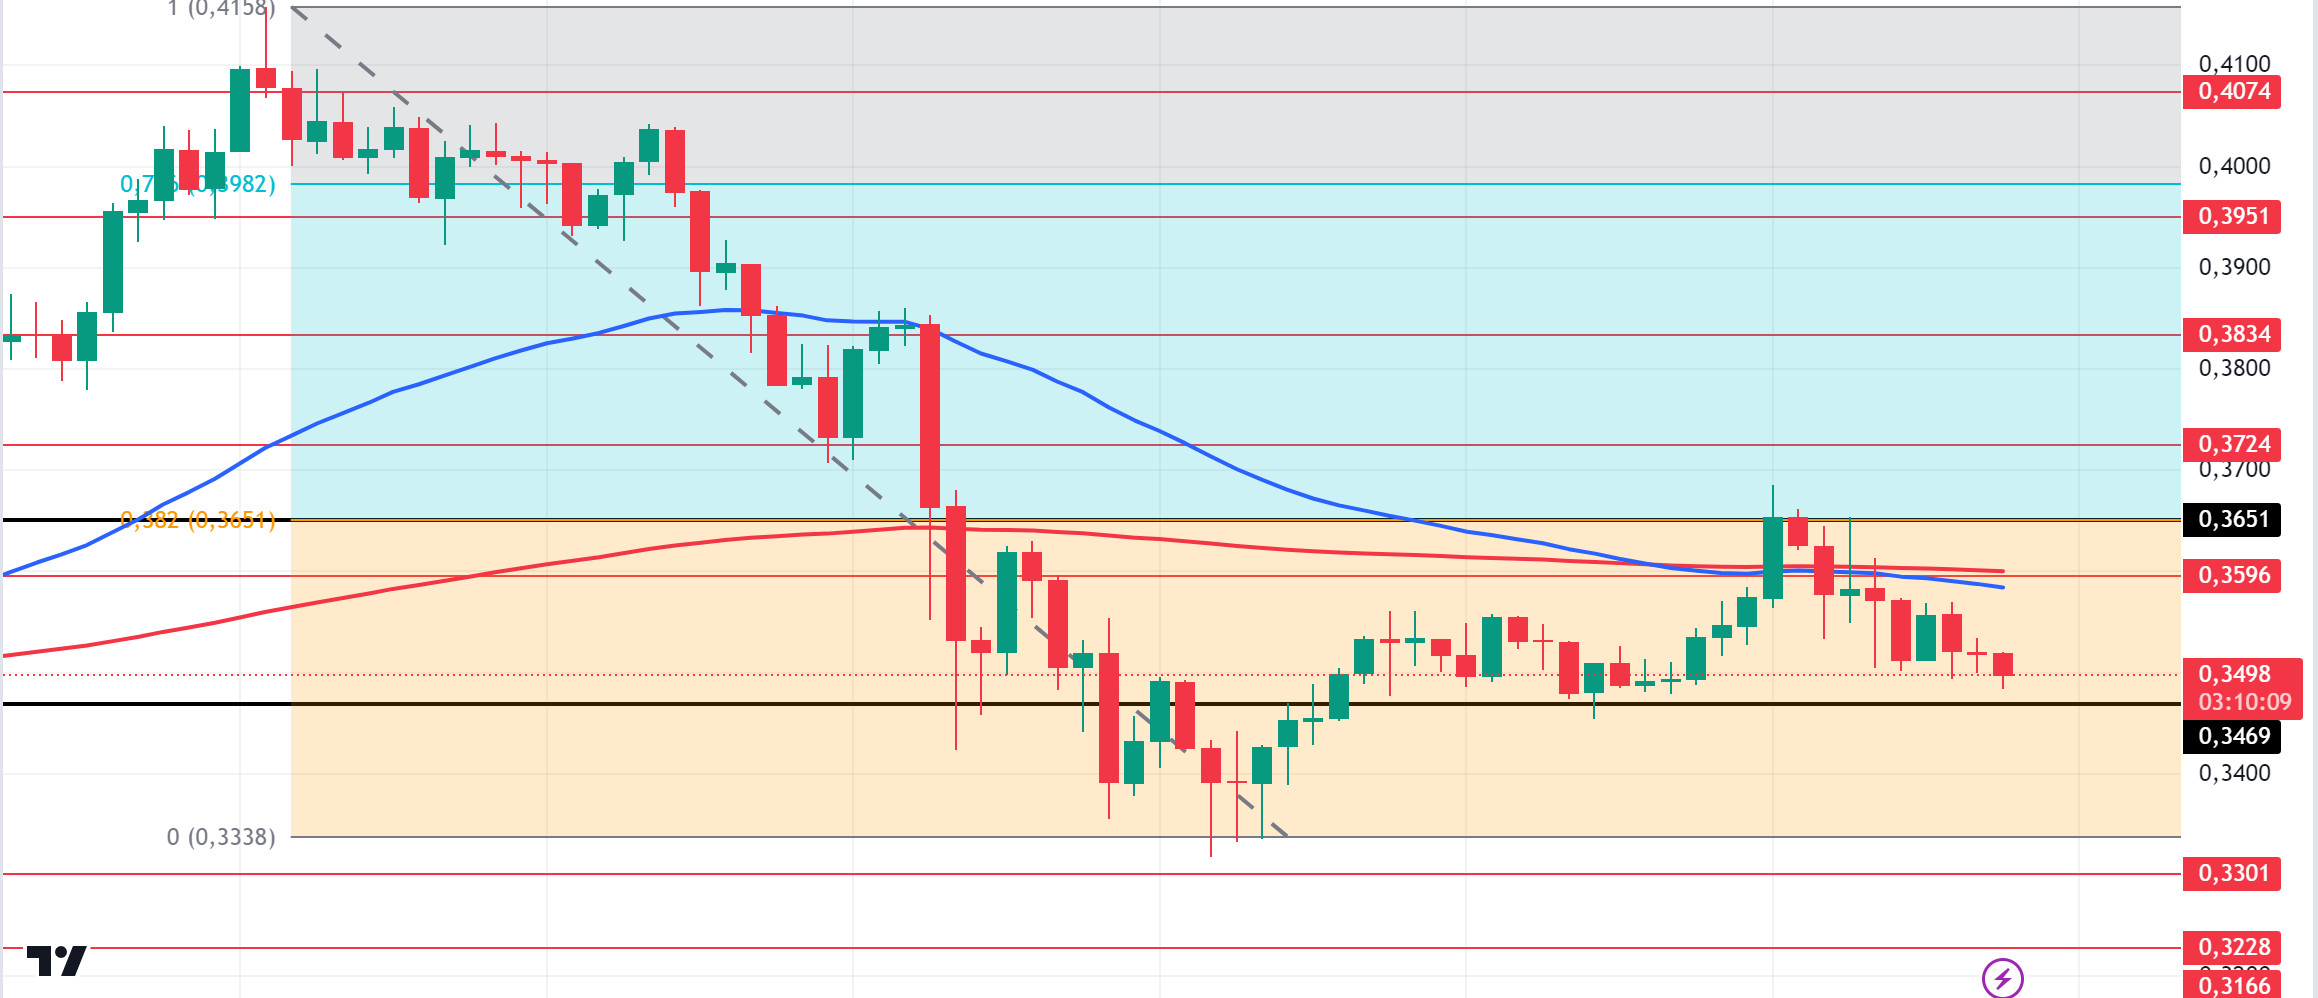
On the 4-hour chart, the 50 EMA has broken the 200 EMA to the downside. This may be a sign that the decline in ADA may deepen. On the other hand, when we look at the Fibonacci retracement, the retracement of the decline that started on September 27 has encountered resistance at the fibonacci value of 0.382 (0.3651). The 0.3469 level stands out as a strong support in the pullbacks to be experienced with possible political and macroeconomic news. If the positive mood in the ecosystem continues, the 0.3651 level should be followed as a strong resistance.
Supports 0.3469 – 0.3301 – 0.3228
Resistances 0.3596 – 0.3651 – 0.3724
AVAX/USDT
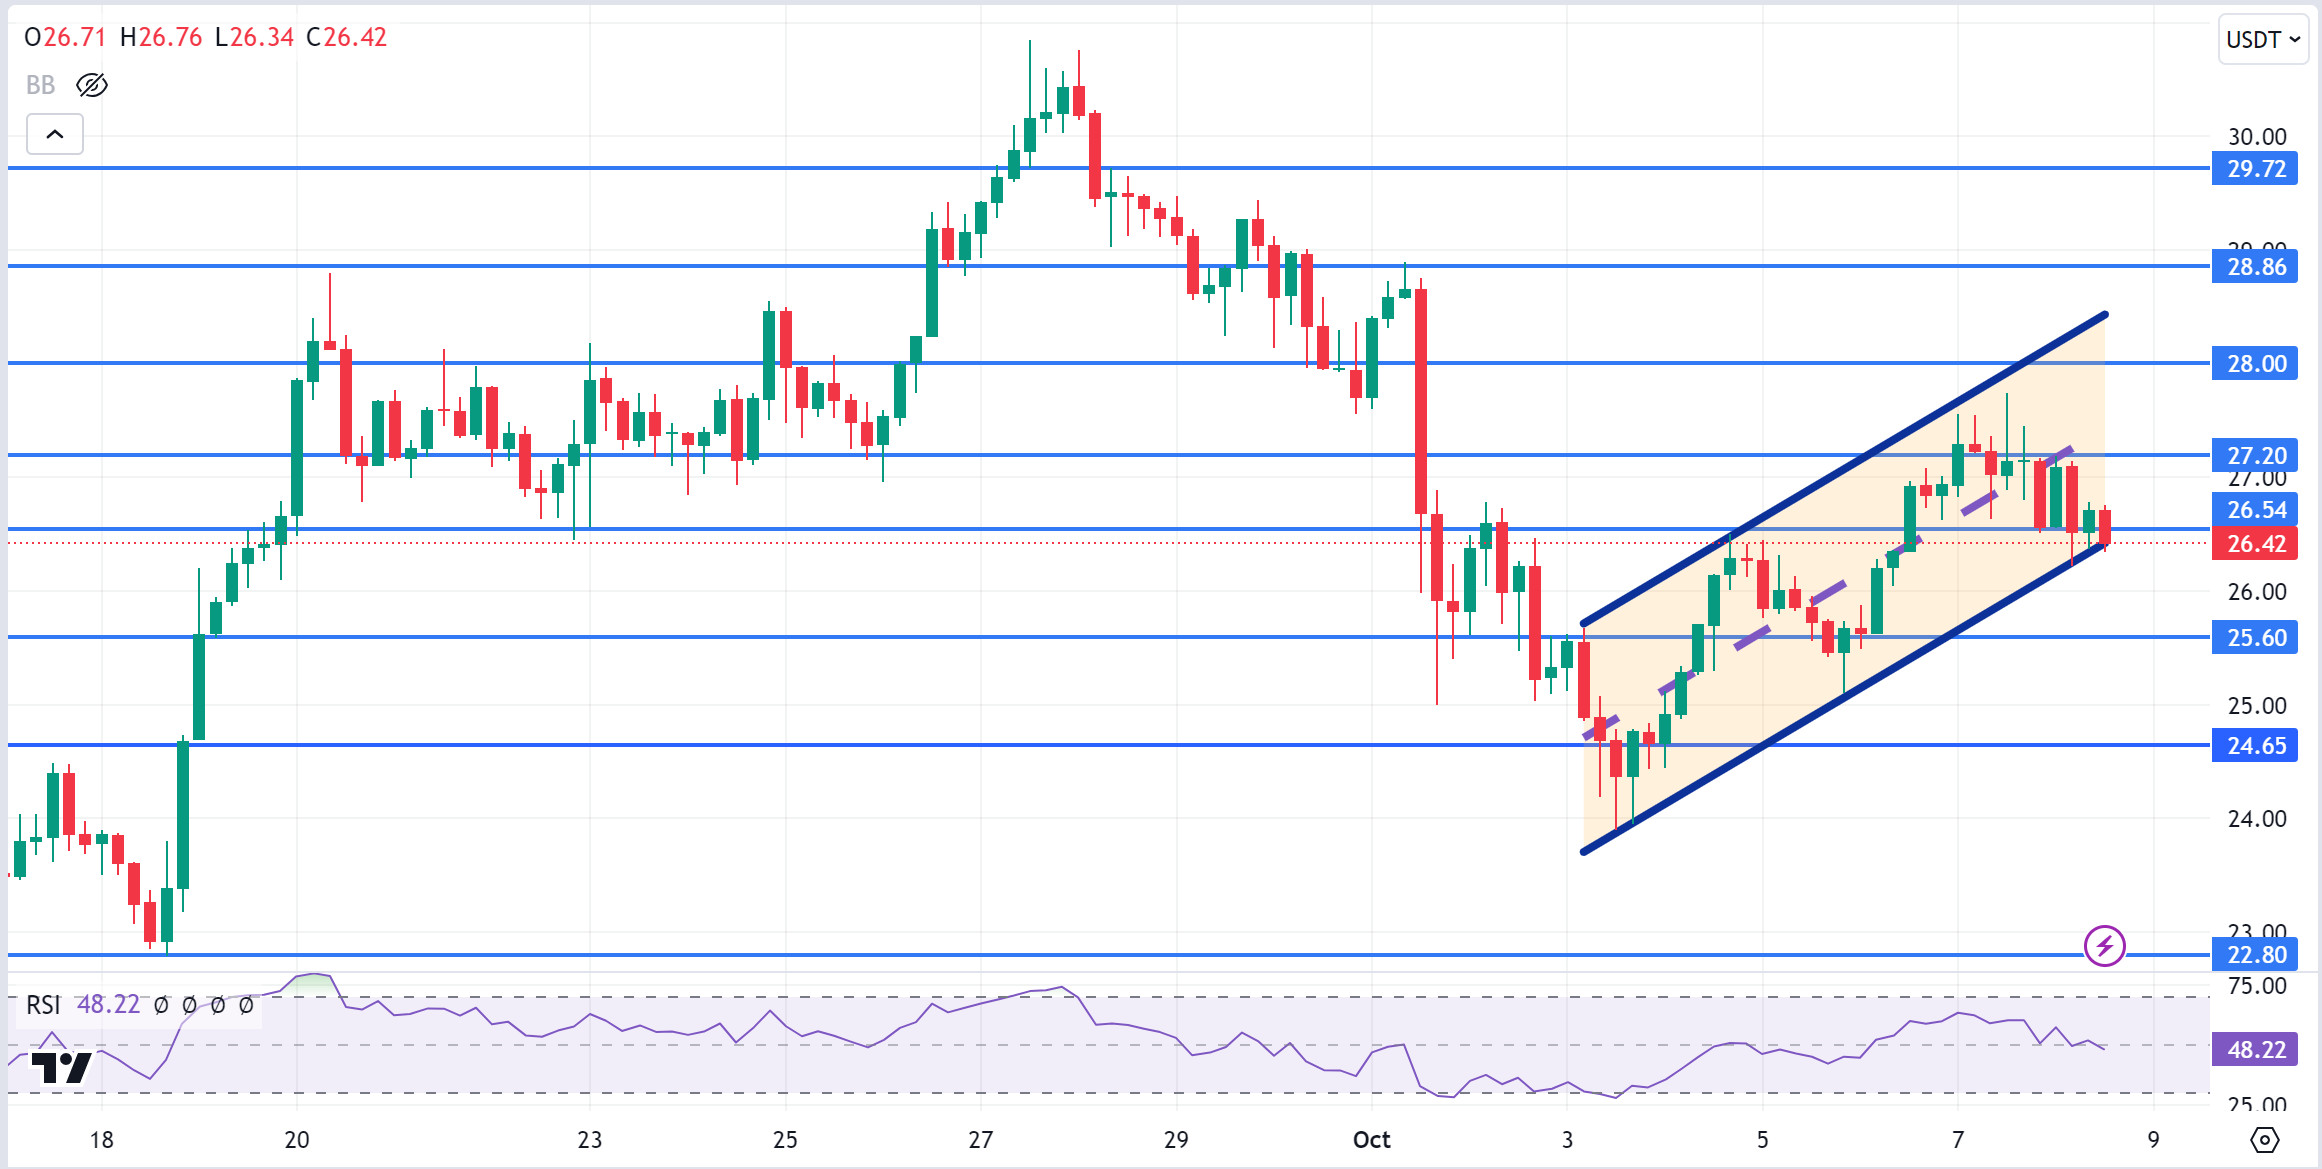
AVAX, which opened today at 26.57, fell slightly during the day and is trading at 26.42. There is no planned data coming from the US today. Therefore, it is likely to be a day with limited price movement. News flows from the Middle East will be important for the market.
On the 4-hour chart, it moves within the ascending channel. It is in the lower band of the ascending channel and with the RSI 48 value, it can be expected to rise slightly from these levels. In such a case, it may move to the middle band of the channel and test the 27.20 resistance. However, selling pressure may increase with the candle closing below 26.54 support. In such a case, it may test 25.60 support. As long as it stays above 24.65 support during the day, the desire to rise may continue. With the break of 24.65 support, sales may increase.
Supports 26.54 – 25.60 – 24.65
Resistances 27.20 – 28.00 – 28.86
TRX/USDT
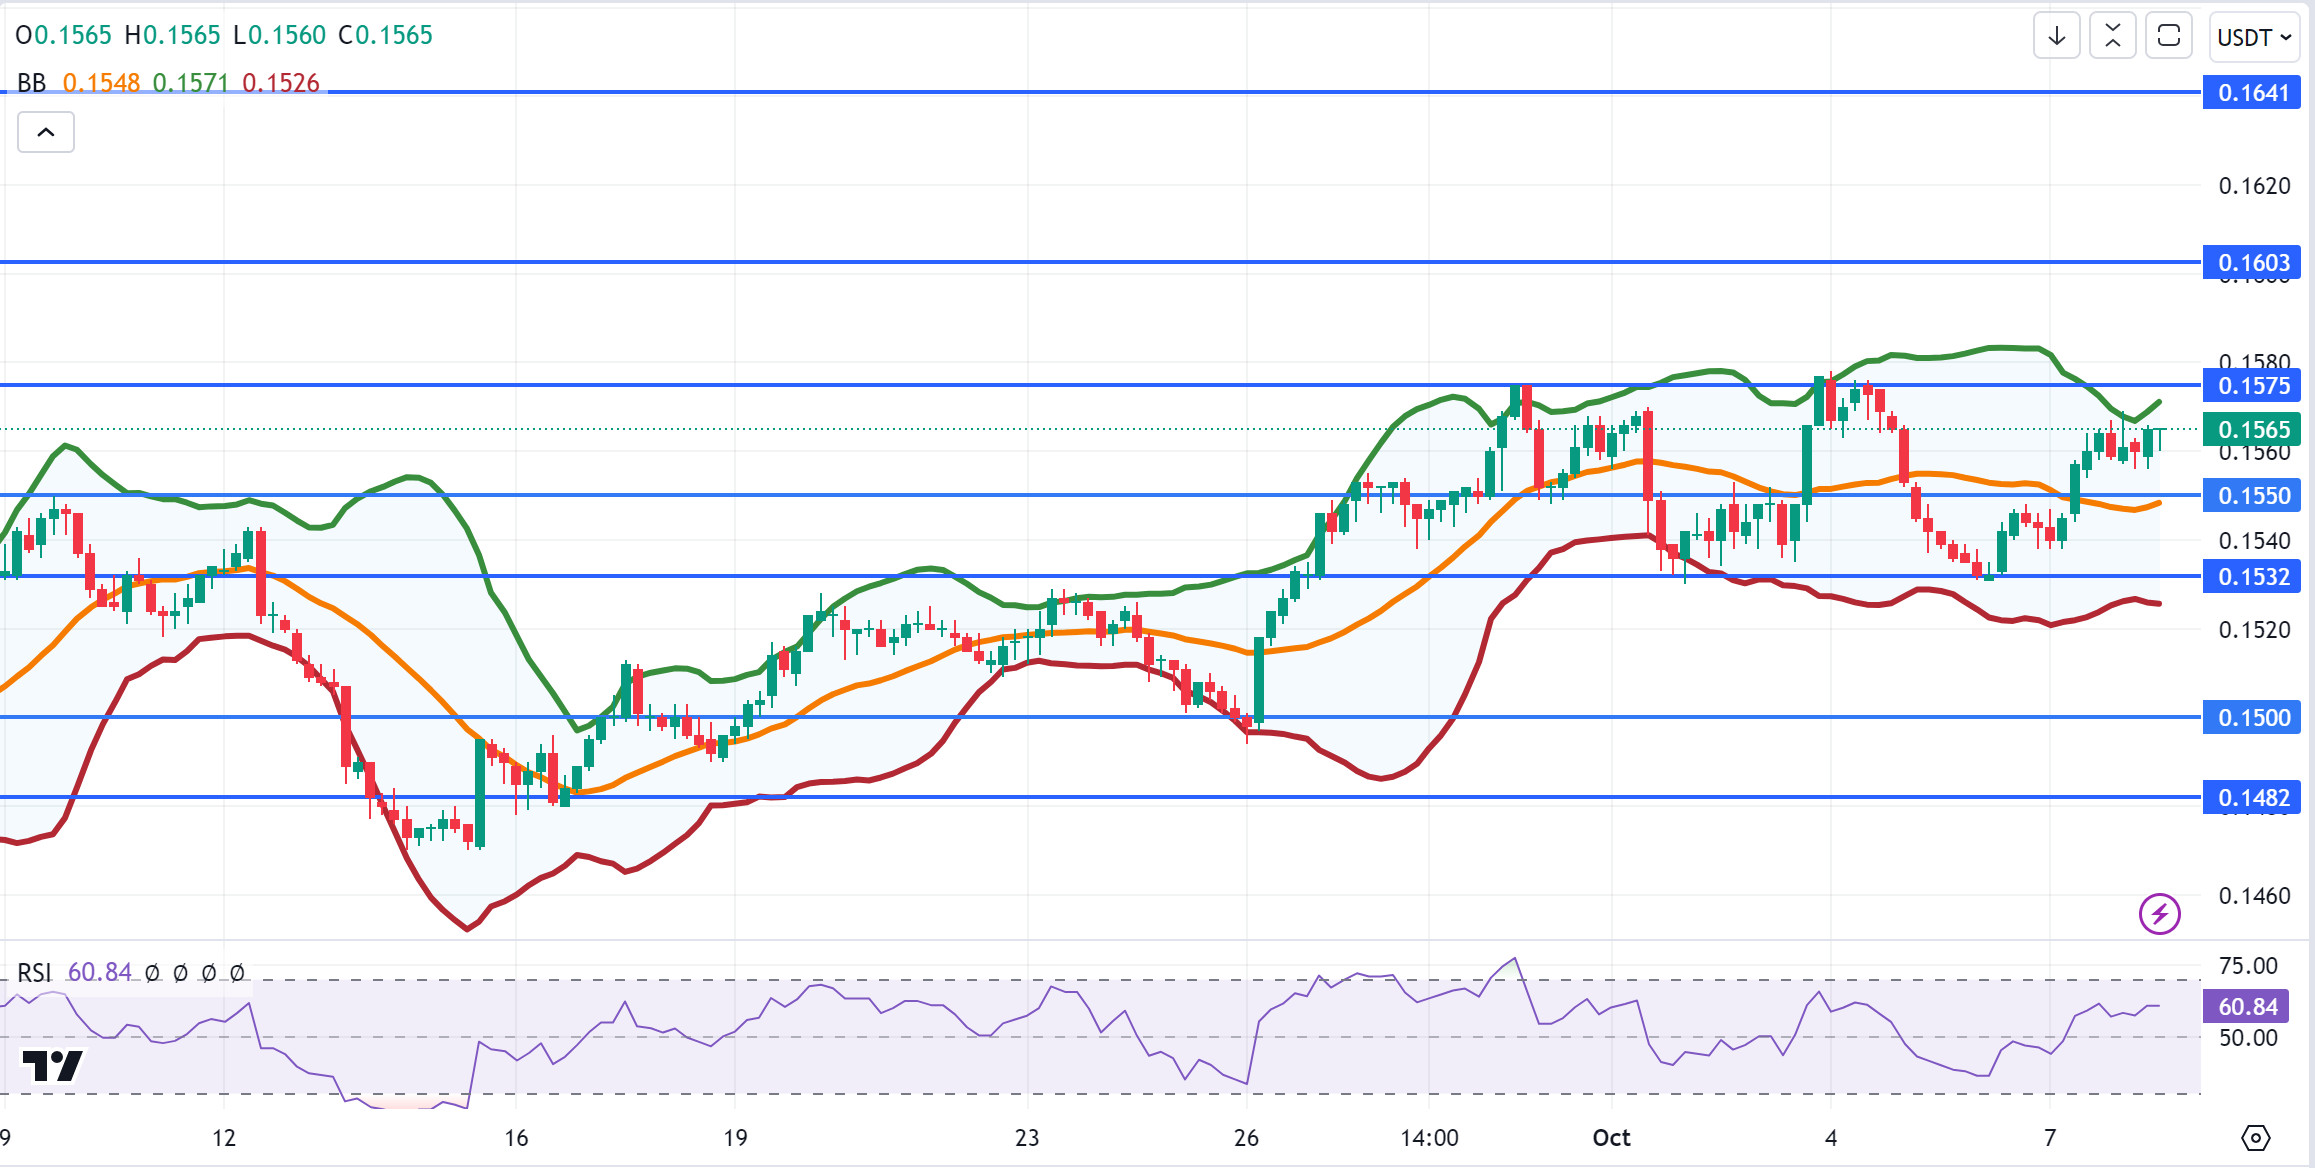
TRX, which started today at 0.1558, rose slightly during the day and is trading at 0.1565. There is no scheduled data expected to affect the market today. The market will be closely following the news flows regarding the tension in the Middle East. On the 4-hour chart, it is in the Bollinger upper band and can be expected to decline slightly from its level with the RSI value of 60. In such a case, it may move to the Bollinger middle band and test the 0.1550 support. If the tension in the Middle East decreases, it may test 0.1575 resistance with increased purchases. As long as TRX stays above 0.1482 support, the desire to rise may continue. If this support is broken downwards, sales can be expected to increase.
Supports 0.1550 – 0.1532 – 0.1500
Resistances 0.1575 – 0.1603 – 0.1641
XRP/USDT
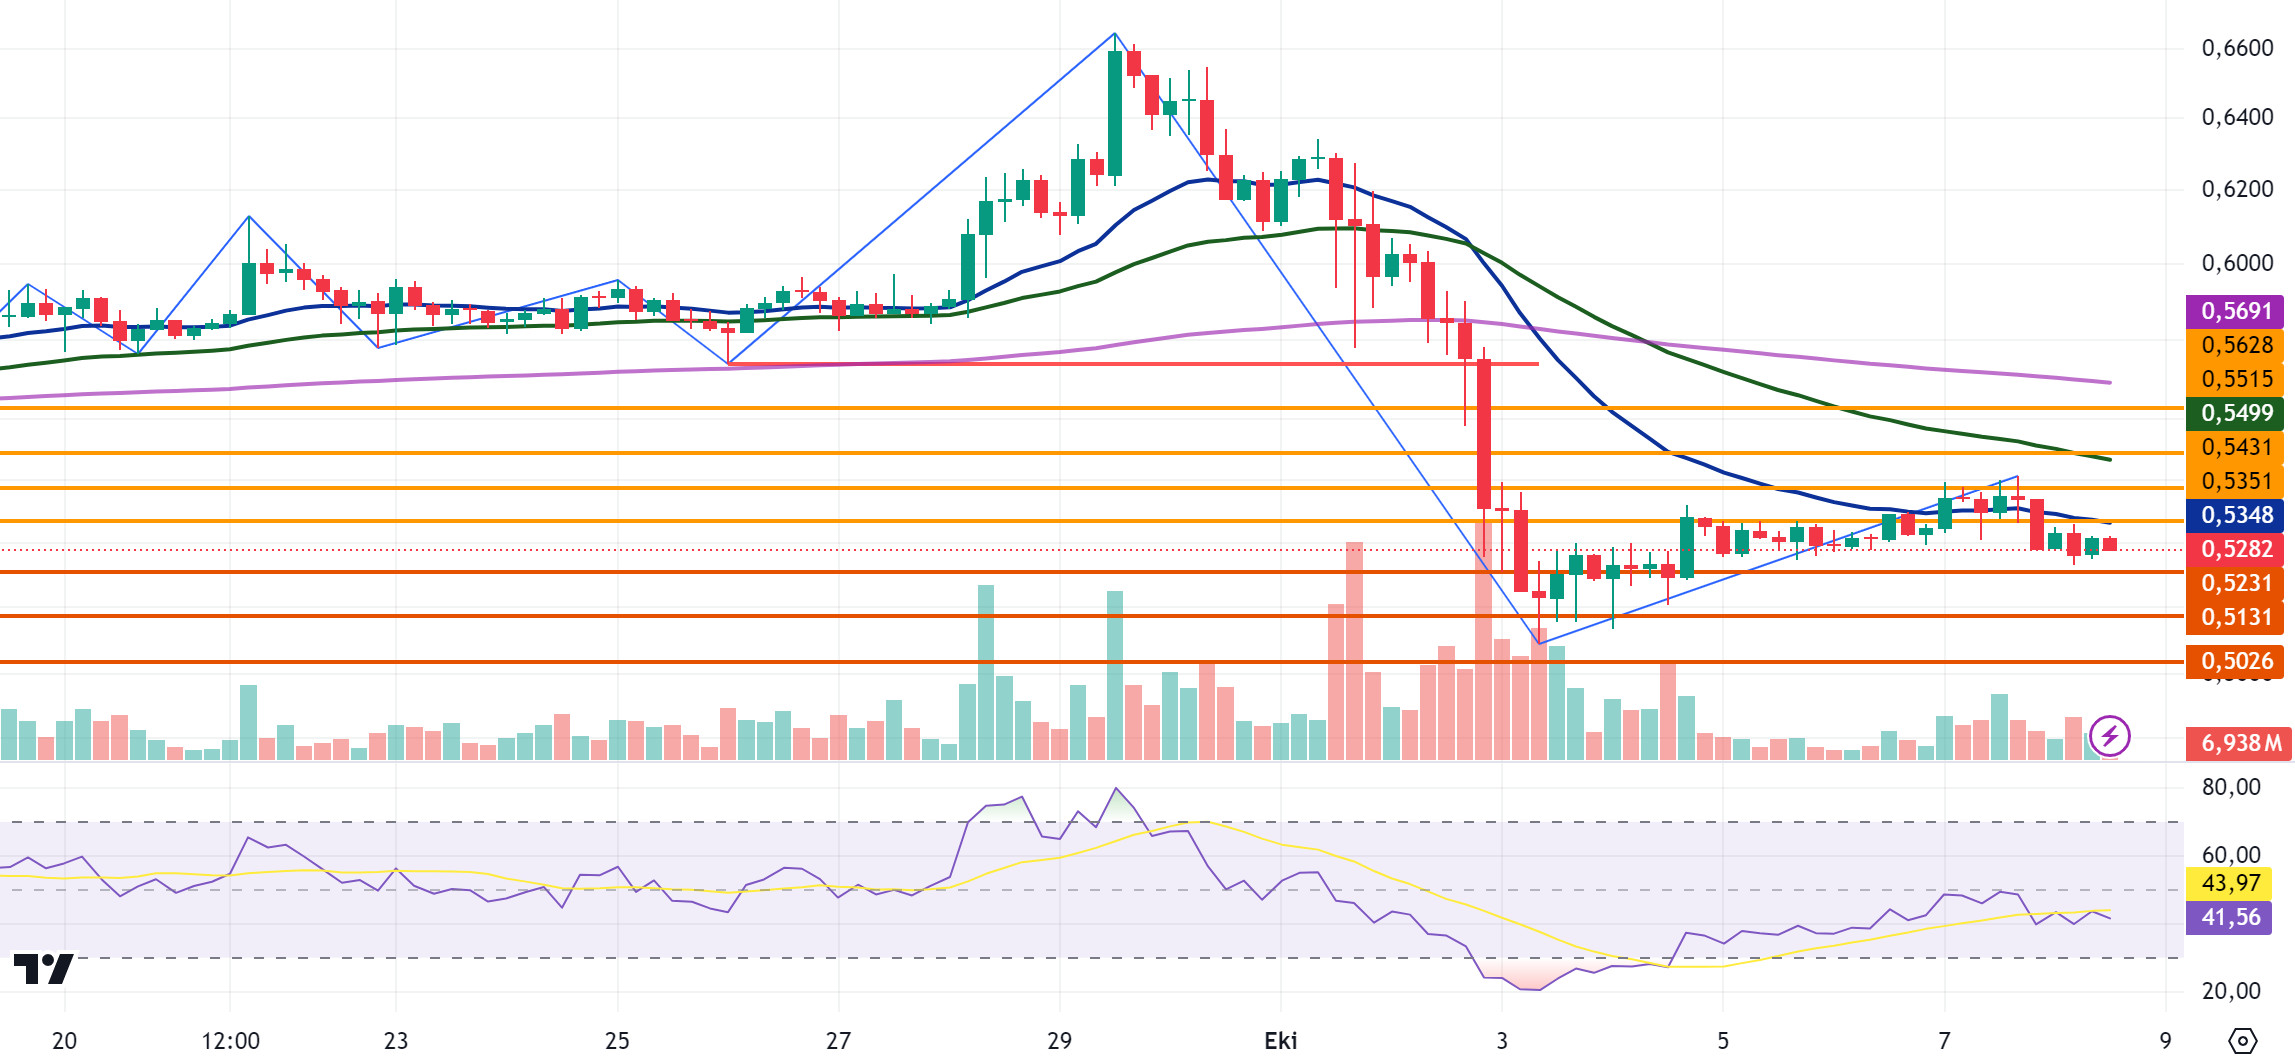
XRP continues to move within the horizontal band in the 4-hour analysis and is currently trading at 0.5282 at the start of the day. According to RSI data, XRP, which is neither in the overbought nor oversold zone, in the neutral zone, may continue to move within the horizontal band in this process. In the 4-hour analysis, the fact that it is located below the EMA levels creates selling pressure on it, and if it declines with this selling pressure, it may test the support levels of 0.5231-0.5131-0.5026. If it rises with the positive developments that may come, it may test the resistance levels of 0.5351-0.5431-0.5515.
As it continues to trade within the horizontal band, XRP may experience momentary declines and rises and may offer short-term trading opportunities. On its rise, it may decline with possible sales at EMA20 and 0.535 and may offer a short trading opportunity. In its decline, it may rise with possible purchases at 0.52 and may offer a long trading opportunity.
EMA20 (Blue Line) – EMA50 (Green Line) – EMA200 (Purple Line)
Supports 0.5231 – 0. 5131 – 0.5026
Resistances 0.5351 – 0.5431 – 0.5515
DOGE/USDT
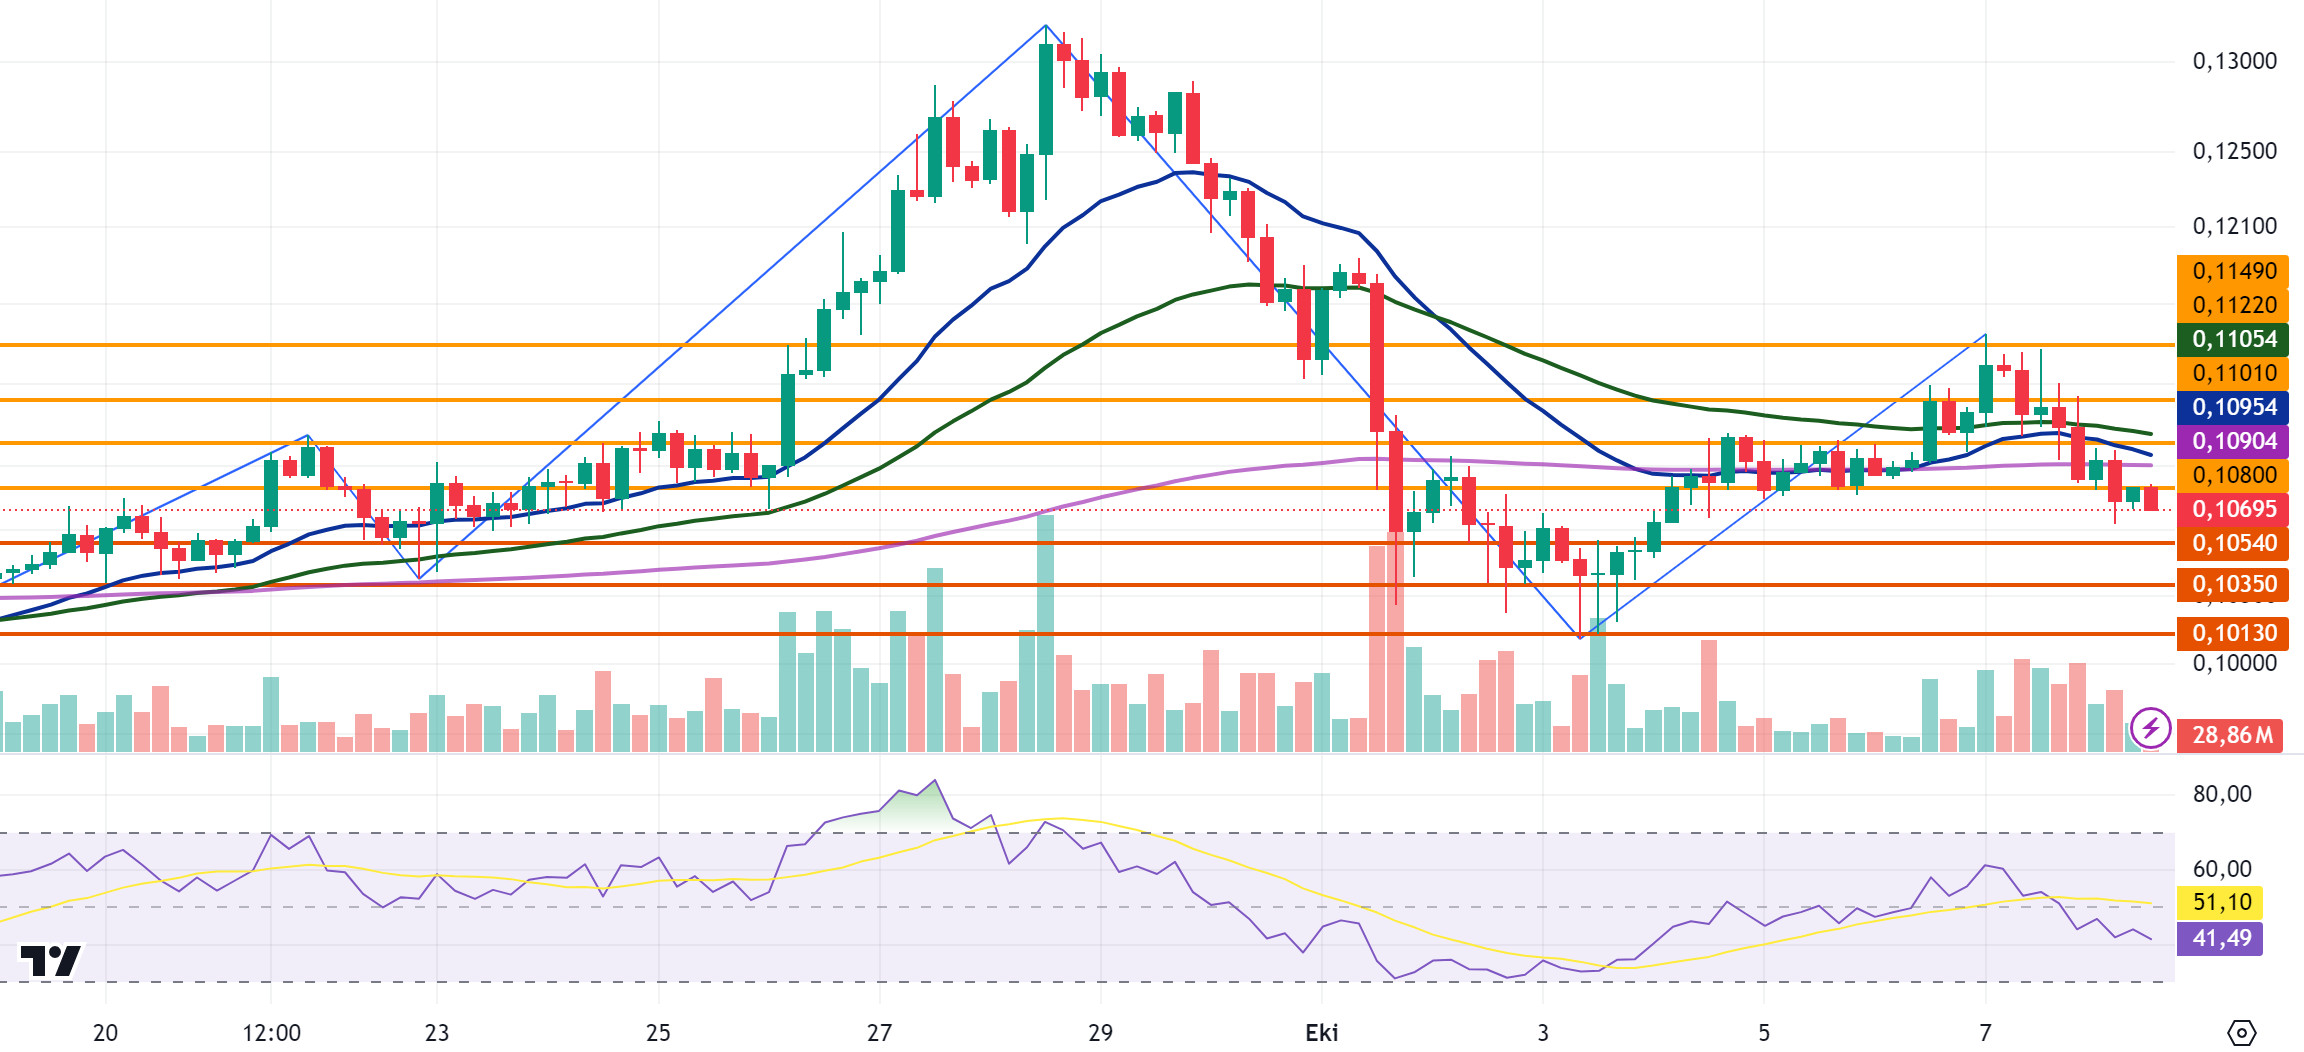
After rising as high as 0.115 with the DOGE rise, it fell as low as 0.106 yesterday and today. DOGE, which fell as low as 0.1062 in the 4-hour analysis today, recovered from the purchases and is currently trading in a horizontal band at 0.1069. In the 4-hour analysis, DOGE, which is located below the EMA levels, continued to decline with selling pressure as in the crypto market. With the continuation of selling pressure, DOGE may test the support levels of 0.1054- 0.1035-0.1013 in the continuation of the decline. If it starts to rise, it may test 0.1080-0.1101-0.1122 resistance levels with its rise. We see a decline in the RSI (14) data, but with a value of 41.49, it is in the neutral zone in neither overbought nor oversold zone and it can be predicted that the movement within the horizontal band will continue. While moving within the horizontal band, it may decline with the sales that may come from the EMA levels in its rise and may offer a short trading opportunity.
EMA20 (Blue Line) – EMA50 (Green Line) – EMA200 (Purple Line)
Supports 0.1054 – 0.1035 – 0.1013
Resistances 0.1080 – 0.1101 – 0.1122
DOT/USDT
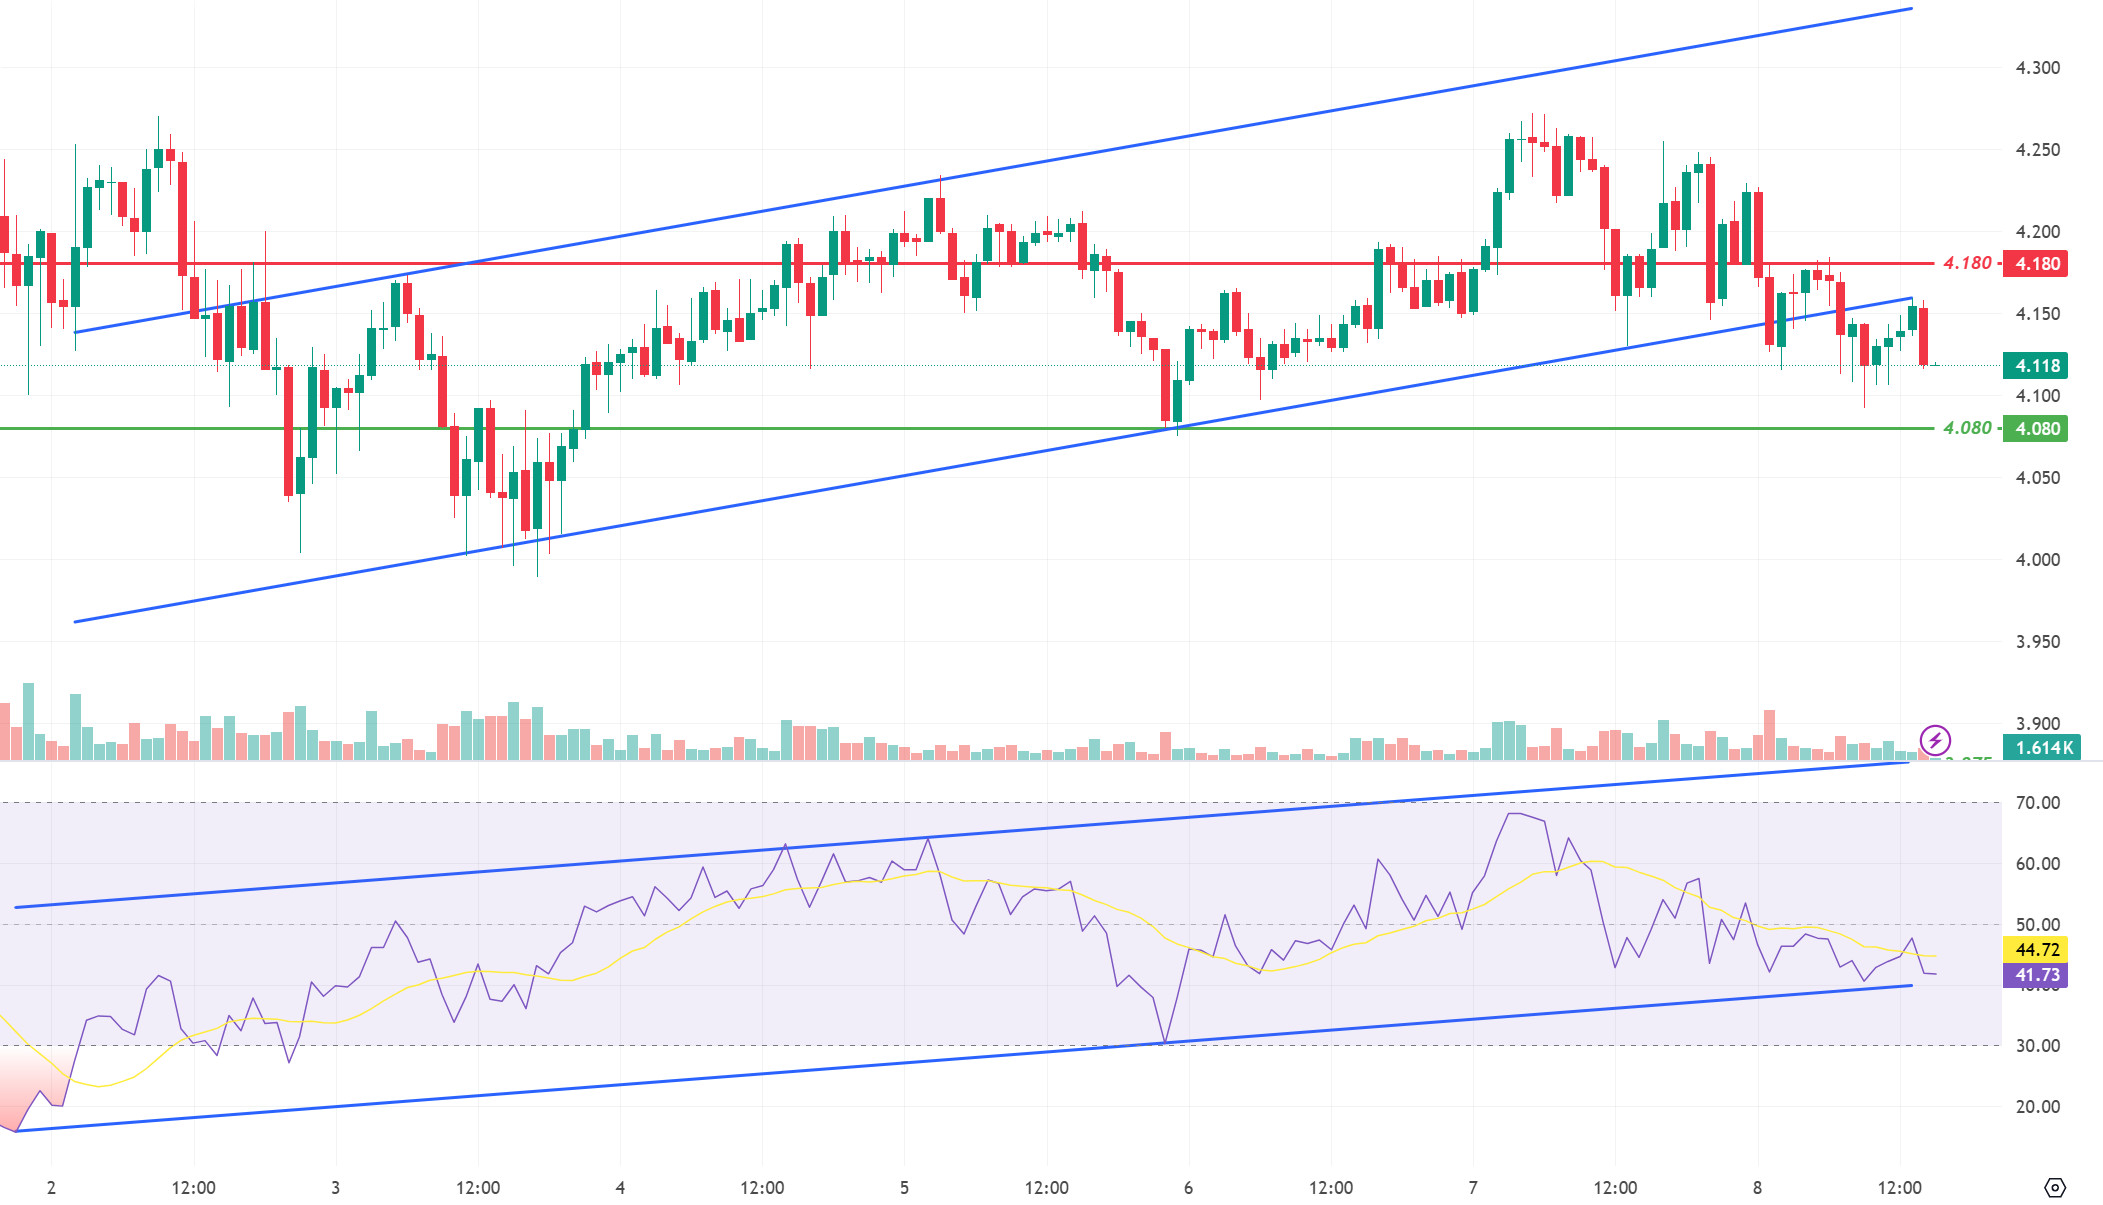
On the Polkadot (DOT) chart, the price broke the lower band of the ascending channel. With the reaction from the 4.180 resistance level, DOT, which broke down the lower band of the rising channel, is moving towards the 4.080 support level. When we examine the RSI, we see that it is moving towards the lower band of the channel. In the negative scenario, if the price does not get a reaction from the 4.080 level, it may retreat towards 3.975 levels. On the other hand, if the buying pressure rises, the price may want to break the selling pressure in the 4,180 band, which is the first resistance level if the price re-enters the channel.
Supports 4.080 – 3.975 – 3.875
Resistances 4.180 – 4.210 – 4.265
SHIB/USDT
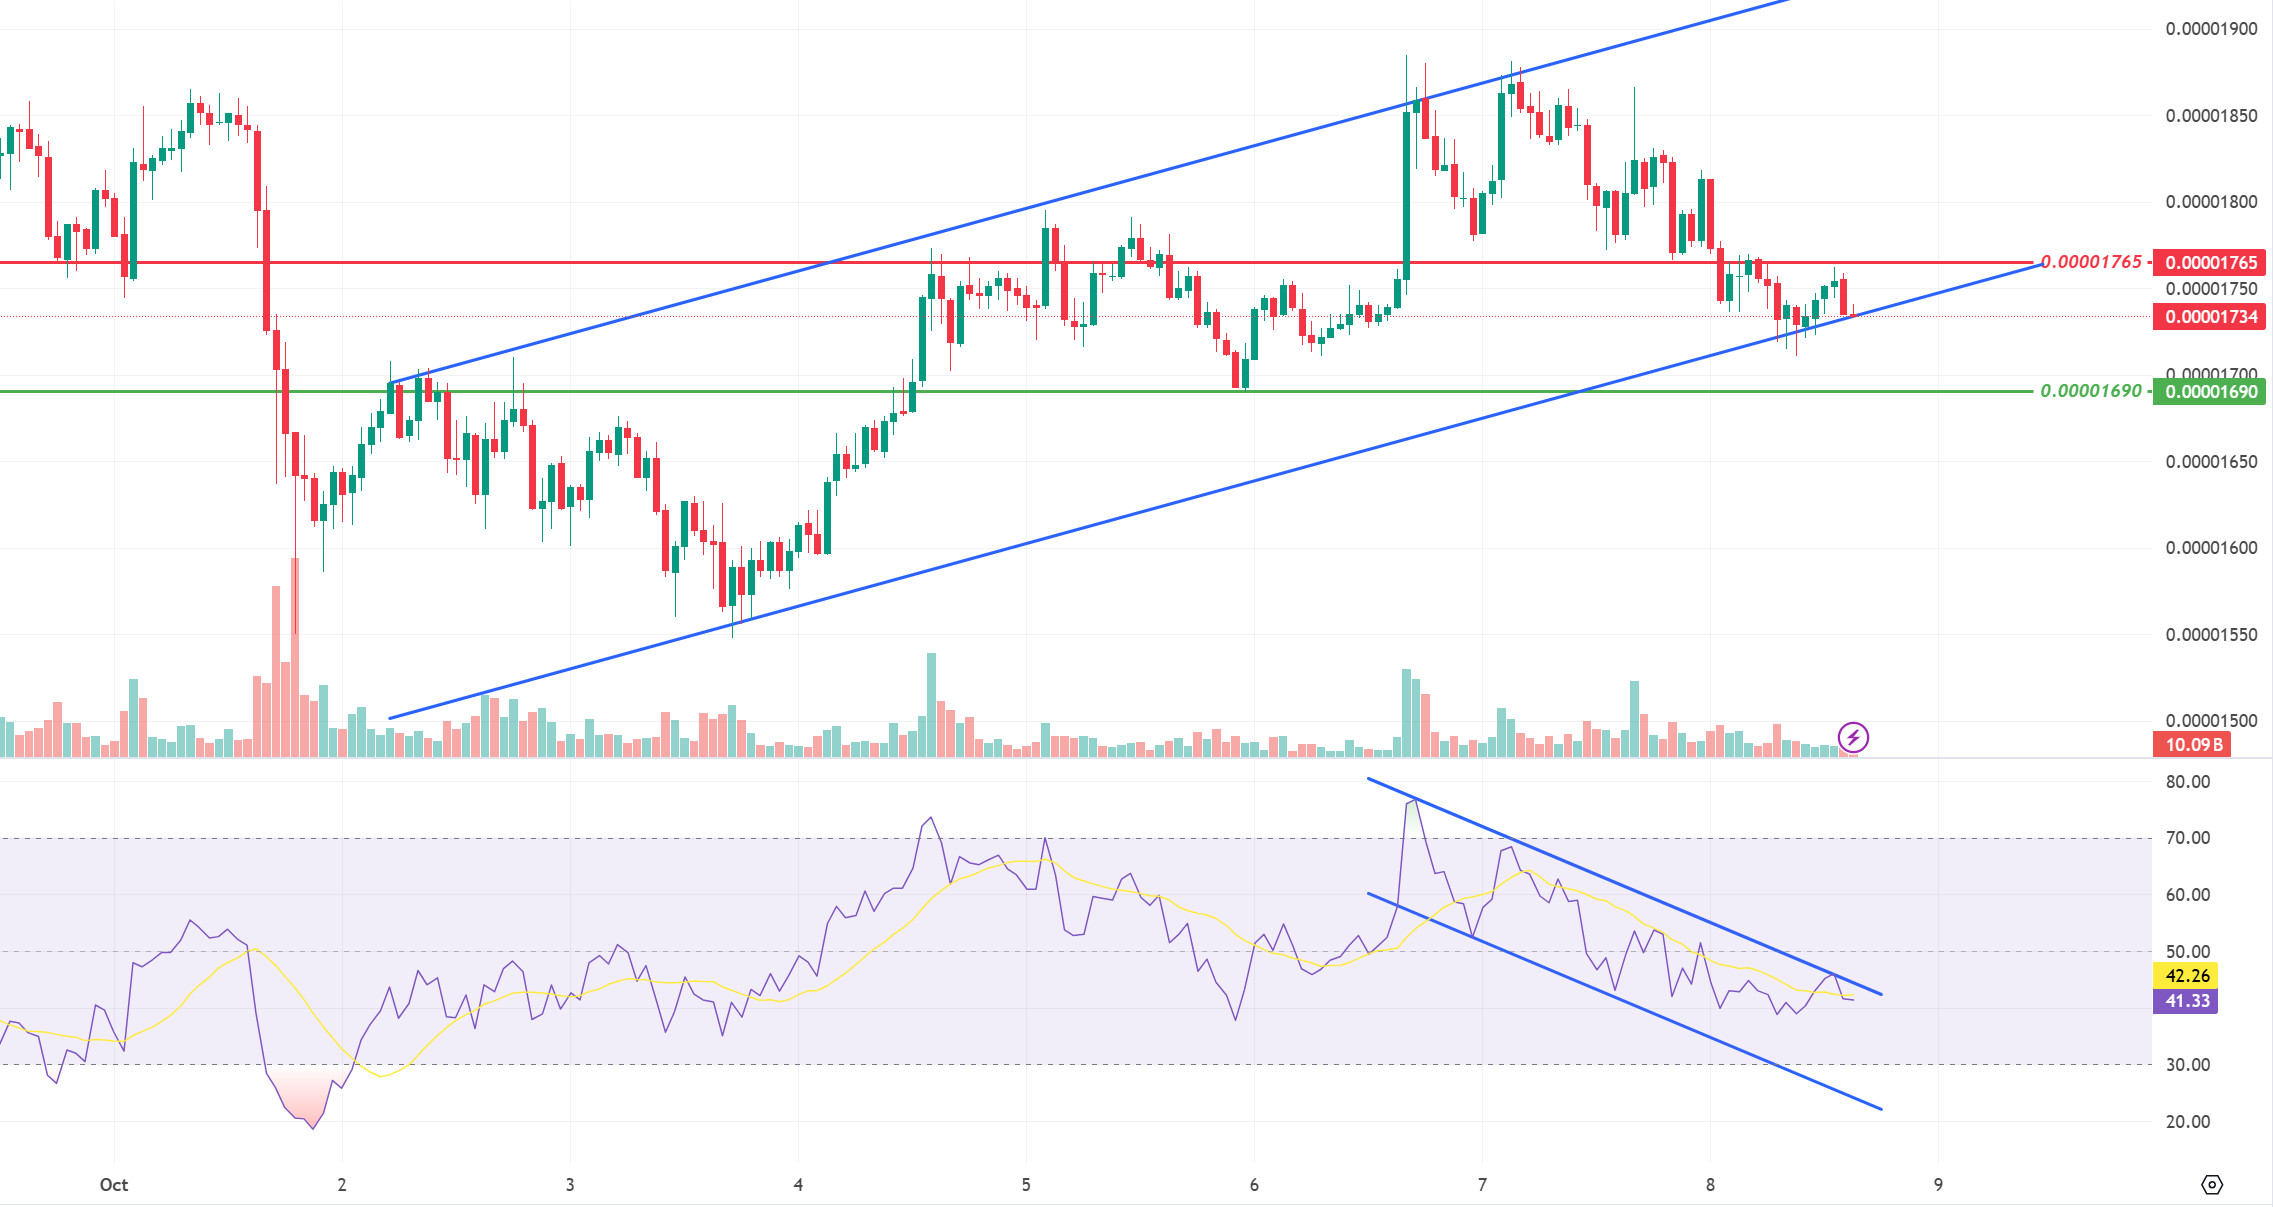
Shiba Inu (SHIB) seems to have managed to stay in the channel with the reaction it received from the lower band of the channel. Retesting the 0.00001765 level, SHIB cannot break the selling pressure at the 0.00001765 resistance and remains horizontal in the lower band of the channel. When we examine the RSI, we see that it moves towards the upper band within the falling channel. With the RSI line breaking the upper band of the falling channel, the price may want to break the selling pressure at 0.00001765. On the other hand, if the RSI falls by reacting from the upper band of the falling channel, the price may retreat towards 0.00001690 levels.
Supports 0.00001690 – 0.00001630 – 0.00001565
Resistances 0.00001765 – 0.00001810 – 0.00001895
LEGAL NOTICE
The investment information, comments and recommendations contained herein do not constitute investment advice. Investment advisory services are provided individually by authorized institutions taking into account the risk and return preferences of individuals. The comments and recommendations contained herein are of a general nature. These recommendations may not be suitable for your financial situation and risk and return preferences. Therefore, making an investment decision based solely on the information contained herein may not produce results in line with your expectations.
