MARKET SUMMARY
Latest Situation in Crypto Assets
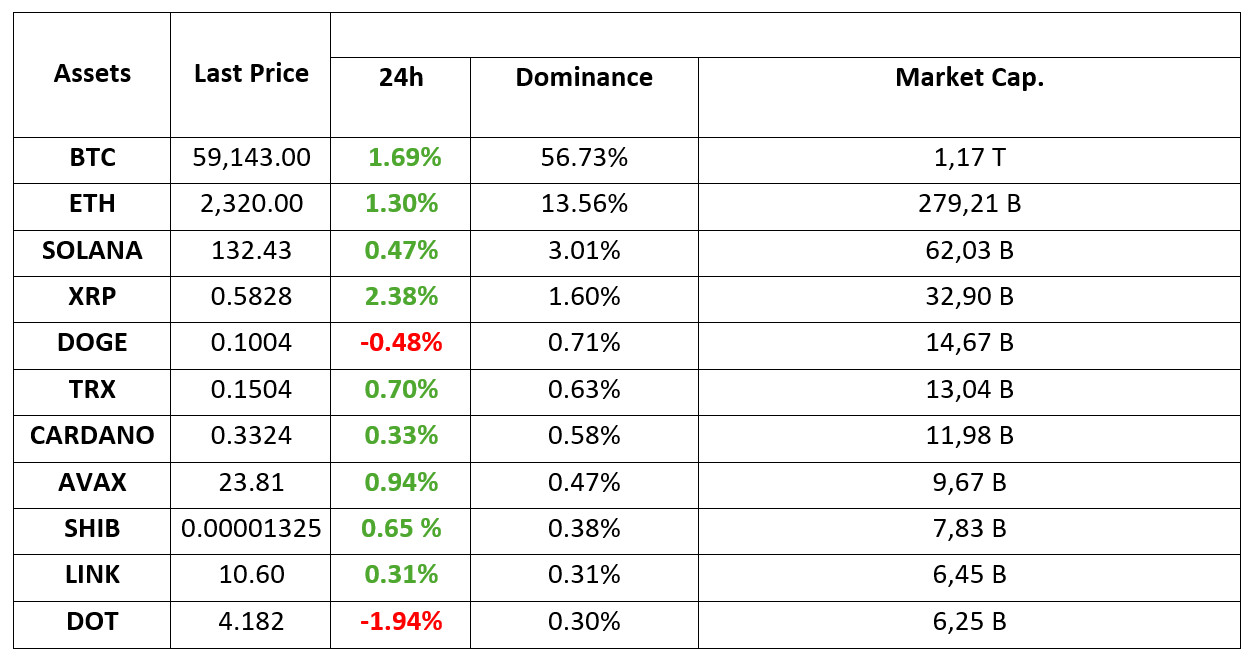
*Prepared on 17.09.2024 at 14:00 (UTC)
WHAT’S LEFT BEHIND
How the expectation of 50 basis points from the Fed rose from 2 percent to 67 percent
The Fed’s 50 basis point cut expectation, which fell to 2% last week, reached 67% within hours. Although there is no new development, such a situation is attributed to two mysterious reports by the Wall Street Journal and the Financial Times.
Details of Donald Trump’s crypto project
The details of World Liberty Financial (WLF), the crypto project of US presidential candidate Donald Trump, were announced in a Space broadcast at night. According to the details given, the project token will be WLFI. 63% of the tokens will be reserved for the general audience, 17% for user rewards and 20% for the project team and advisors.
Asia’s smallest country mines $760 million worth of Bitcoin
Bhutan, the small country of Asia, was found to have 760 million dollars worth of Bitcoin. The country, which has 13 thousand Bitcoins, obtained all BTCs from mining activities.
HIGHLIGHTS OF THE DAY

INFORMATION
*The calendar is based on UTC (Coordinated Universal Time) time zone. The economic calendar content on the relevant page is obtained from reliable news and data providers.
The news in the economic calendar content, the date and time of the announcement of the news, possible changes in the previous, expectations and announced figures are made by the data provider institutions. Darkex cannot be held responsible for possible changes that may arise from similar situations.
MARKET COMPASS
Ahead of the critical Federal Open Market Committee (FOMC) announcements tomorrow, markets focused on the US retail sales data today. In August, retail sales, which were expected to decline by 0.2% compared to the previous month, recorded a 0.1% increase, while the previously announced data for July, which pointed to a 1% increase, was revised to 1.1% with today’s report. Retail sales, excluding automobile sales, came in at 0.1%, below the expectations of 0.2%.
After the release of these data, the US dollar and US 10-year bond yields rose. According to CME FedWatch data, there was no major change in the probability of a 50 bps rate cut by the FOMC tomorrow. The markets still see a higher probability of a 50 basis points rate cut from the US Federal Reserve tomorrow than 25 (50 basis points – 65%). On the other hand, Bitcoin recovered somewhat after its recent losses.
We assess the data in a framework that will not prevent a larger rate cut by the FED and will strengthen the expectations that the country’s economy is likely to avoid recession. Nevertheless, contrary to the pricing in the markets, we believe that the FOMC is more likely to cut interest rates by 25 basis points tomorrow.
Although we see limited room for a continuation of positive sentiment for digital assets, we can say that the same is true for downside price action. The notable retracement of the ETH/BTC ratio in recent days reflects the cash inflows and outflows in ETFs, while also pointing to the possibility that BTC may continue to diverge in a possible positive market ecosystem. Accordingly, assuming there are no new and surprising dynamics, we are likely to see a flat but BTC-dominated market. We believe that technical price changes can be monitored until the FED’s interest rate decision is announced.
TECHNICAL ANALYSIS
BTC/USDT
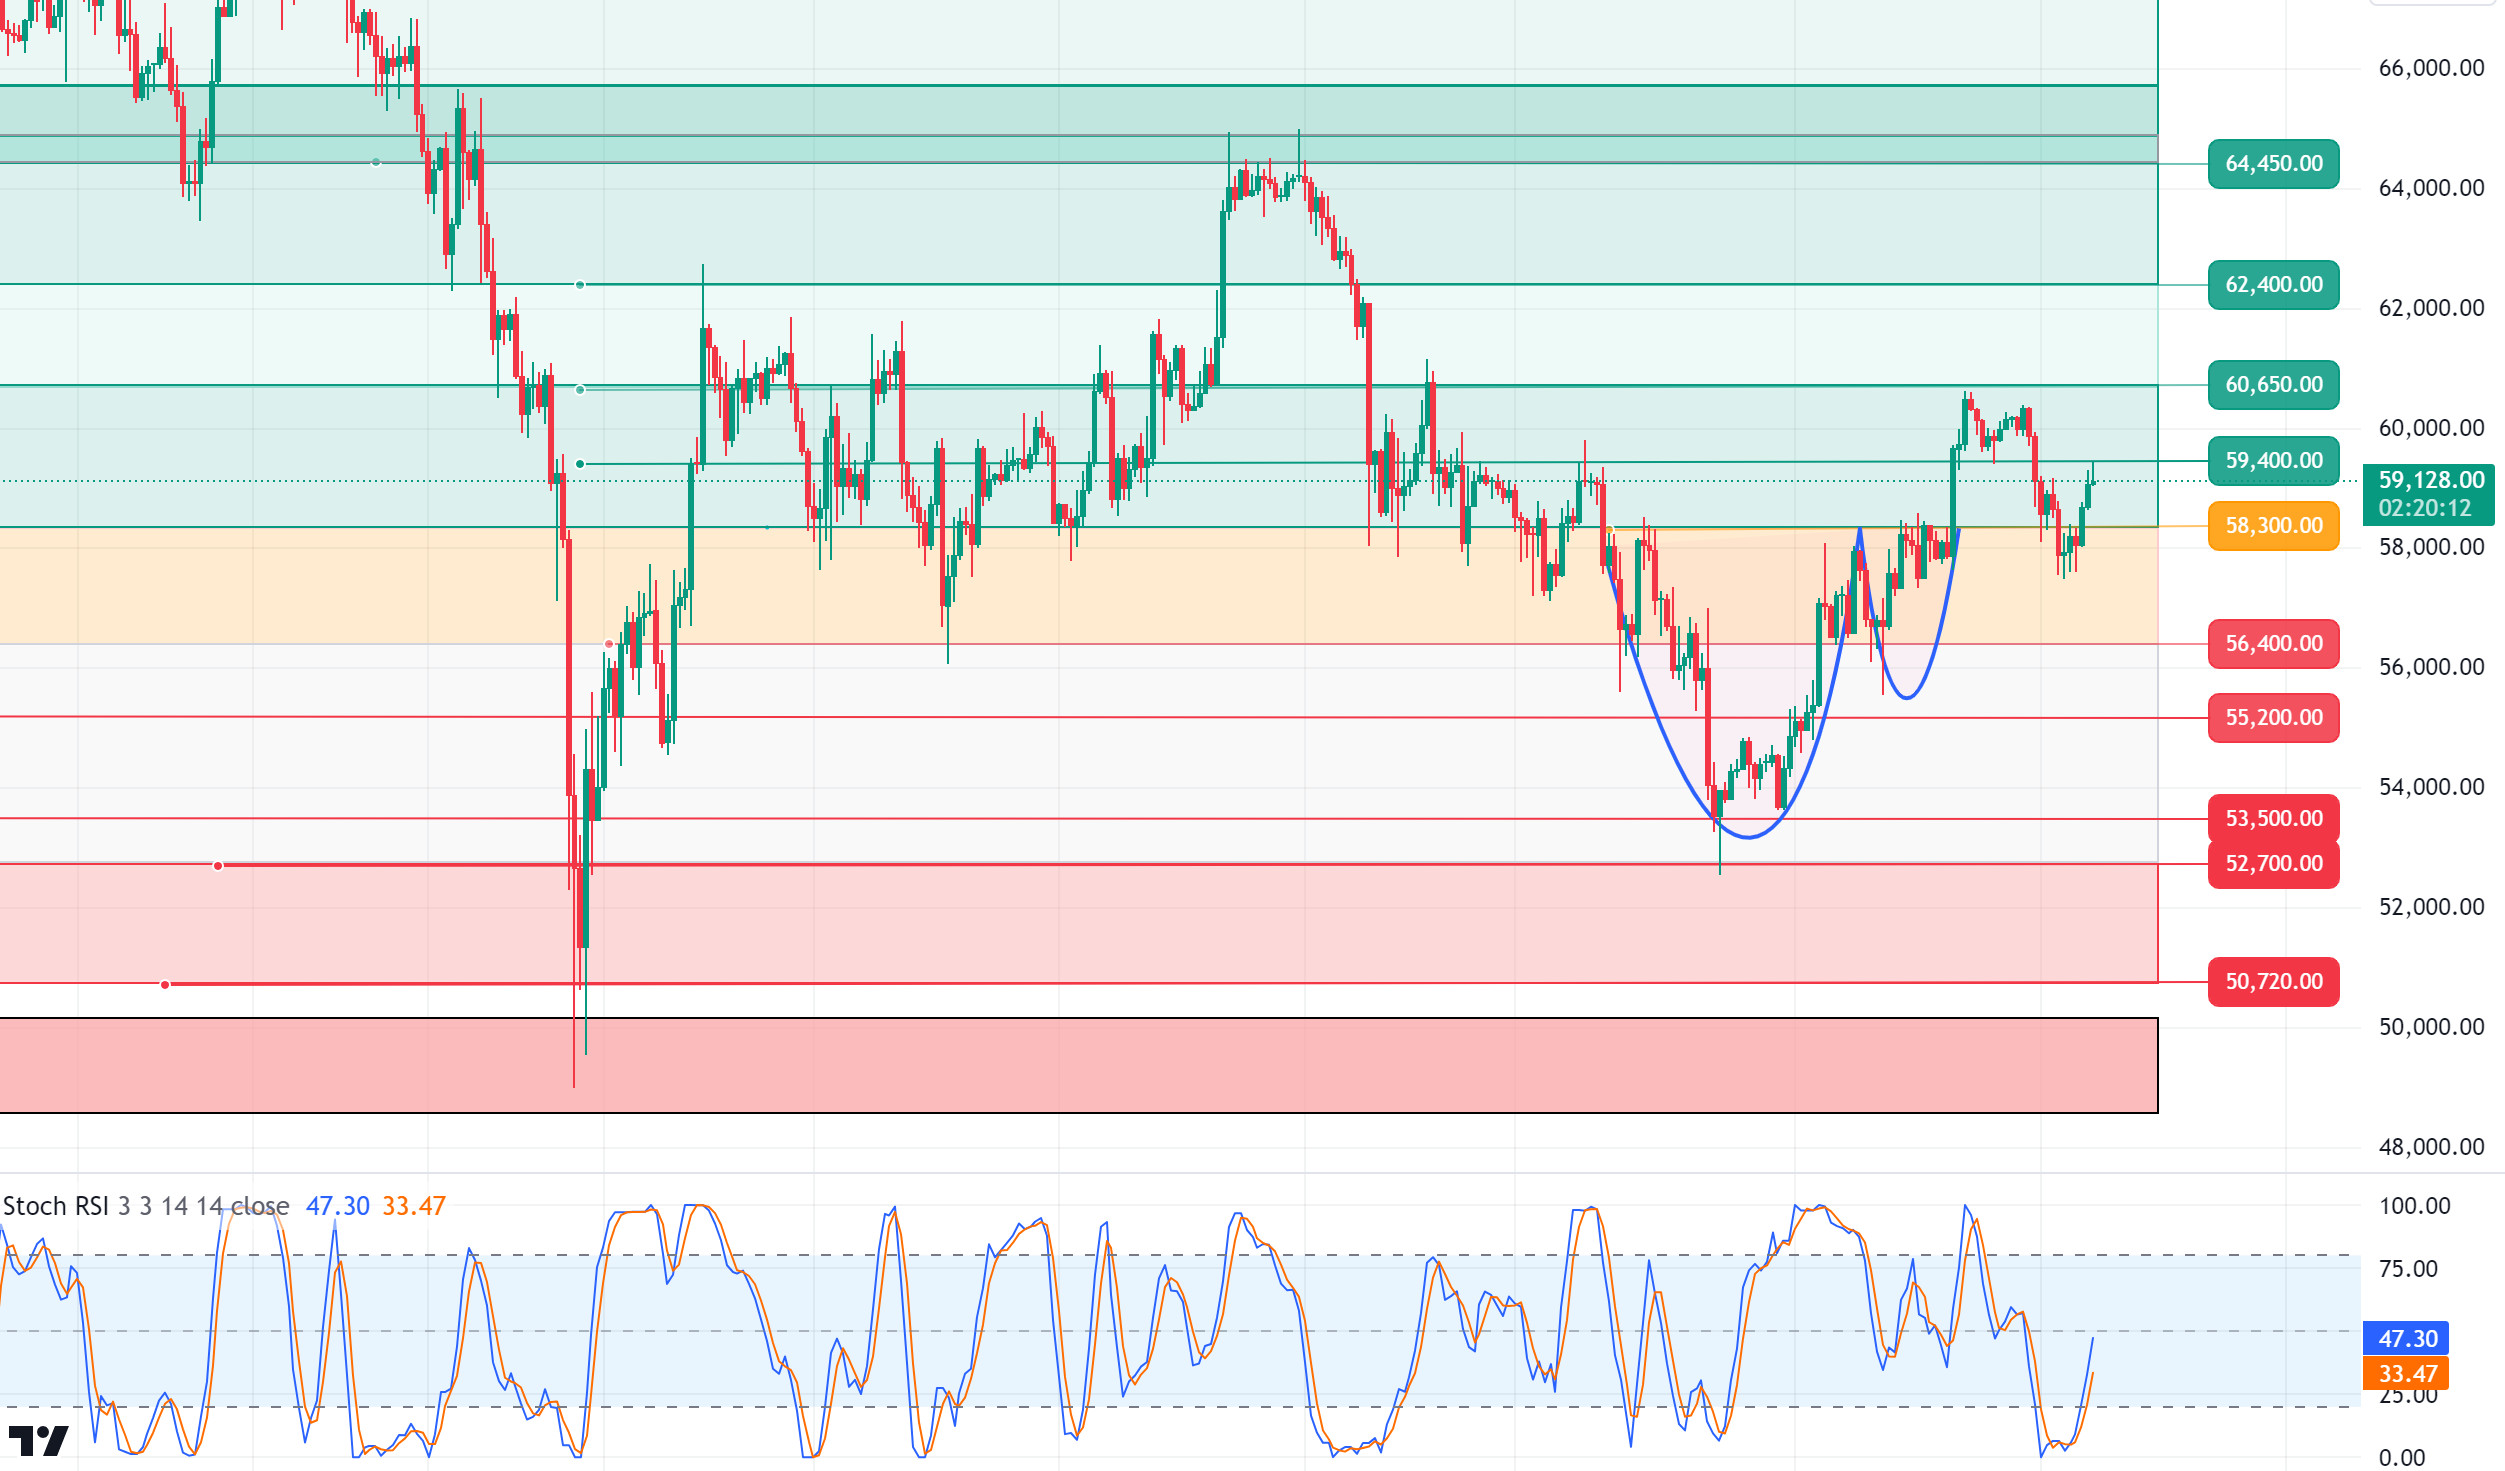
Movement in Bitcoin! In our last analysis before the critical FED interest rate meeting, we especially talked about the effects of the interest rate cut on the market. When we look at it during the day, it seems that there is a waiting in the market news flow. Institutional investors’ increased interest in spot ETFs and Microstrategy’s continued Bitcoin purchases give us a clue about where Bitcoin will go in the long term. In addition, the fact that the Wall Street Journal and Financial Times have recently presented interest rate cut expectation reports over 50 basis points may mean that investors can take action over 50 basis points. In this direction, volatile hours may be waiting for investors who make short-term transactions starting tonight. In the BTC 4-hour technical analysis, we see that the upward movement we mentioned during the day has started. Before the interest rate meeting, there may be a movement to the level of 60,650, which Bitcoin has accumulated for days and appears as psychological resistance, and it is likely to meet the meeting at these levels. As a result of the data that may come in line with expectations, the 60,650 level can be passed upwards quickly. In another scenario, in the event of a 25 basis point cut, it may turn down again with short-term upward mobility, and as a result of increased sales pressure, it may be hard to break through the support zones.
Supports 58,300- 57,200 – 56,400
Resistances 59,400 – 60,650 – 62,400
ETH/USDT
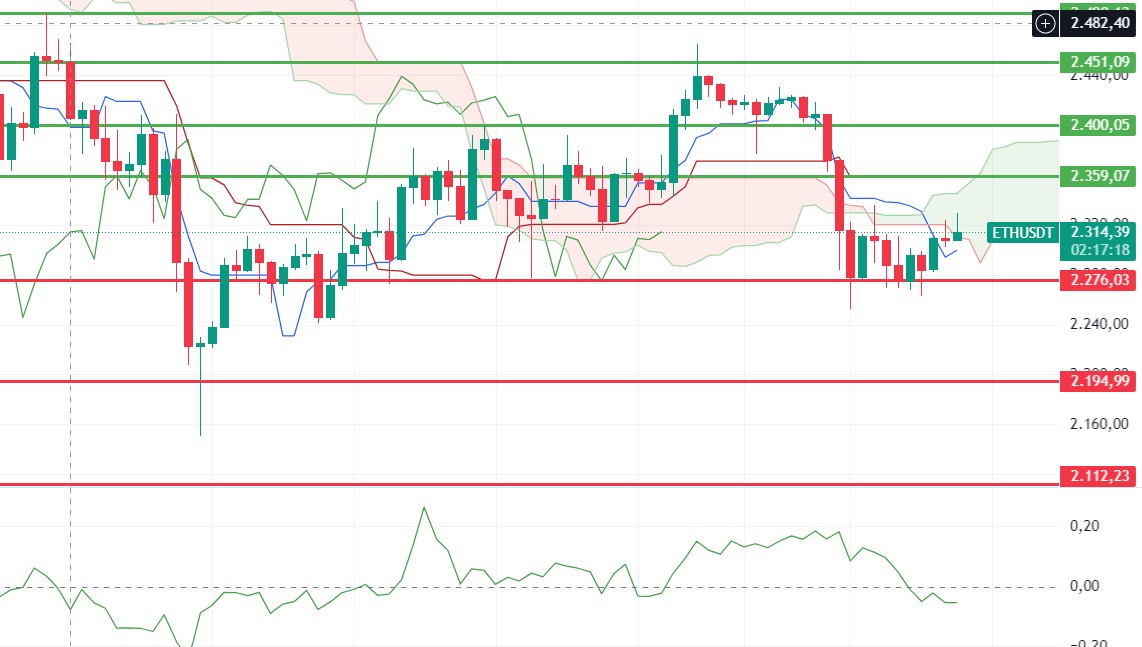
Ethereum, which we expect some upside with morning analysis, is currently trading above the 2,300 level. Its re-entry into the Kumo cloud and the signs of a return in CMF indicate that rises up to 2,359 kijun levels may occur during the day. The gain of this level may trigger a rise to 2,400 – 2,450 levels respectively. As the main support point, the 2,276 level remains valid. The break of this level may bring declines up to 2,195 levels.
Supports 2,276 – 2,195 – 2,112
Resistances 2,359 – 2,400 – 2,451
LINK/USDT
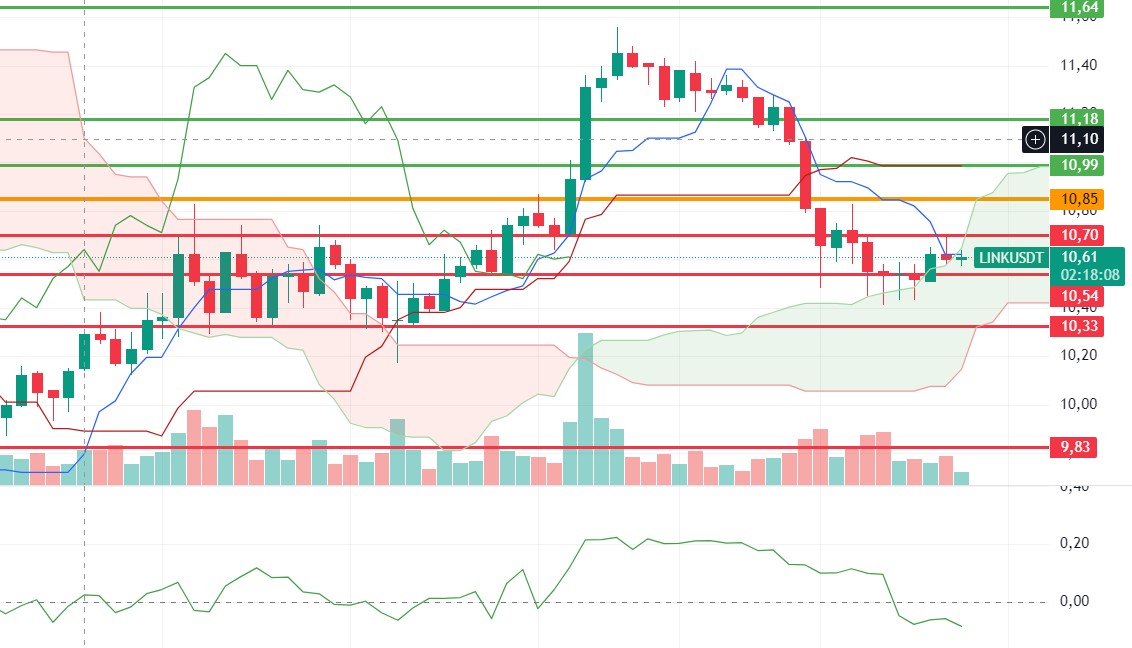
The most important levels for LINK are still 10.70 and 10.85. With the breakout of these levels, a new bullish wave may begin. Especially with the positive mismatch formed on the CMF and the breakout of the kumo cloud resistance, this rise can be expected to take place. However, the break of the 10.54 level may disrupt this scenario and cause the price to retreat.
Supports 10.54 – 10.33 – 9.83
Resistances 10.70 – 10.85 – 10.99
SOL/USDT
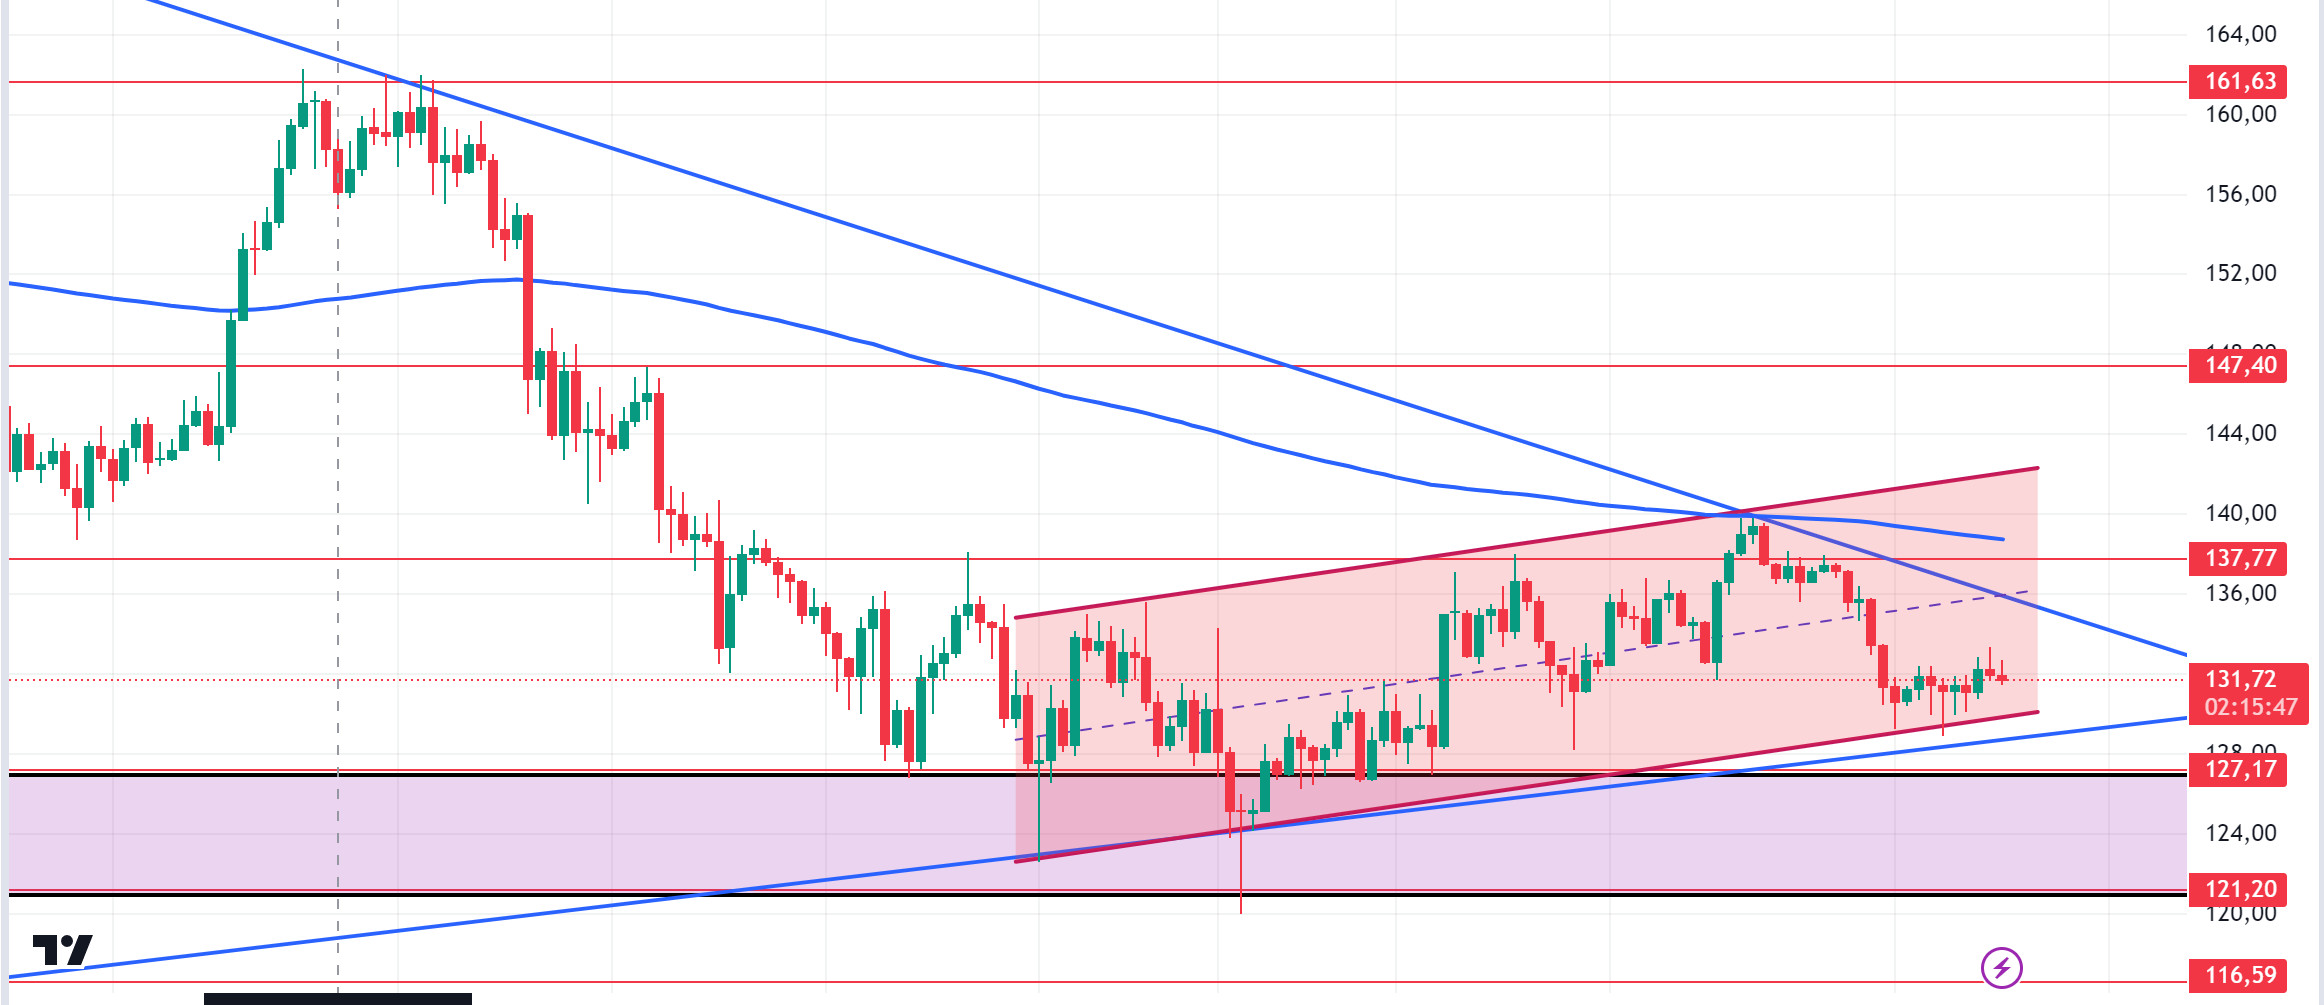
US retail sales rose in August when a decline was expected, signaling strong consumer demand. The Solana community is also preparing for Breakpoint, an annual event organized by the Solana Foundation in Singapore. Earlier today, the Solana team announced that online tickets for September 19 – September 21 are sold out. The Solana price has managed to hold above the support level, pricing sideways since our analysis this morning. This could lead to a bullish rally ahead. On the other hand, as long as it stays above 127.17, the upward movement can be followed. We are also coming to the end of the narrowing triangle pattern. At the same time, SOL, which has been rising from the support zone of the channel it has formed since September 4, may prepare the ground for an upward movement. Both macroeconomic conditions and innovations in the Solana ecosystem appear as resistance levels 137.77 – 142.02. If it rises above these levels, the rise may continue. It should be noted that the price has not yet broken above the 200 EMA. In the event that investors move in the opposite direction due to possible macroeconomic news and the rise in BTC dominance, a potential rise should be followed if it reaches the support levels of 127.17 – 121.20.
Supports 127.17 – 121.20 – 116.59
Resistances 137.77 – 147.40 – 161.63
ADA/USDT
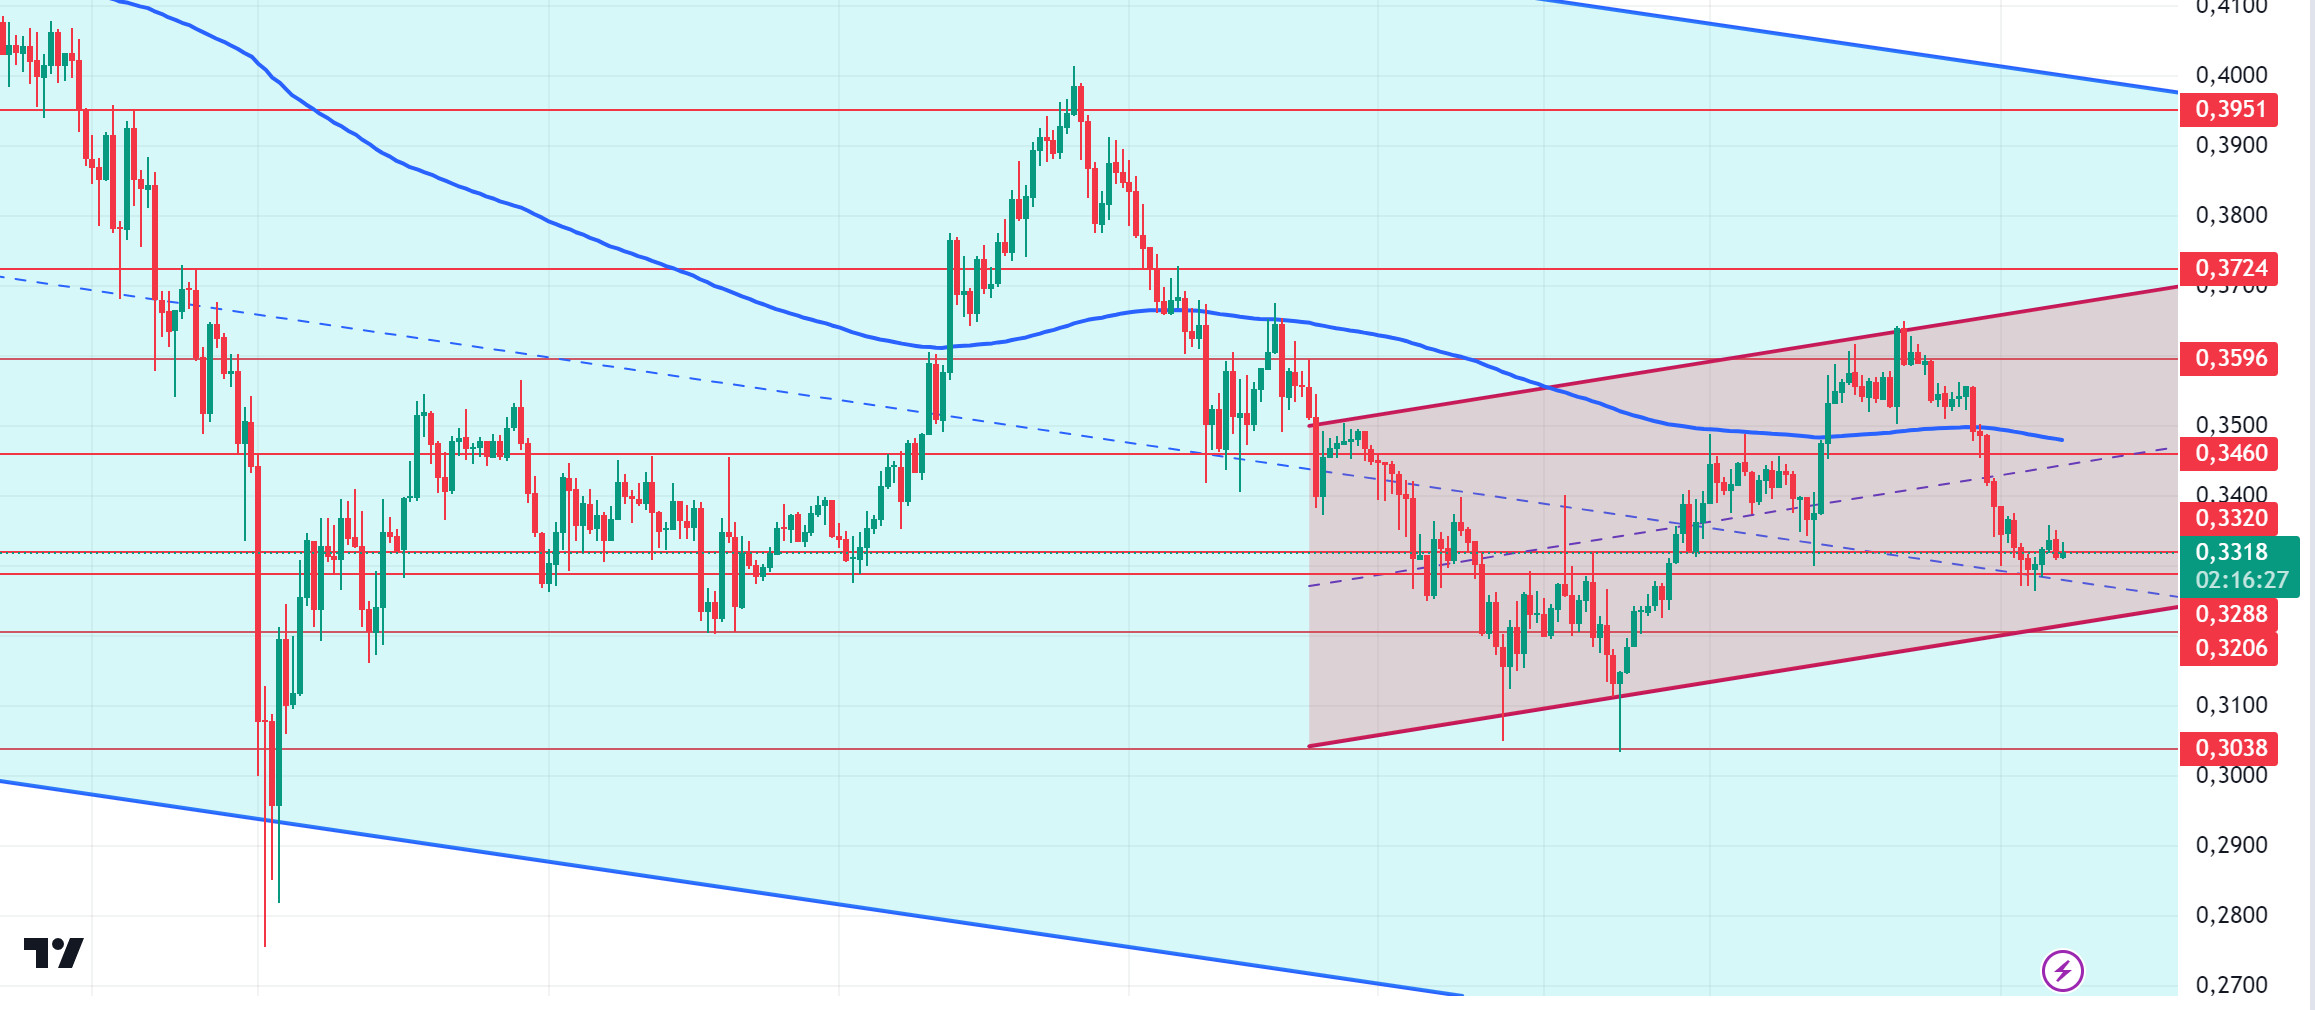
Retail sales from the US increased in August when a decline was expected, signaling that consumer demand was strong. Technically, Cardano has been pricing in a falling channel for the last five months. It seems to have had difficulty in recovering the losses in July. For ADA, the 0.3288 level may be the bottom of the correction. If the predictions of a 50 basis point interest rate cut in the US start to be priced in, it may test the resistance point of the channel it has formed since September 1. Such a move could take ADA to a target of 0.3724. On the other hand, ADA remains below the EMA200 moving average. This shows that there is still bearish pressure. Despite this, its price is hovering above a critical resistance. 0.3320 is a strong support in case of a pullback due to general market movements. In the event that macroeconomic data raises BTC, 0.3460 – 0.3596 levels can be followed as resistance levels.
Supports 0.3320 – 0.3288 – 0.3206
Resistances 0.3460 – 0.3596 – 0.3724
AVAX/USDT
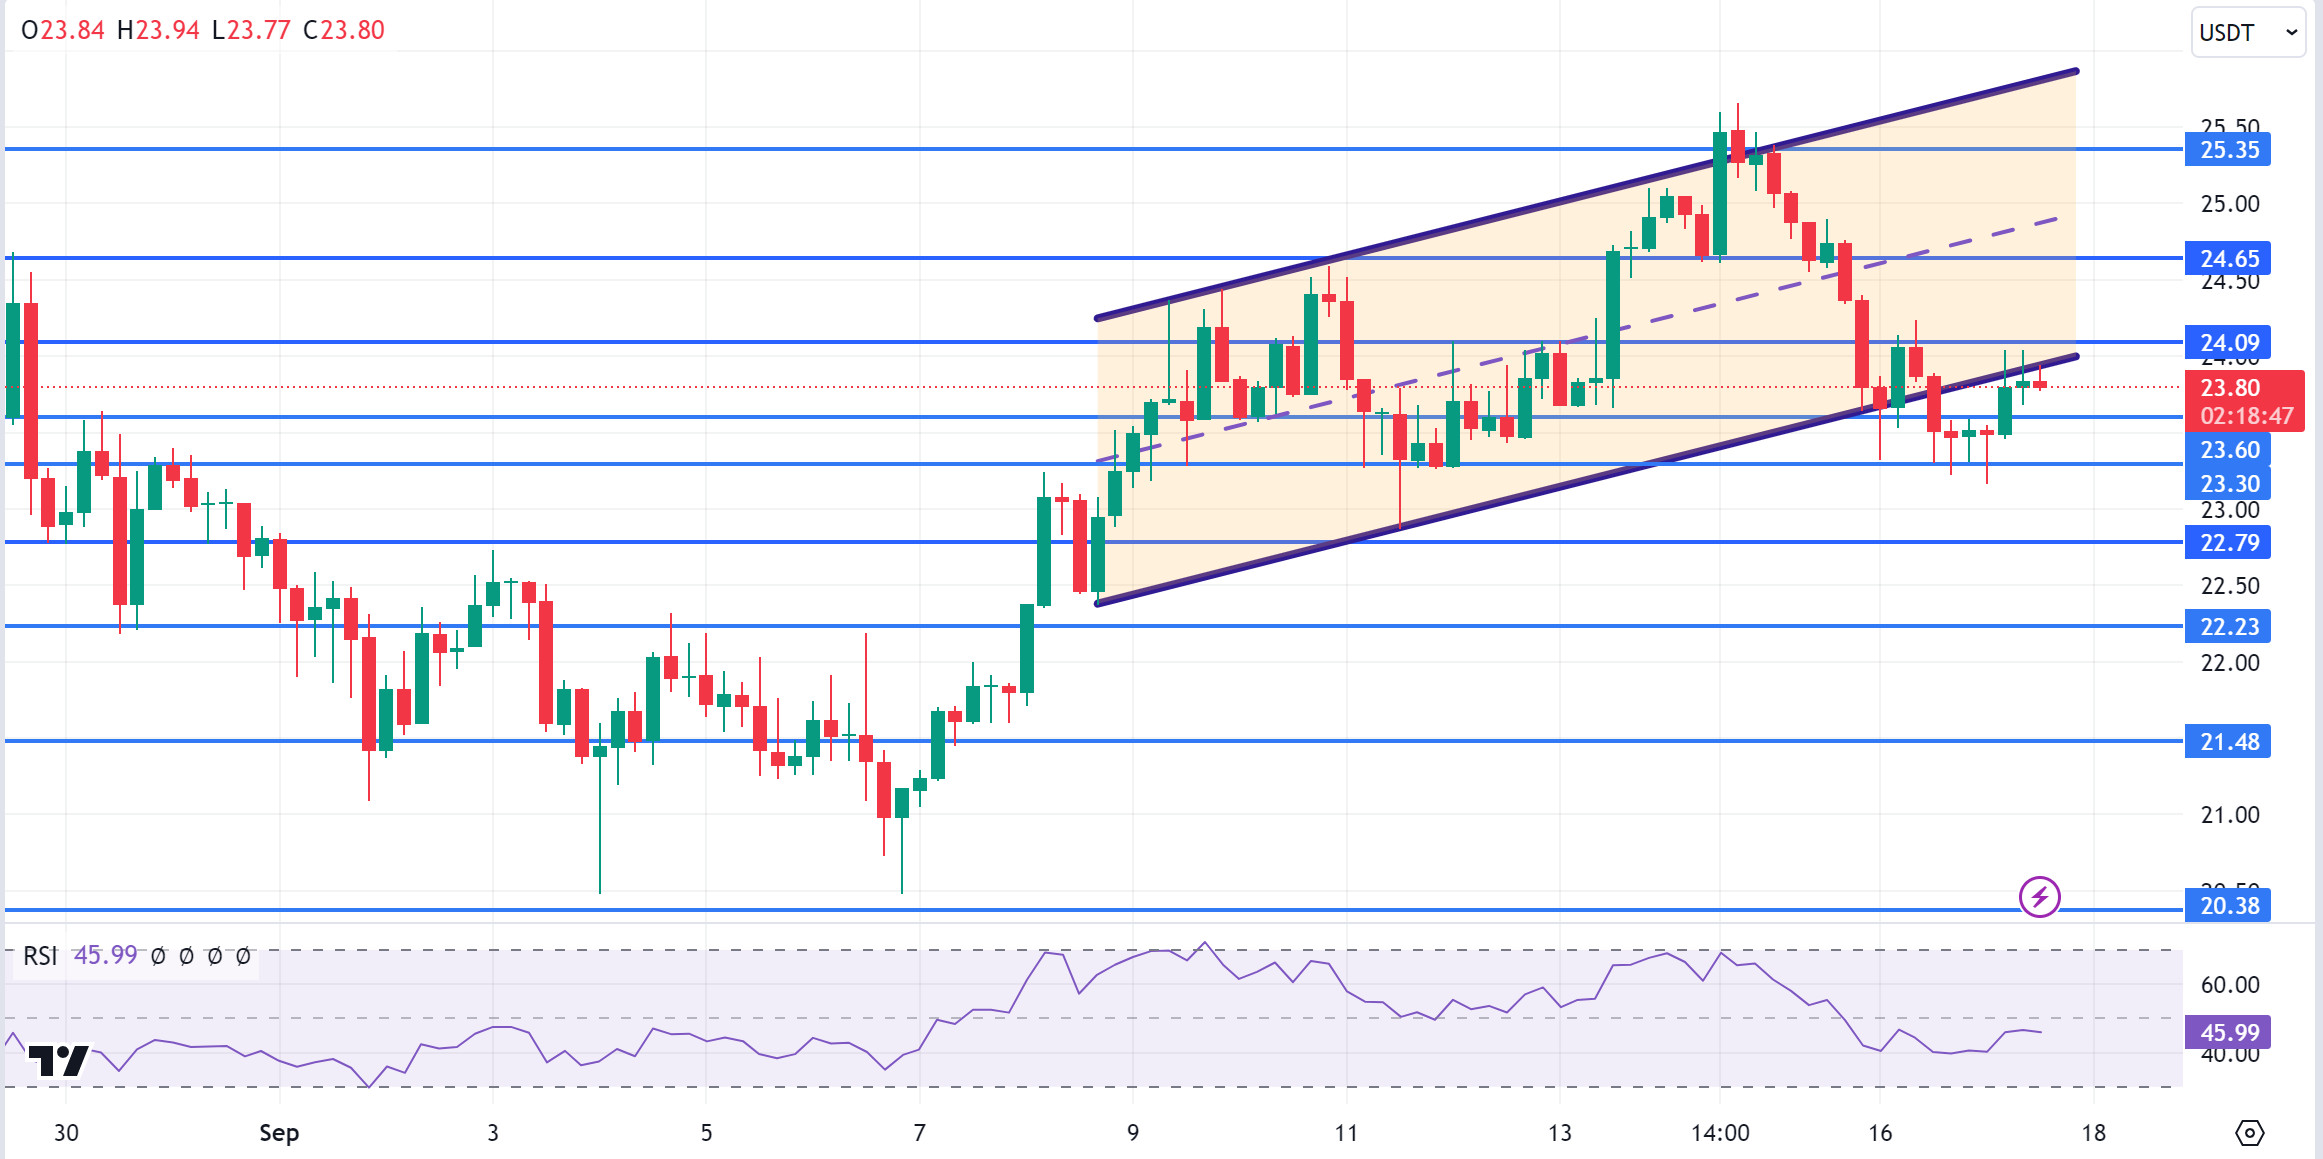
AVAX, which opened today at 23.52, rose by about 1.5% during the day and is trading at 23.80. Today’s US retail sales data was above expectations and did not have an impact on the market.
The FED interest rate decision to be announced tomorrow and the speech by FED chairman Powell will be important. AVAX, which broke the rising channel downwards before this and was trying to return to the channel again, has not yet entered the channel with the sales reaction from the lower band of the channel on the 4-hour chart. It may rise a little more from the current level and thus move towards the upper band of the channel and test the 24.09 and 24.65 resistances. With the selling pressure from the lower band of the channel, it may want to test 23.30 and 22.79 supports as a result of the candle closing below 23.60 support. As long as it stays above 20.38 support during the day, the desire to rise may continue. With the break of 20.38 support, selling pressure may increase.
Supports 23.60 – 23.30 – 22.79
Resistances 24.09 – 24.65 – 25.35
TRX/USDT
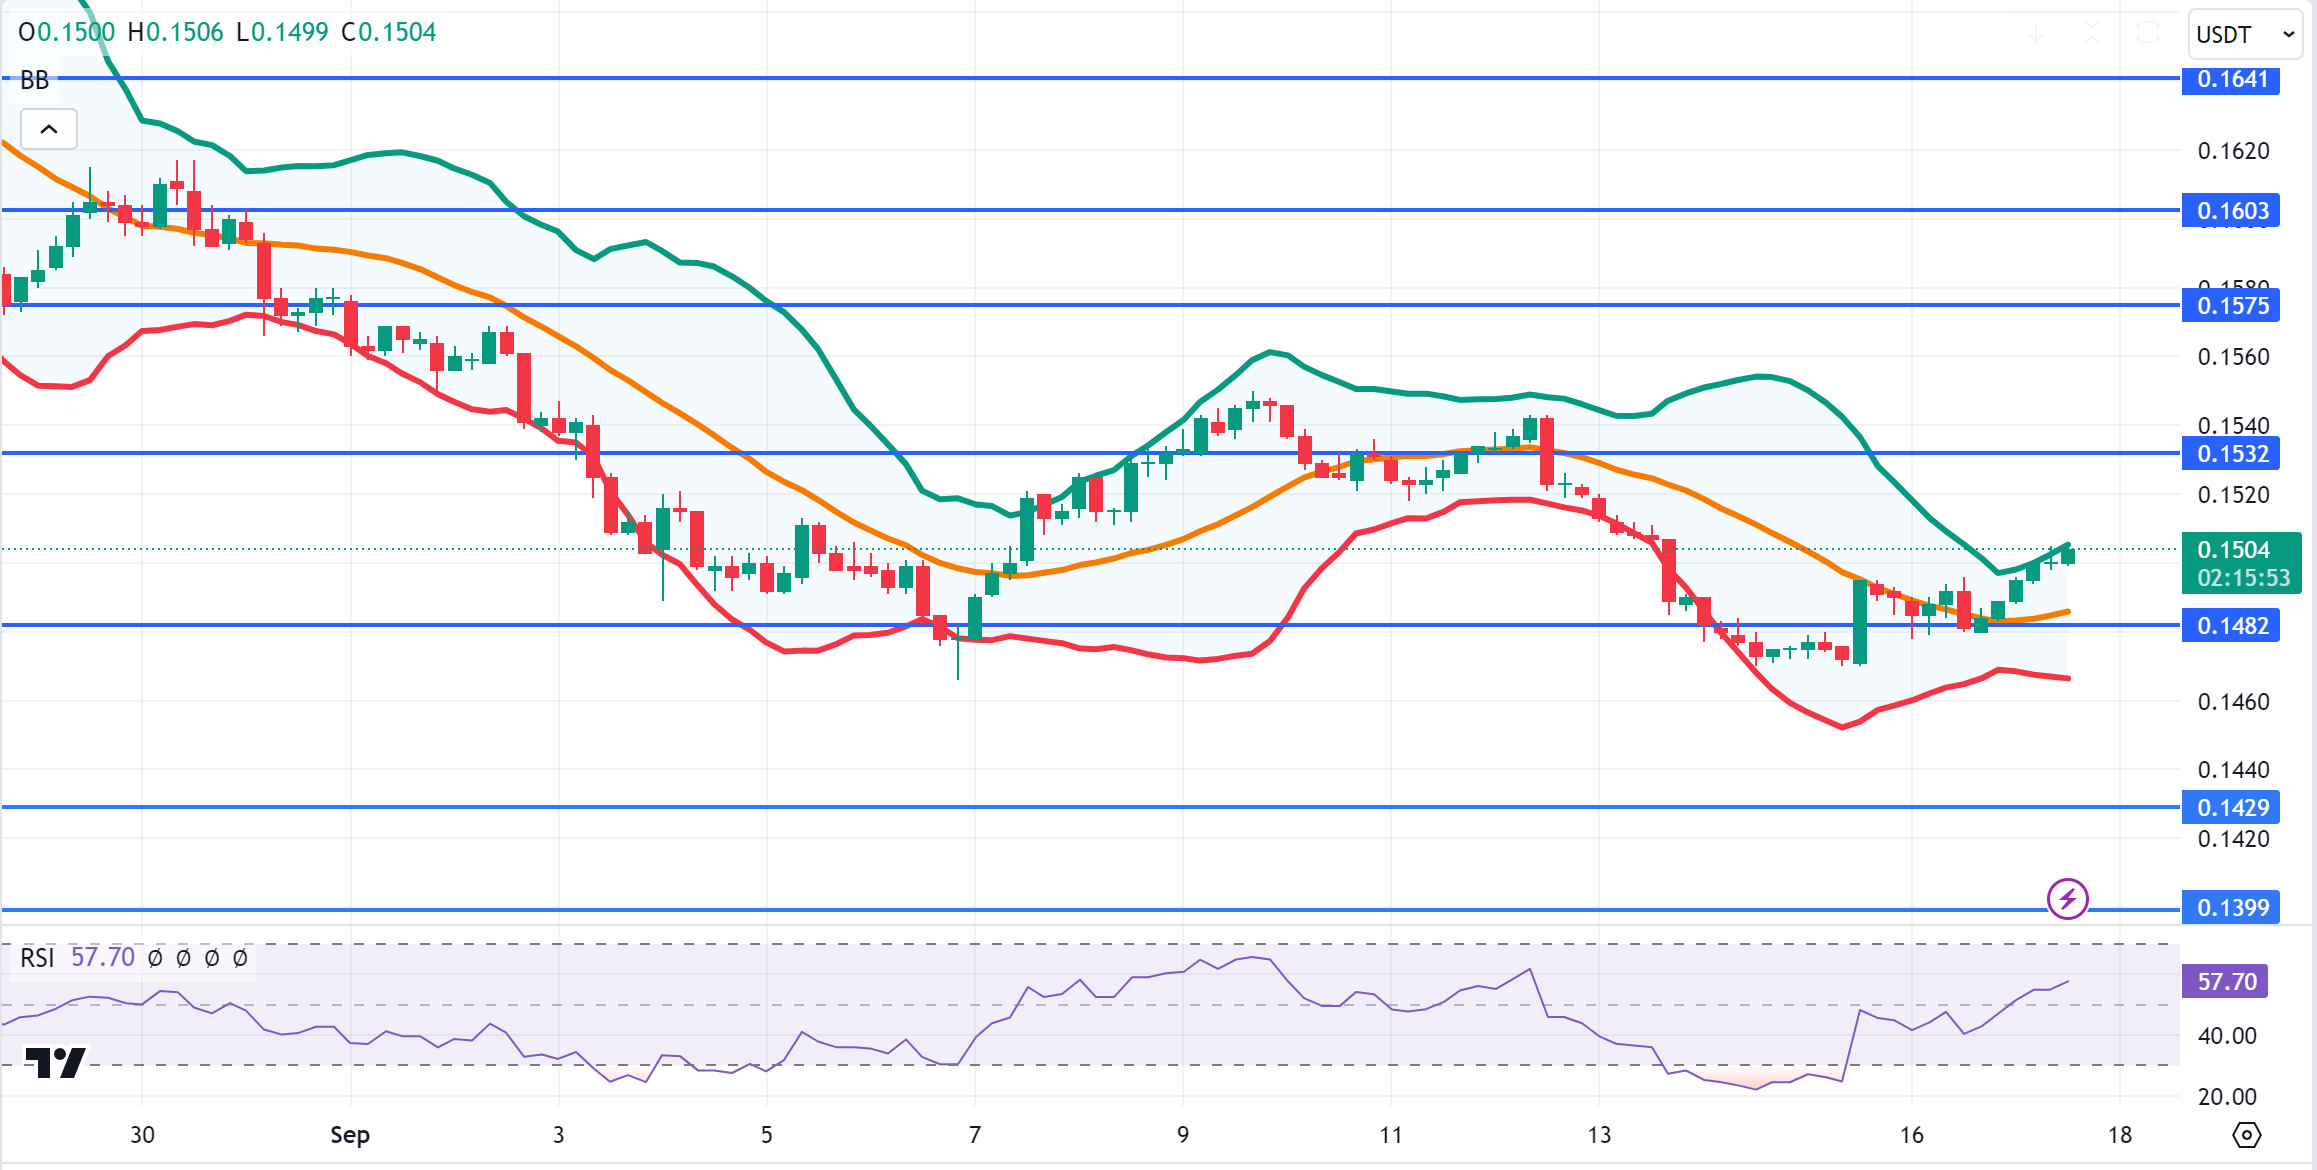
TRX, which started the day at 0.1489, is trading at 0.1504 after the US retail sales data that came above expectations and the US stock market opening. The markets are in search of direction as they focus on the FED interest rate decision tomorrow evening and relatively low volumes are traded.
On the 4-hour chart, TRX, which is in the upper Bollinger band, can be expected to move to the middle band. In such a case, it may want to test 0.1482 support. However, since the RSI has not yet reached the overbought point with a value of 57, it may want to test the 0.1532 and 0.1575 resistances with continued purchases from these levels. TRX may continue to be bullish as long as it stays above 0.1482 support. If this support is broken downwards, sales can be expected to increase.
Supports 0.1482 – 0.1429 – 0.1399
Resistances 0.1532 – 0.1575 – 0.1603
XRP/USDT
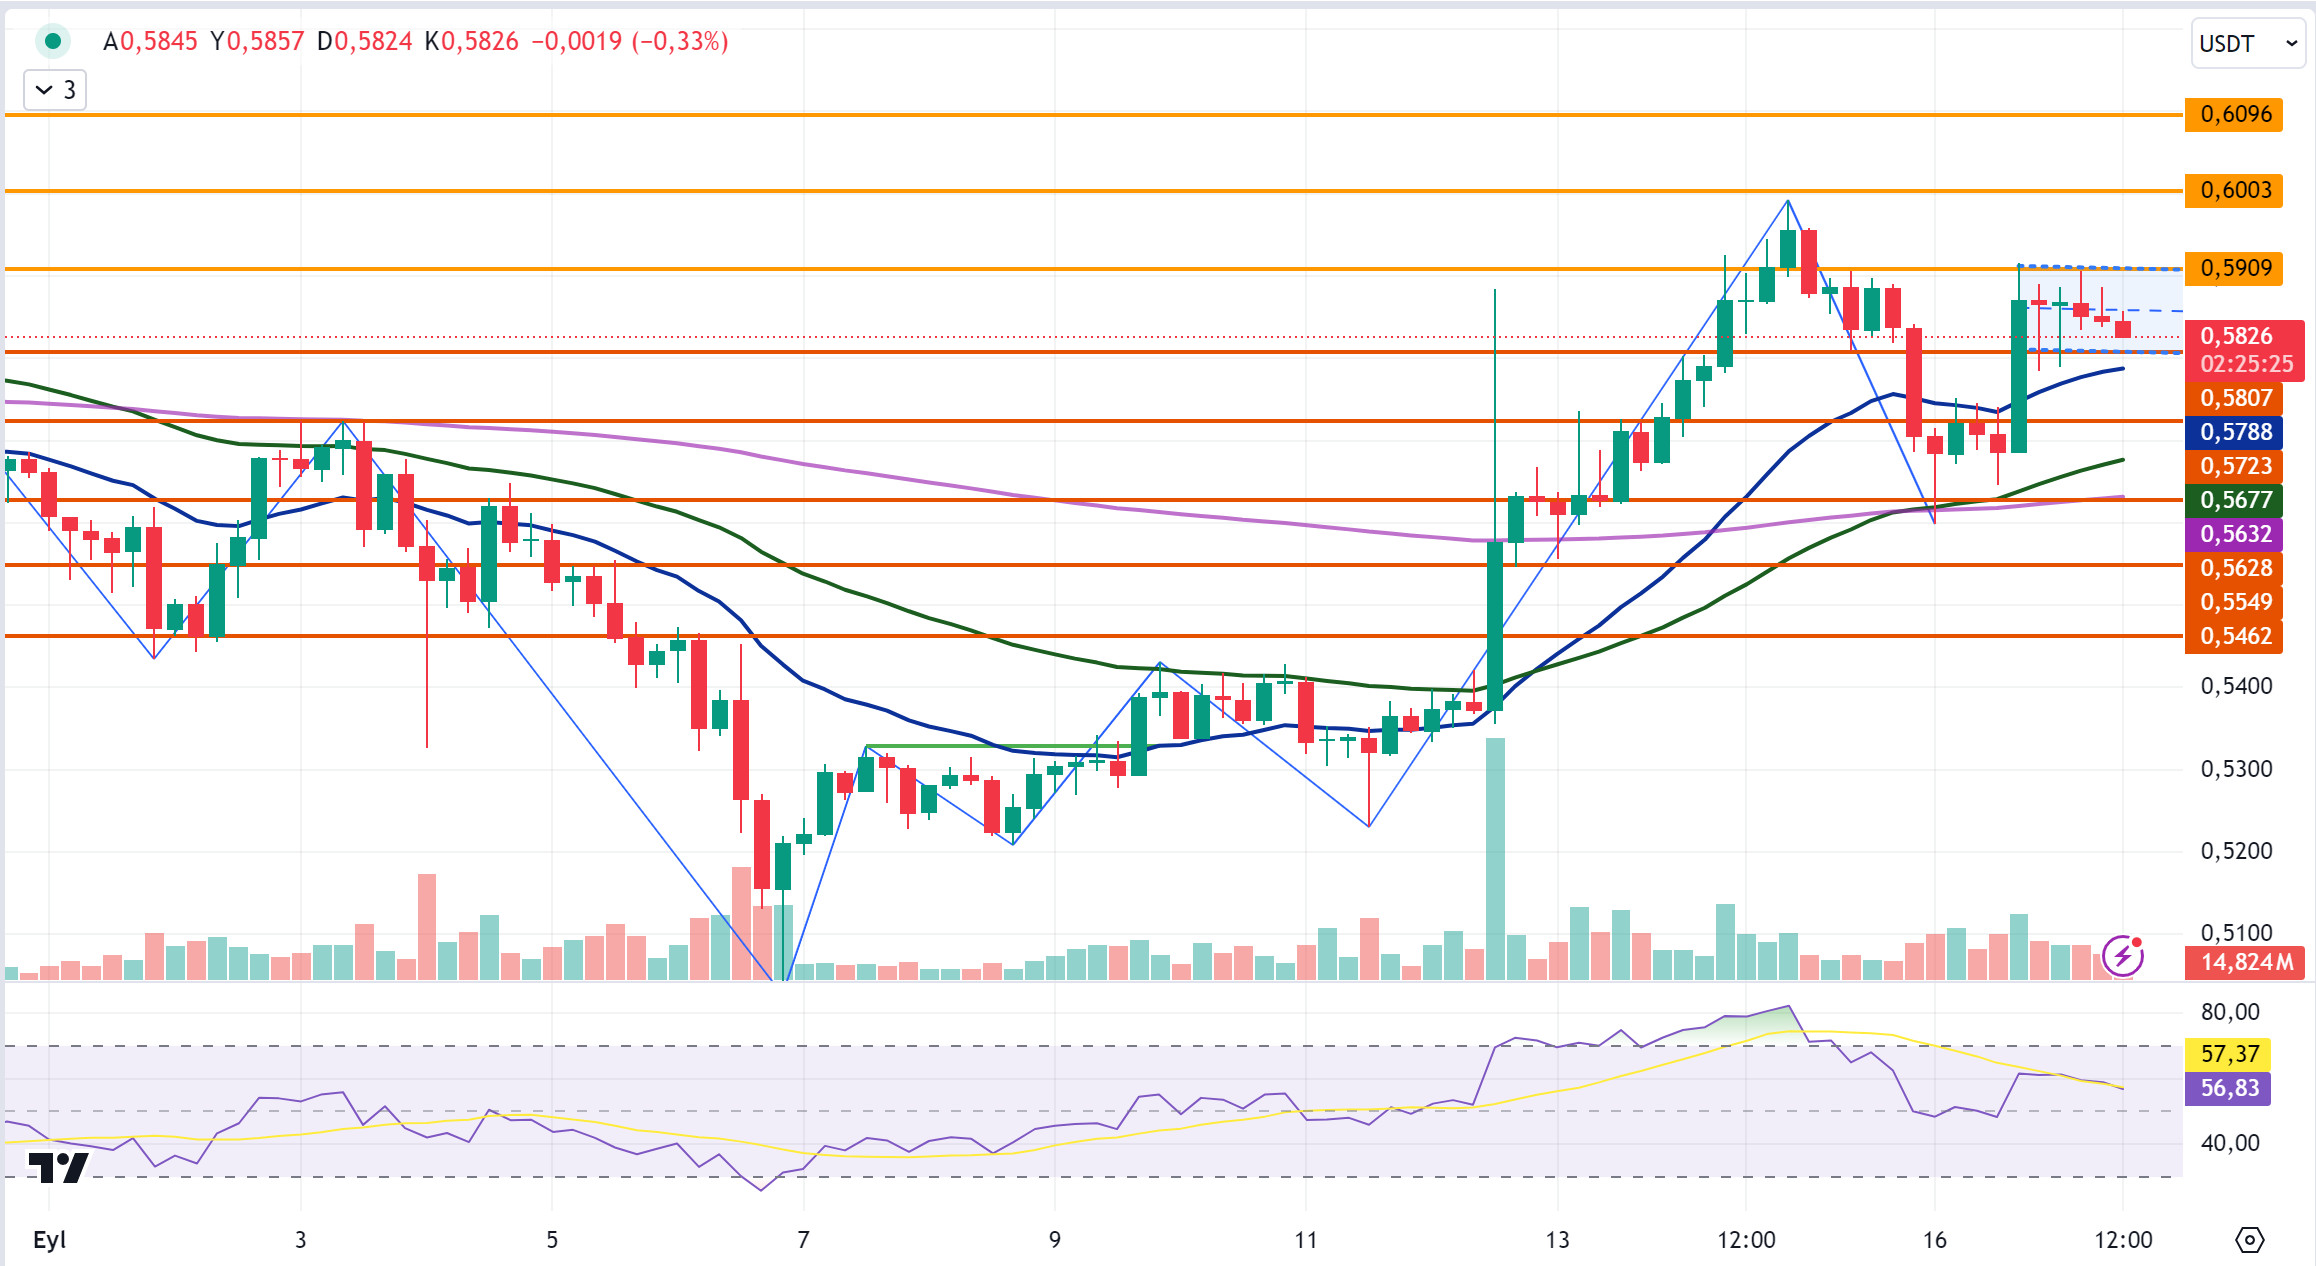
In the 4-hour analysis, XRP continues to trade at 0.5826 in a horizontal band between the 0.5807 support level and the 0.5909 resistance level after a decline after testing the 0.5909 resistance level. Economic data released by the US today did not have an impact on XRP. The crypto market is especially waiting for the FED interest rate decision to be announced tomorrow. The expectation is for an interest rate cut of 50 basis points, and in this context, the market may take shape before the announcement and a rise can be observed. With the market on the rise, XRP may also rise and test the resistance levels of 0.5909-0.6003-0.6096 with its rise. Otherwise, if it declines with negative news and developments, it may test the support levels of 0.5807-0.5723-0.5628.
In the 4-hour analysis, XRP, which moves in a horizontal band today, may offer a short trading opportunity with possible reaction sales at the 0.5909 resistance level. And during its decline, it may rise with purchases at 0.5807 and EMA20 and may offer a long trading opportunity.
EMA20 (Blue Line) – EMA50 (Green Line) – EMA200 (Purple Line)
Supports 0.5807 – 0.5723 – 0. 5 628
Resistances 0.5909 – 0.6003 – 0. 6096
DOGE/USDT
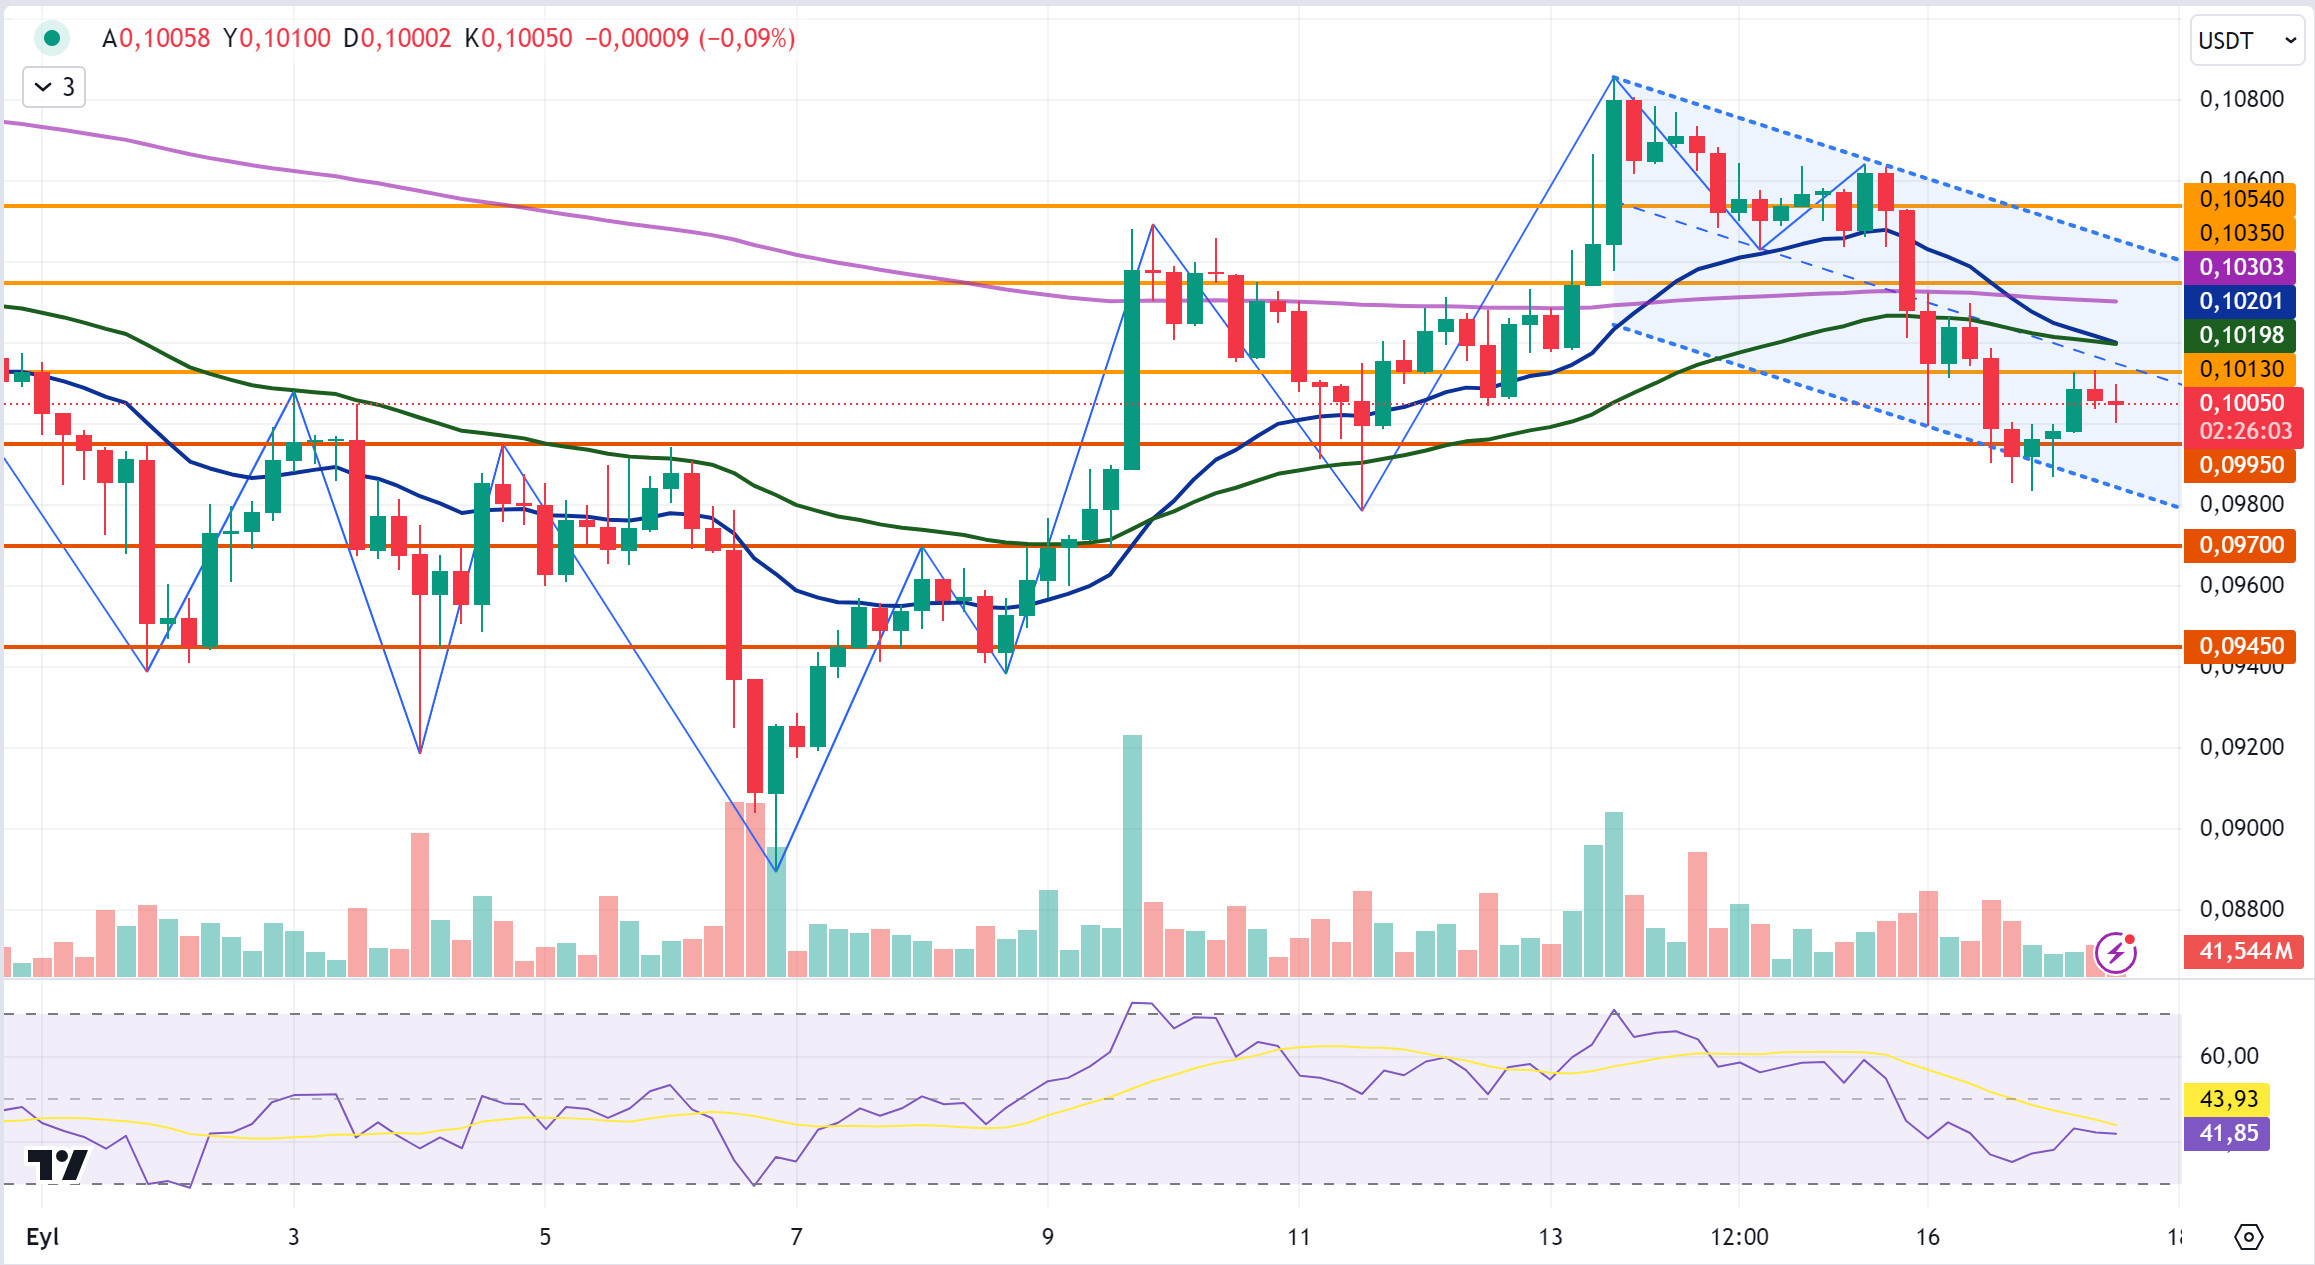
In the 4-hour analysis, DOGE continues to move in a horizontal band after the decline it experienced after starting the day with a rise and is currently trading at 0.1005. Economic data released by the US today did not have a sharp bearish or bullish effect on DOGE. The crypto market is focused on the FED interest rate decision announced tomorrow. The expectation is 50 basis points and within this expectation, mobility can be observed in the market before the announcement. DOGE, which is in the falling channel, may test the resistance levels of 0.1013-0.1035-0.1054 if it rises with the purchases that may come within the scope of the expectation. On the contrary, if it declines with the selling pressure that may occur in the market in this process, it may test the support levels of 0.0995-0.0970-0.0945.
In the 4-hour analysis, if DOGE breaks the resistance level of 0.1013 in its rise, it may decline with the reaction sales that may come at the EMA20 and EMA50 level when it continues to rise. In case of a decline, it may rise with the purchases that may come at the level of 0.0970.
EMA20 (Blue Line) – EMA50 (Green Line) – EMA200 (Purple Line)
Supports 0.0995 – 0.0970 – 0.0945
Resistances 0.1013 – 0.1 035 – 0.1054
DOT/USDT
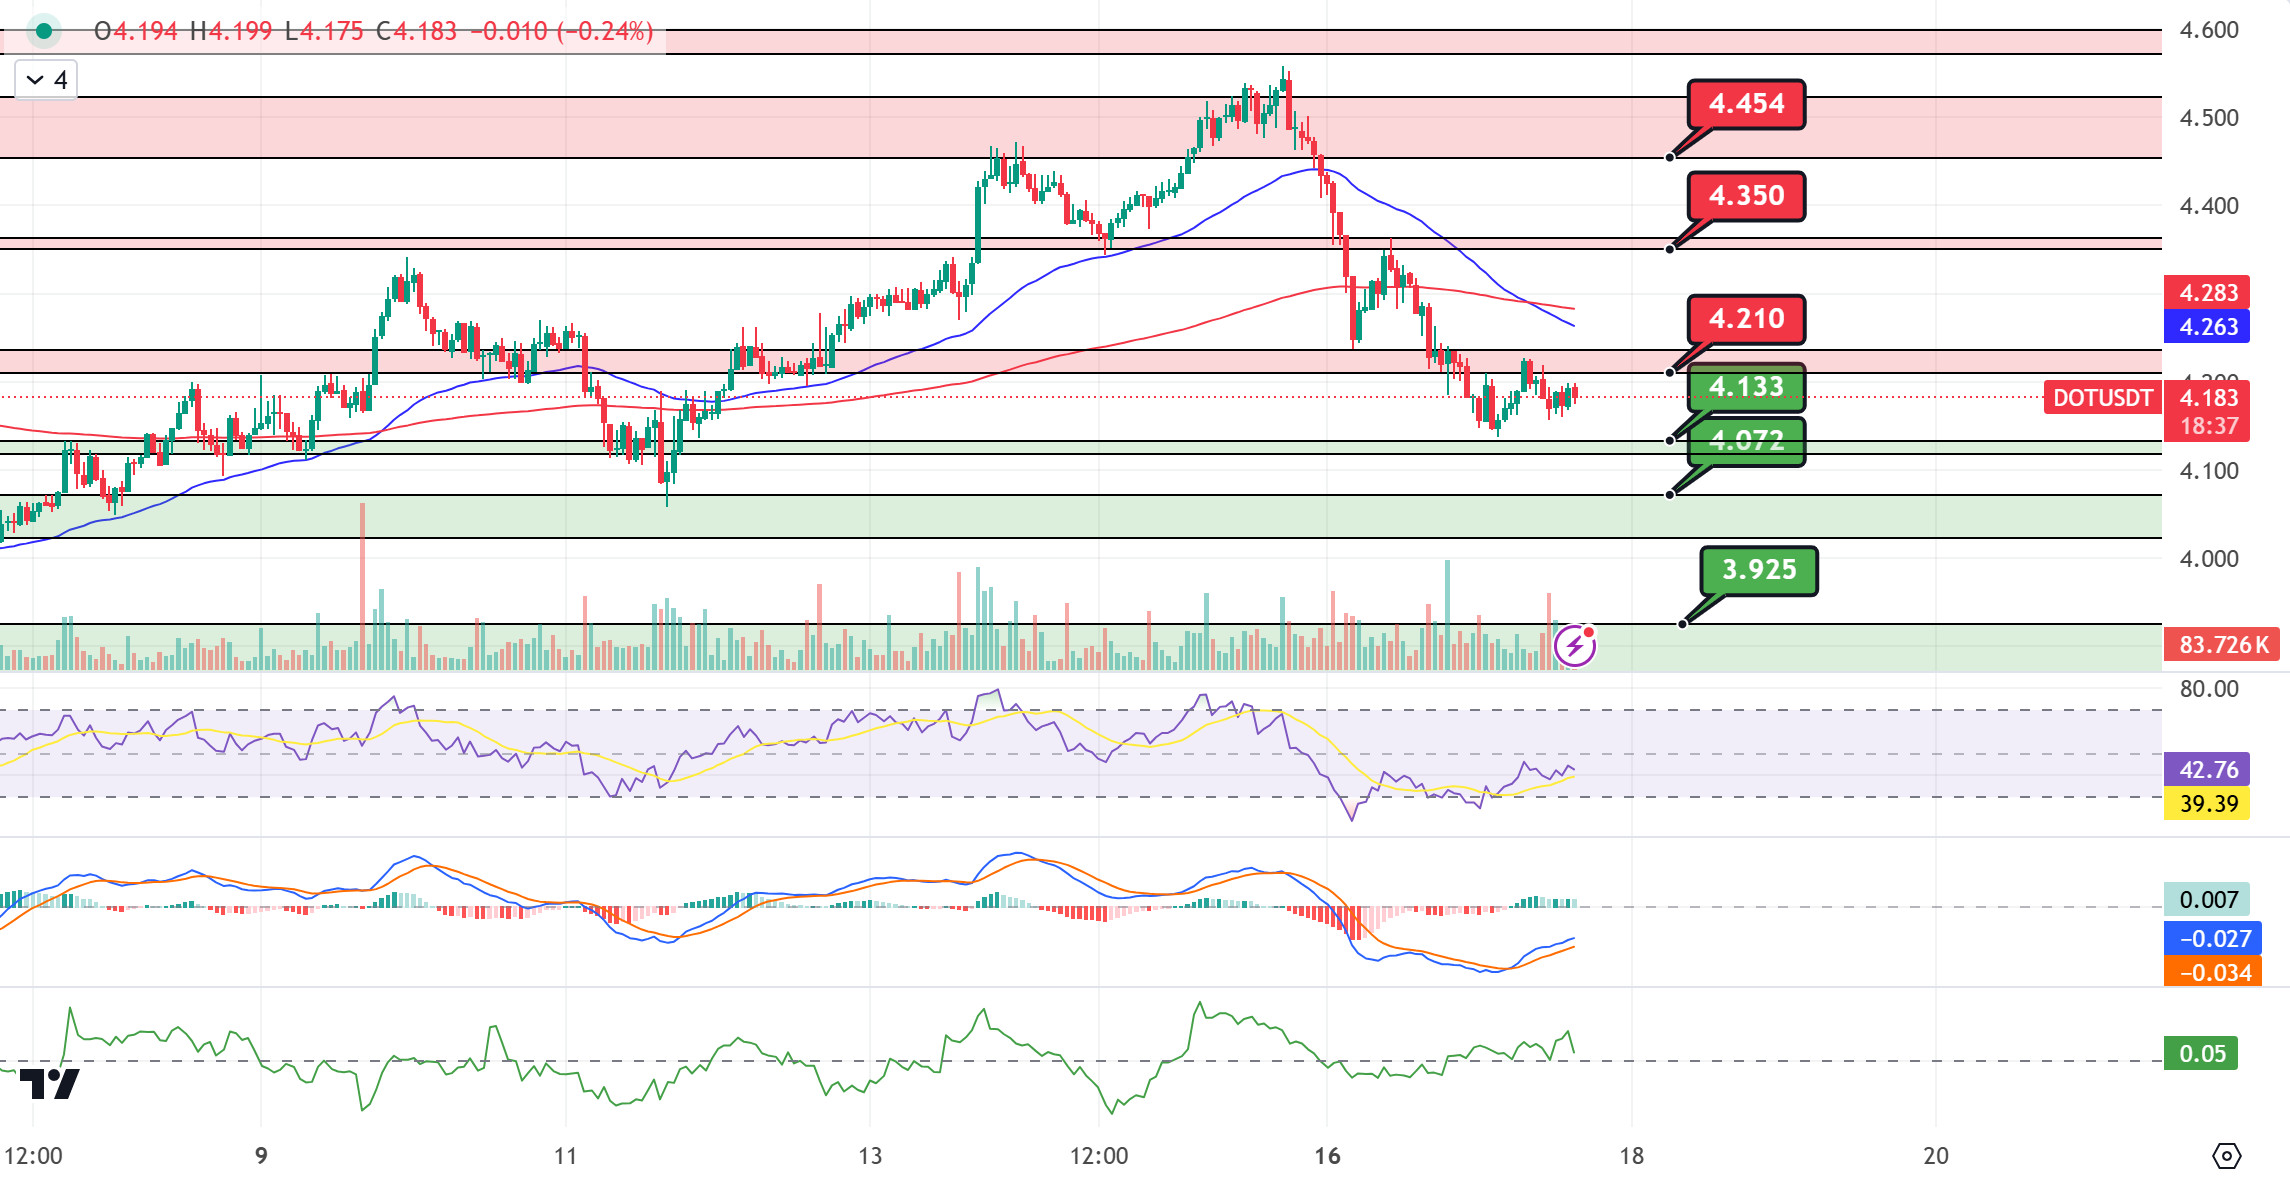
When we examine the Polkadot chart, the price seems to have been rejected from the 4,210 resistance band. The price seems to move downward unless it can break the selling pressure at the 4.210 level. When we examine the MACD and CMF oscillators, we see that buying pressure dominates. If the price breaks the 4,210 level upwards, there may be a rise towards the 4,350 resistance level. On the other hand, if the selling pressure increases, the price may retreat towards the 4.133 support band.
(Blue line: EMA50, Red line: EMA200)
Supports 4,133 – 4,072 – 3,925
Resistances 4.210 – 4.350 – 4.454
SHIB/USDT
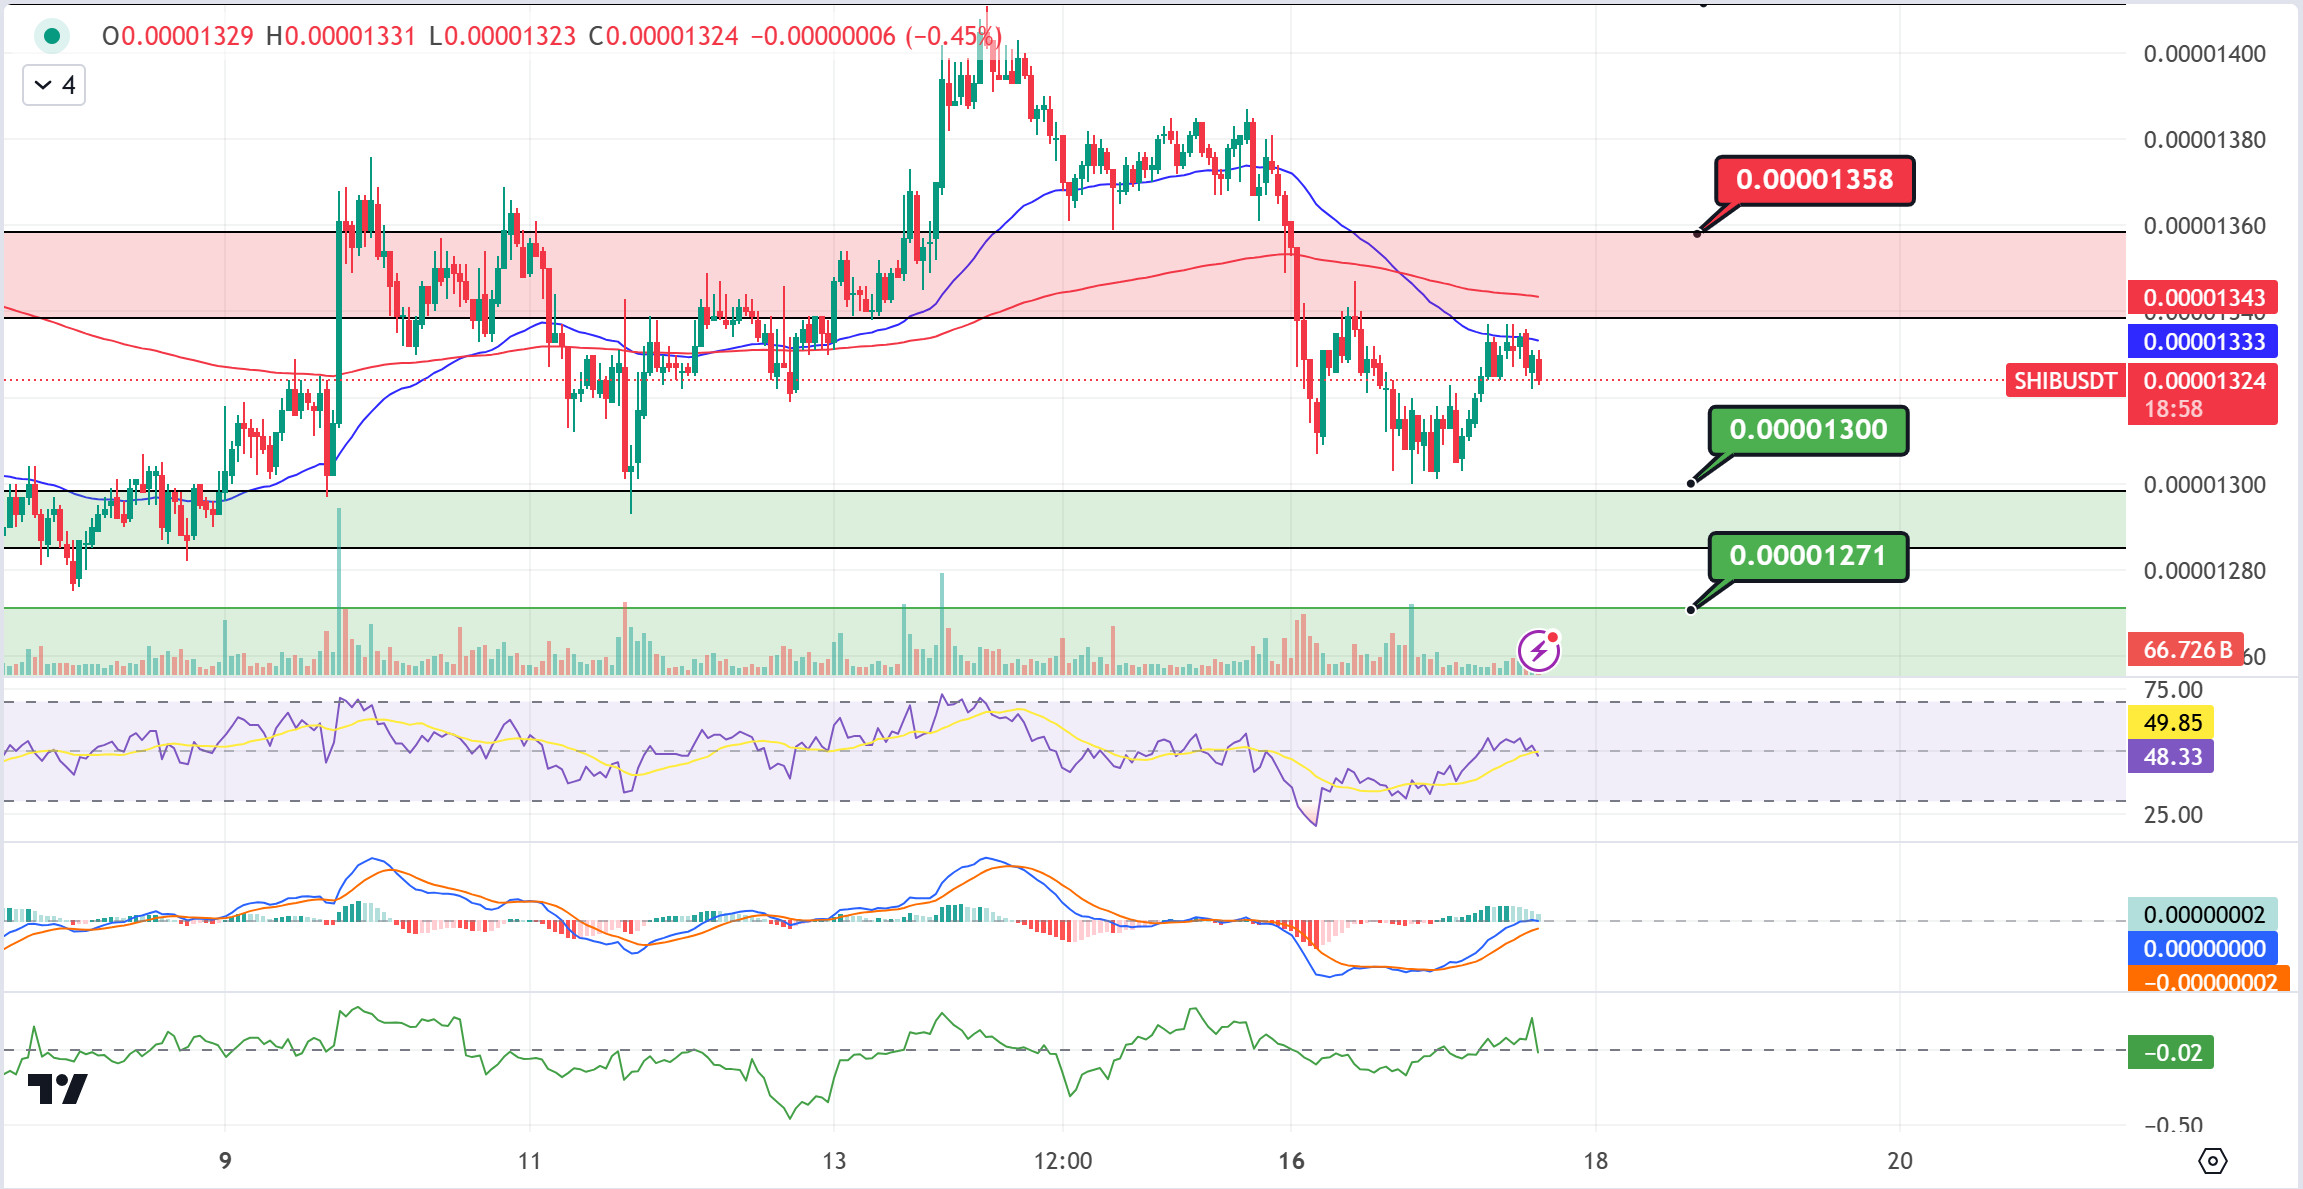
The Shiba Inu (SHIB) community is notable for its increased burn rate by 3.348% in the last 24 hours. In total, 7.8 million SHIBs were burned and removed from circulation, but despite this, the SHIB price fell by 0.35% to $0.00001325. The development team predicts that this rate could increase even more in the future by automating the burning process with the Shibarium burning portal.
When we examine the SHIB chart, the price seems to be rejected from the EMA50 level. When we examine the MACD oscillator, we can say that the buying pressure decreased compared to the previous hour. In the negative scenario, the price rejected from the EMA50 level may retreat to the 0.00001300 support. In the positive scenario, if the price maintains above the EMA50 with increasing burn rates, its next target may be the 0.00001358 resistance level.
(Blue line: EMA50, Red line: EMA200)
Supports 0.00001300 – 0.00001271 – 0.00001227
Resistances 0.00001358 – 0.00001412 – 0.00001443
LEGAL NOTICE
The investment information, comments and recommendations contained herein do not constitute investment advice. Investment advisory services are provided individually by authorized institutions taking into account the risk and return preferences of individuals. The comments and recommendations contained herein are of a general nature. These recommendations may not be suitable for your financial situation and risk and return preferences. Therefore, making an investment decision based solely on the information contained herein may not produce results in line with your expectations.


