MARKET SUMMARY
Latest Situation in Crypto Assets
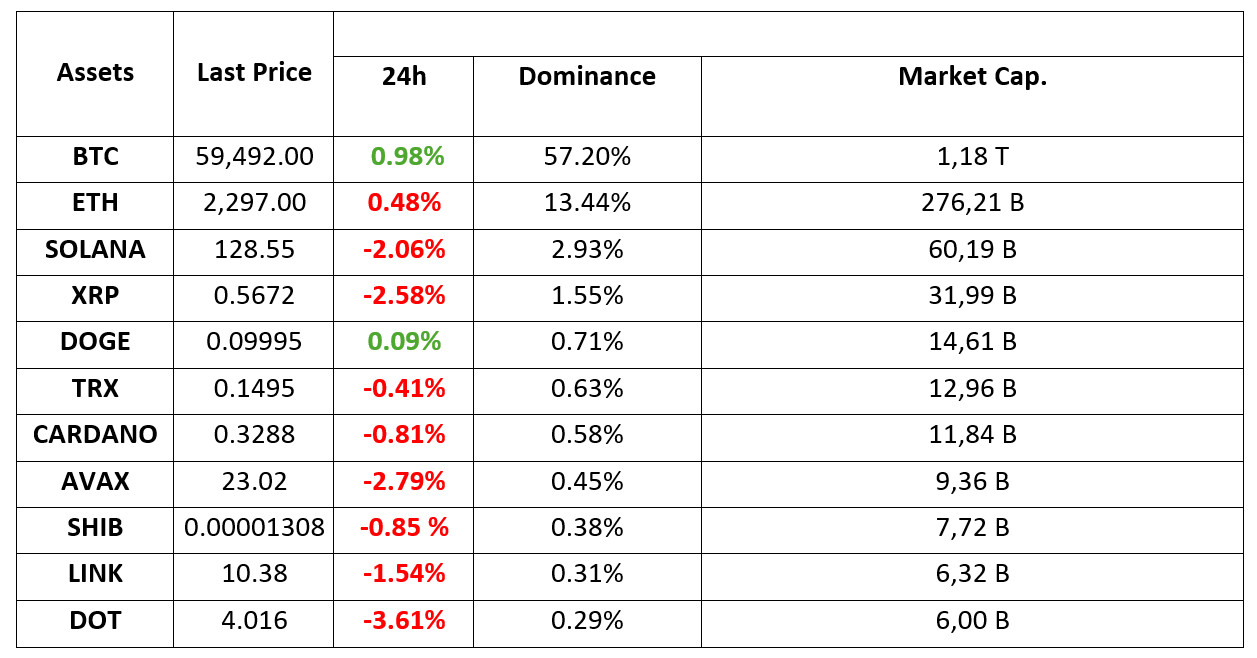
*Prepared on 18.09.2024 at 14:00 (UTC)
WHAT’S LEFT BEHIND
Hours to go until the historic Fed decision
As the world focuses on the US Federal Reserve’s (Fed) interest rate decision to be announced this evening, it remains unclear at what level the Fed will start its rate cuts. Markets have been oscillating between an aggressive 50 basis point cut and 25 basis points. Powell’s words on possible future rate cuts are also eagerly awaited this evening.
JPMorgan CEO Dimon
Jamie Dimon, CEO of JPMorgan Chase, stated that his bank is one of the biggest users of Blockchain technology. Although he finds Blockchain efficient, he remains skeptical of cryptocurrencies. JPMorgan’s Blockchain-based Onyx network has processed more than $700 billion in transactions.
Ethereum Founder Vitalik Buterin
Vitalik Buterin stated that cryptocurrencies are no longer in their early stages. He emphasized that projects such as Bitcoin and Ethereum have been around for a long time. He noted that the cryptocurrency space has matured and entered a special period.
BlackRock Publishes Report on Bitcoin’s Attractiveness!
An important point made by BlackRock in the report is that Bitcoin does not fit into the traditional financial framework. Bitcoin’s long-term performance shows a low correlation with stocks and bonds. Such a feature makes Bitcoin attractive for diversification. The report suggests that Bitcoin’s unique characteristics could be a hedge against risks that traditional assets cannot cope with.
HIGHLIGHTS OF THE DAY
Important Economic Callender Data

INFORMATION:
*The calendar is based on UTC (Coordinated Universal Time) time zone. The economic calendar content on the relevant page is obtained from reliable news and data providers. The news in the economic calendar content, the date and time of the announcement of the news, possible changes in the previous, expectations and announced figures are made by the data provider institutions. Darkex cannot be held responsible for possible changes that may arise from similar situations.
MARKET COMPASS
Global markets are holding their breaths for the decisions to be taken at today’s meeting of the US Federal Reserve (FED). While it is certain that the Federal Open Market Committee (FOMC) will cut the interest rate at its historic meeting, the magnitude of the cut is still under scrutiny. Click here to review our previous report on the subject.
Ahead of the critical FOMC statements, European stock markets are on the negative side and the US made a horizontal-mixed start. There are also reflections of cautious expectations in crypto assets and in this parallel, we saw a retreat in major instruments.
According to the CME FedWatch Tool, markets are pointing to the Fed being closer to a 50 basis point cut this evening (the Fed’s current policy rate is 5.25-5.50%), although it is difficult to say that there is a full consensus on how much to cut. Most of the analysts surveyed by Bloomberg expect a 25 basis point cut. While we also believe that a 25 bps cut is more likely, we think that the complexity of the markets’ expectations should not be ignored. This state of uncertainty is rare. The fact that the markets have not been able to come to a consensus with so little time left before the rate change decision, which will come after a gap of nearly four years, is a sign that the volatility in the markets may increase unusually once the decision is announced.
For more information on the impact of the FOMC decisions on the markets and especially on major crypto assets, you can read our report linked above.
TECHNICAL ANALYSIS
BTC/USDT
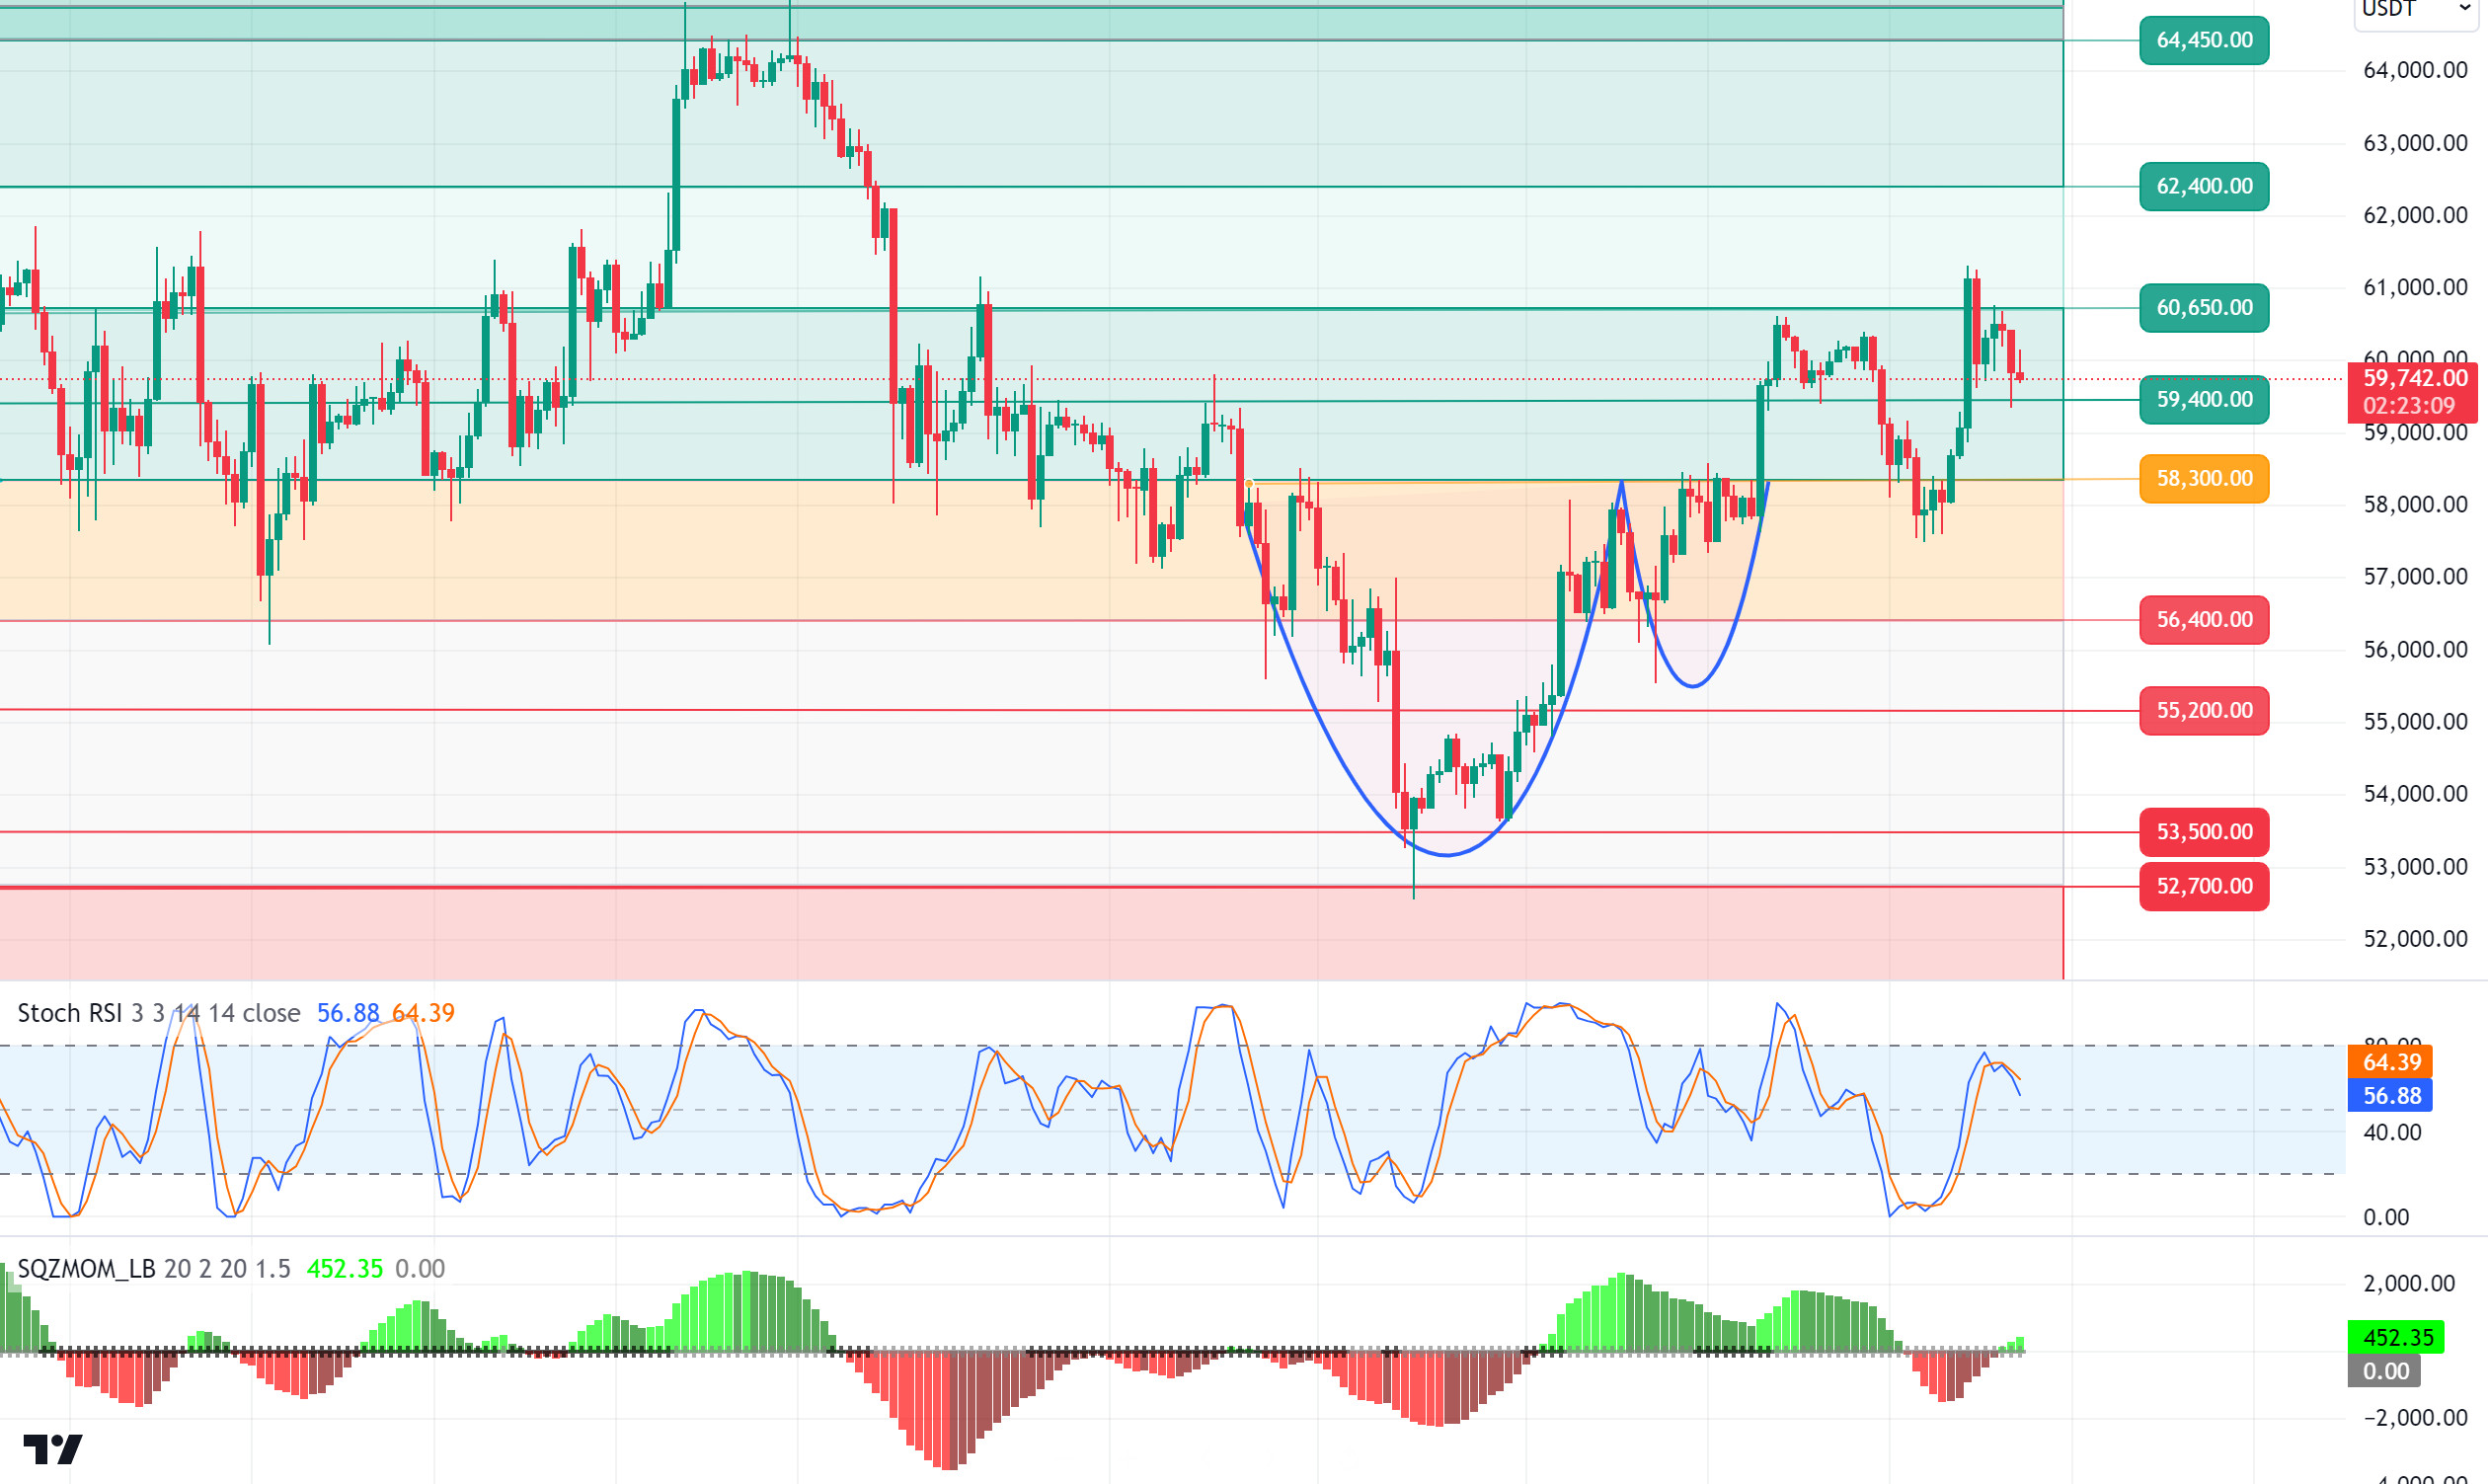
Countdown to the Historic FED Meeting! Hours before the FED interest rate decision, we see that the uncertainty on the market continues in this meeting compared to other interest rate meetings. In recent days, the fact that the 50 basis point cut has gained weight with the pressure of corporate companies makes unpredictability dominant on the market. Until last week, a 25 basis point cut seemed almost certain. However, in recent days, the expectation for a 50 basis point cut has increased rapidly and currently stands at 63%. The possibility of a 50 basis point cut and the FED’s moderate approach of 25 basis points leads investors and analysts to hypothesize two different scenarios. For this reason, the moment of the interest rate decision is of critical importance, we may witness assets changing hands for investors who take advantage of the “sell the news” situation and the cycle of interest rate cuts. The possibility of creating dominoes by shifting the weight in one direction can determine the course of Bitcoin, and technical breakdowns can guide us about the direction. In the BTC 4-hour technical analysis, we see that the price is currently hovering near the 59,700 level in an unstable picture. As the hours progress and with the opening of the US market, it may be necessary to consider the possibility that volatility will increase and the data coming from there will pre-price the interest rate. The resistance area that we may encounter in the face of positive data may be the 60,650 and 60,850 range, which has been tested many times before and works as support or resistance. In the face of negative data, the intermediate support point is 59.400 and 58.300 levels in case of a breakout. Our technical indicators show that momentum is increasing, while the RSI is in an indecisive picture, showing that it has turned downward.
Supports 59,400 – 58,300- 57,200
Resistances 60,650 – 62,400 – 64,450
ETH/USDT
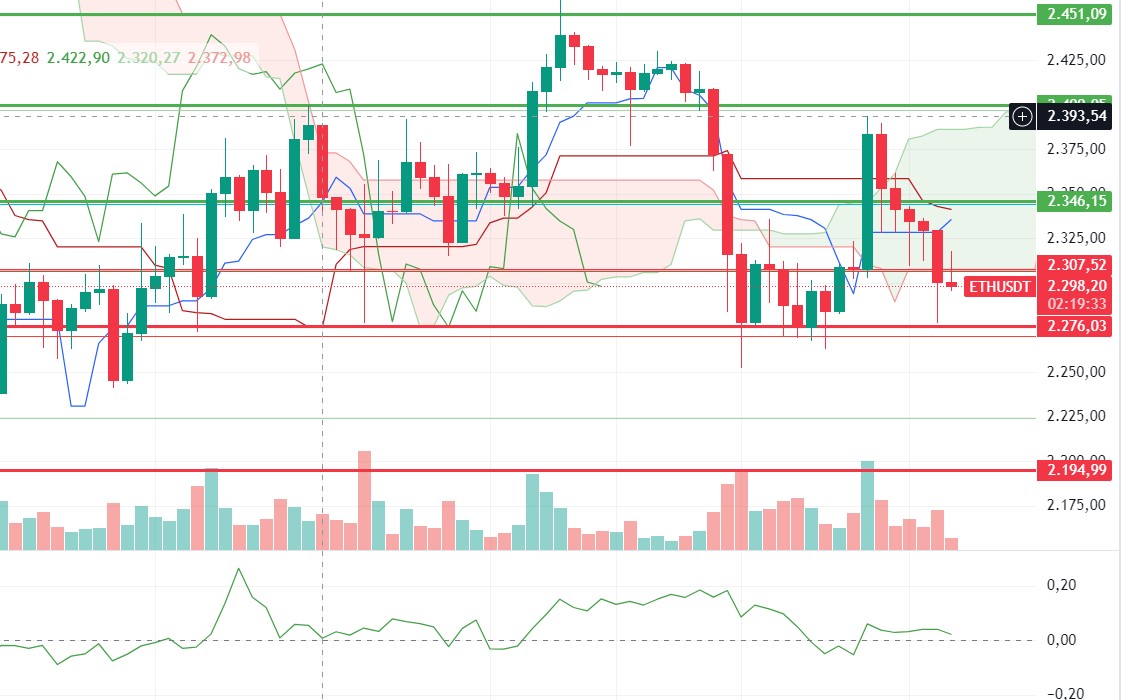
Ethereum, which broke the kumo cloud support during the day and reacted from 2,276 support, is trying to regain the 2,300 level. Despite the decline, it seems positive that CMF remains above the 0 line and remains horizontal. There also seem to be reversal signals on OBV and RSI. Liquidation blocks accumulated at 2,400 levels also strengthen this thesis. Provided that the 2,276 zone is not lost, it is expected to see upward pricing. Loss of this region may cause declines down to 2,194 levels.
Supports 2,276 – 2,195 – 2,112
Resistances 2,346 – 2,400 – 2,451
LINK/USDT
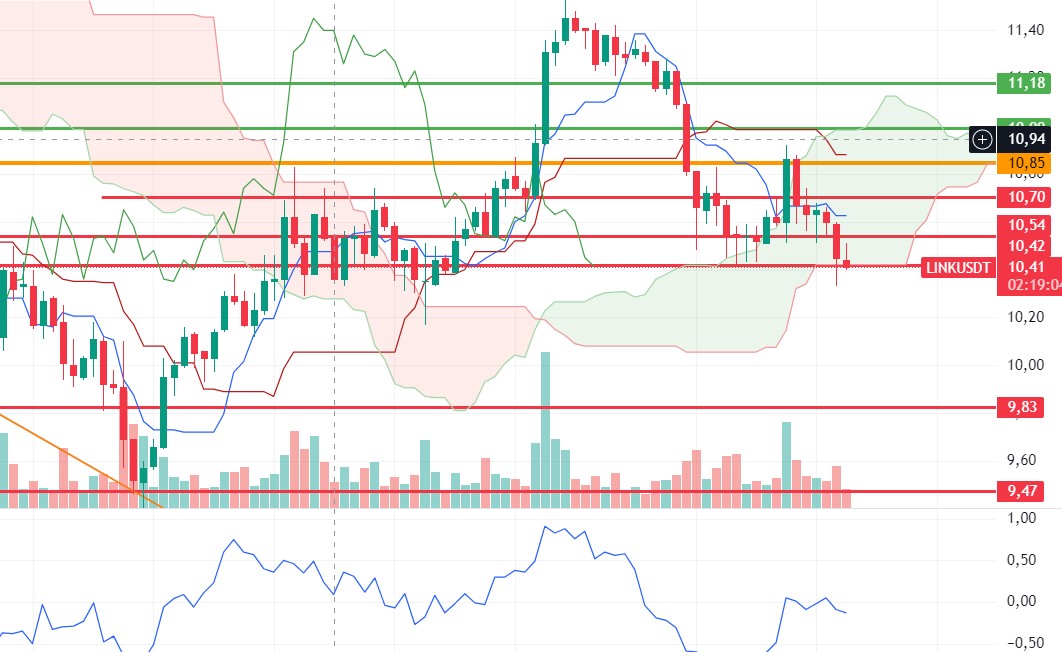
LINK, which fell with the loss of 10.54, remained above the main support level of 10.42. As of now, the positive outlook in Momentum and CMF continues. However, closes below 10.42 may bring new lows. For a positive scenario, 10.54 and then 10.85 levels need to be regained.
Supports 10.54 – 10.42 – 9.83
Resistances 10.70 – 10.85 – 10.99
SOL/USDT
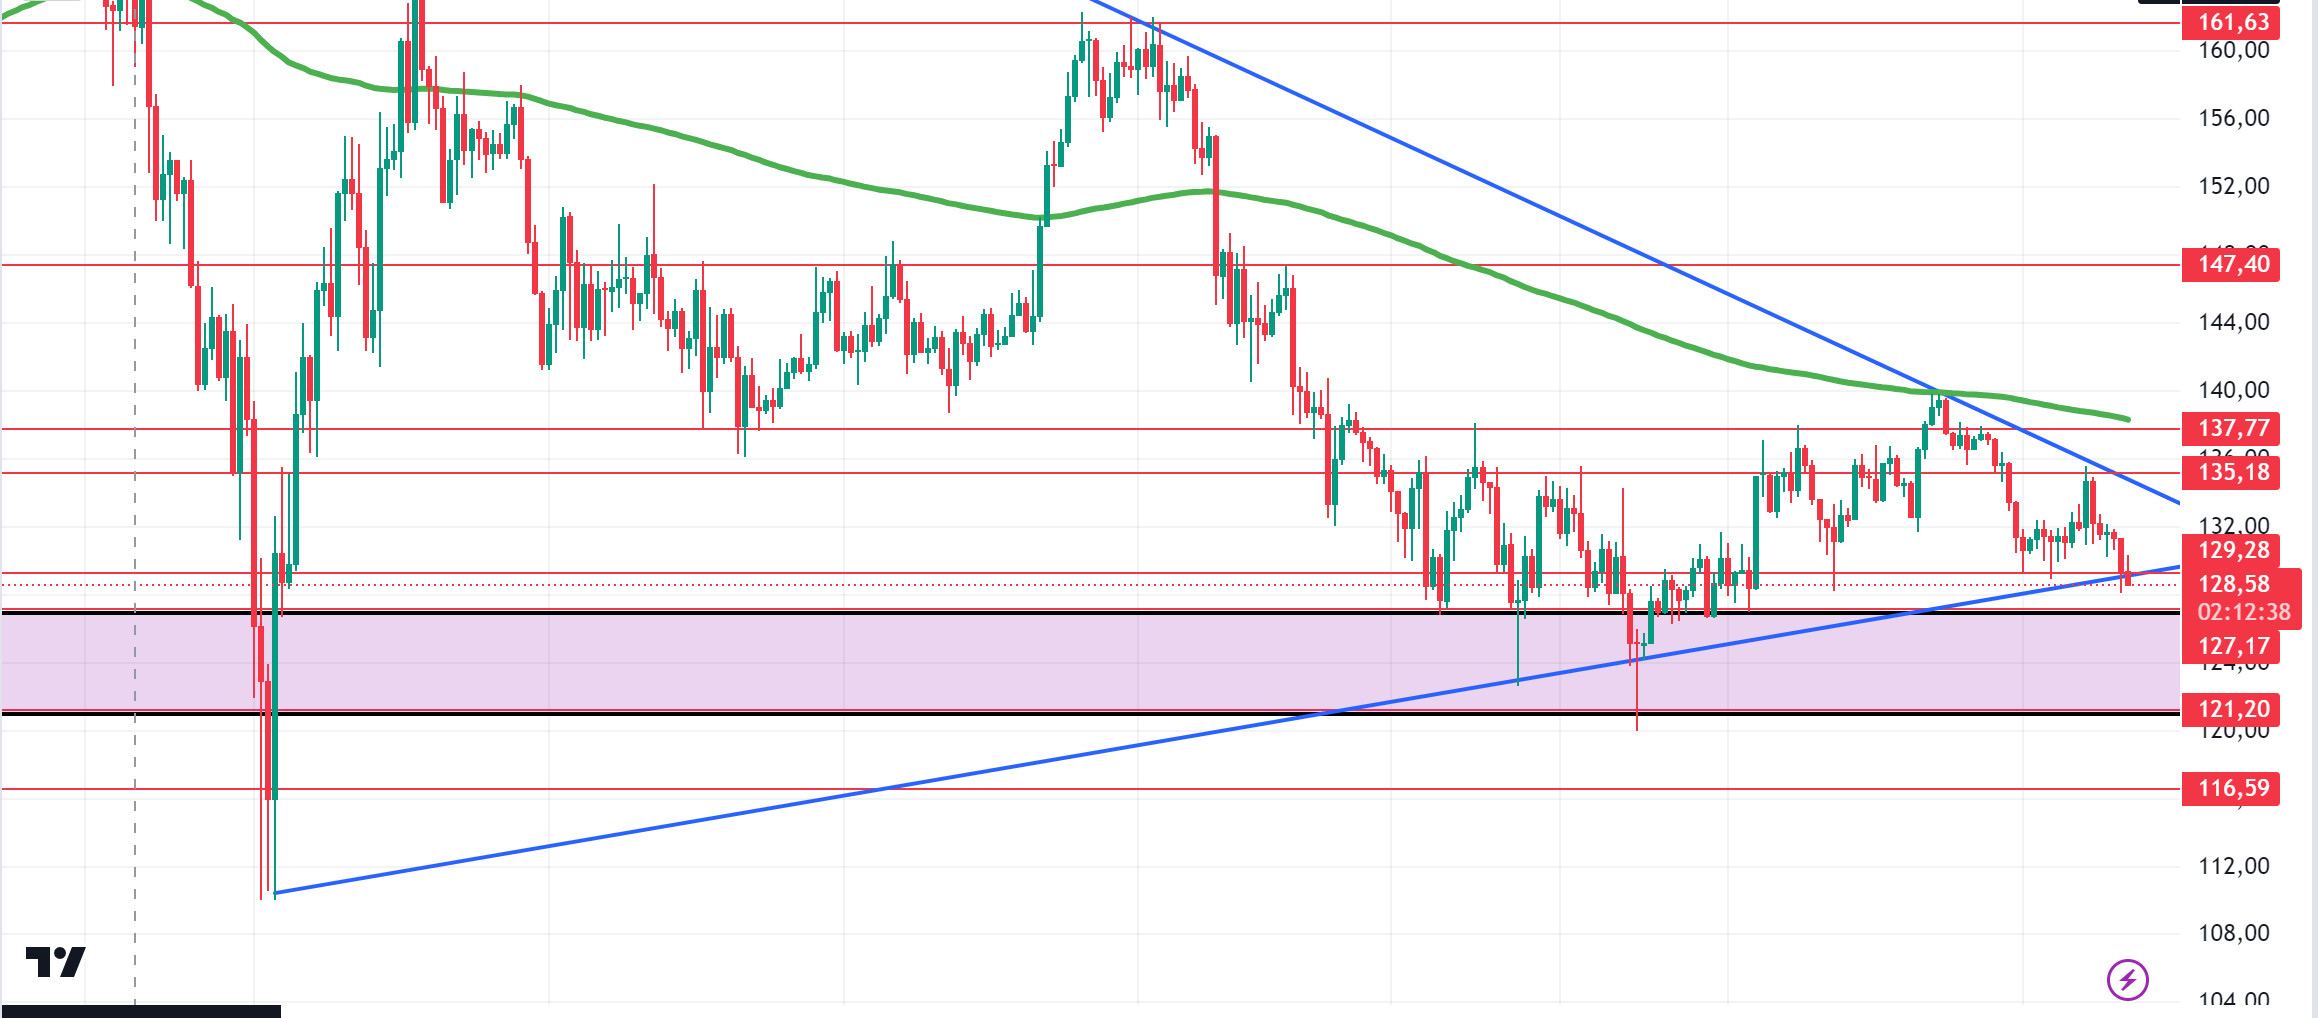
The market declined while waiting for today’s interest rate decision. We can think that this decline was due to the profit sales stemming from yesterday’s rise by investors who predicted that the interest rate would fall by 25 basis points. However, it should be noted that the general market expectation is that the policy rate will fall and the market will rise. Although the number of investors using this as an inverse indicator is not small, it may also be the source of the morning declines. Solana has been trading in a narrowing triangle pattern for a long time. It is currently priced at the bottom of the pattern due to the morning declines. Both macroeconomic conditions and innovations in the Solana ecosystem, 135.18 – 137.77 levels appear as resistance levels. If it rises above these levels, the rise may continue. It should be noted that the price has not yet broken above the
200 EMA. In the event that investors move in the opposite direction due to possible macroeconomic news and the rise in BTC dominance, a potential rise should be followed if it reaches the support levels of 129.28 – 127.17.
Supports 129.28 – 127.17 – 121.20
Resistances 135.18 – 137.77 – 147.40
ADA/USDT
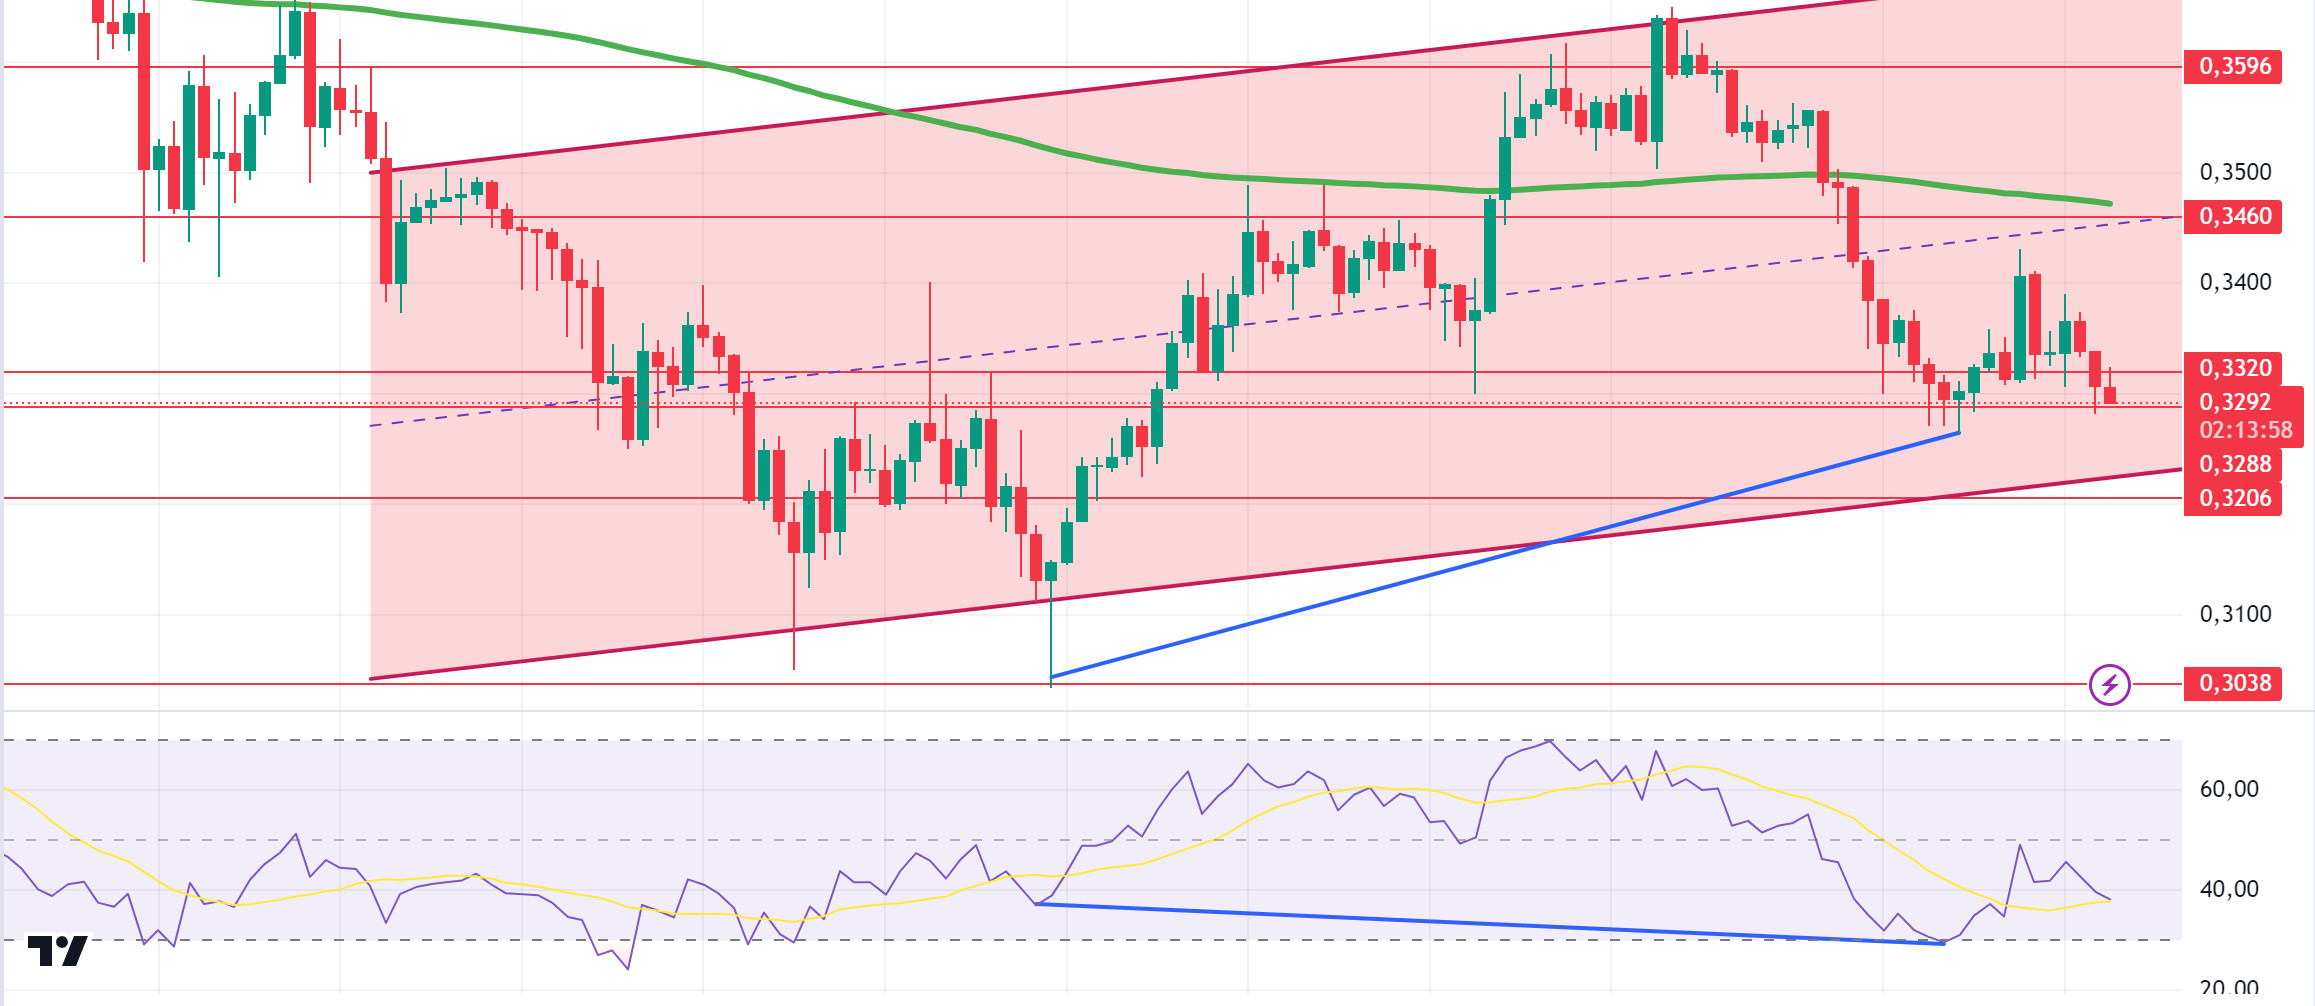
The market fell while waiting for today’s interest rate decision. We can think that this decline was due to the profit sales stemming from yesterday’s rise by investors who predicted that the interest rate would fall by 25 basis points. However, it should be noted that the general market expectation is that the policy rate will fall and the market will rise. Although the number of investors using this as a reverse indicator is not small, it may also be the source of the morning declines. Technically, Cardano has been pricing in a falling channel for the last five months. For ADA, the 0.3288 level may be the bottom of the correction. When we look at the RSI indicator, there is a mismatch on the 4-hour chart. It is possible to see this as a bullish harbinger. On the other hand, ADA continues to stay below the EMA200 moving average. This shows us that there is still bearish pressure. Despite this, its price is hovering above a critical resistance.
0.3288 is a strong support in case of a pullback due to general market movements. If macroeconomic data raises BTC, 0.3460 – 0.3596 levels can be followed as resistance levels in the rises that will take place.
Supports 0.3320 – 0.3288 – 0.3206
Resistances 0.3460 – 0.3596 – 0.3724
AVAX/USDT
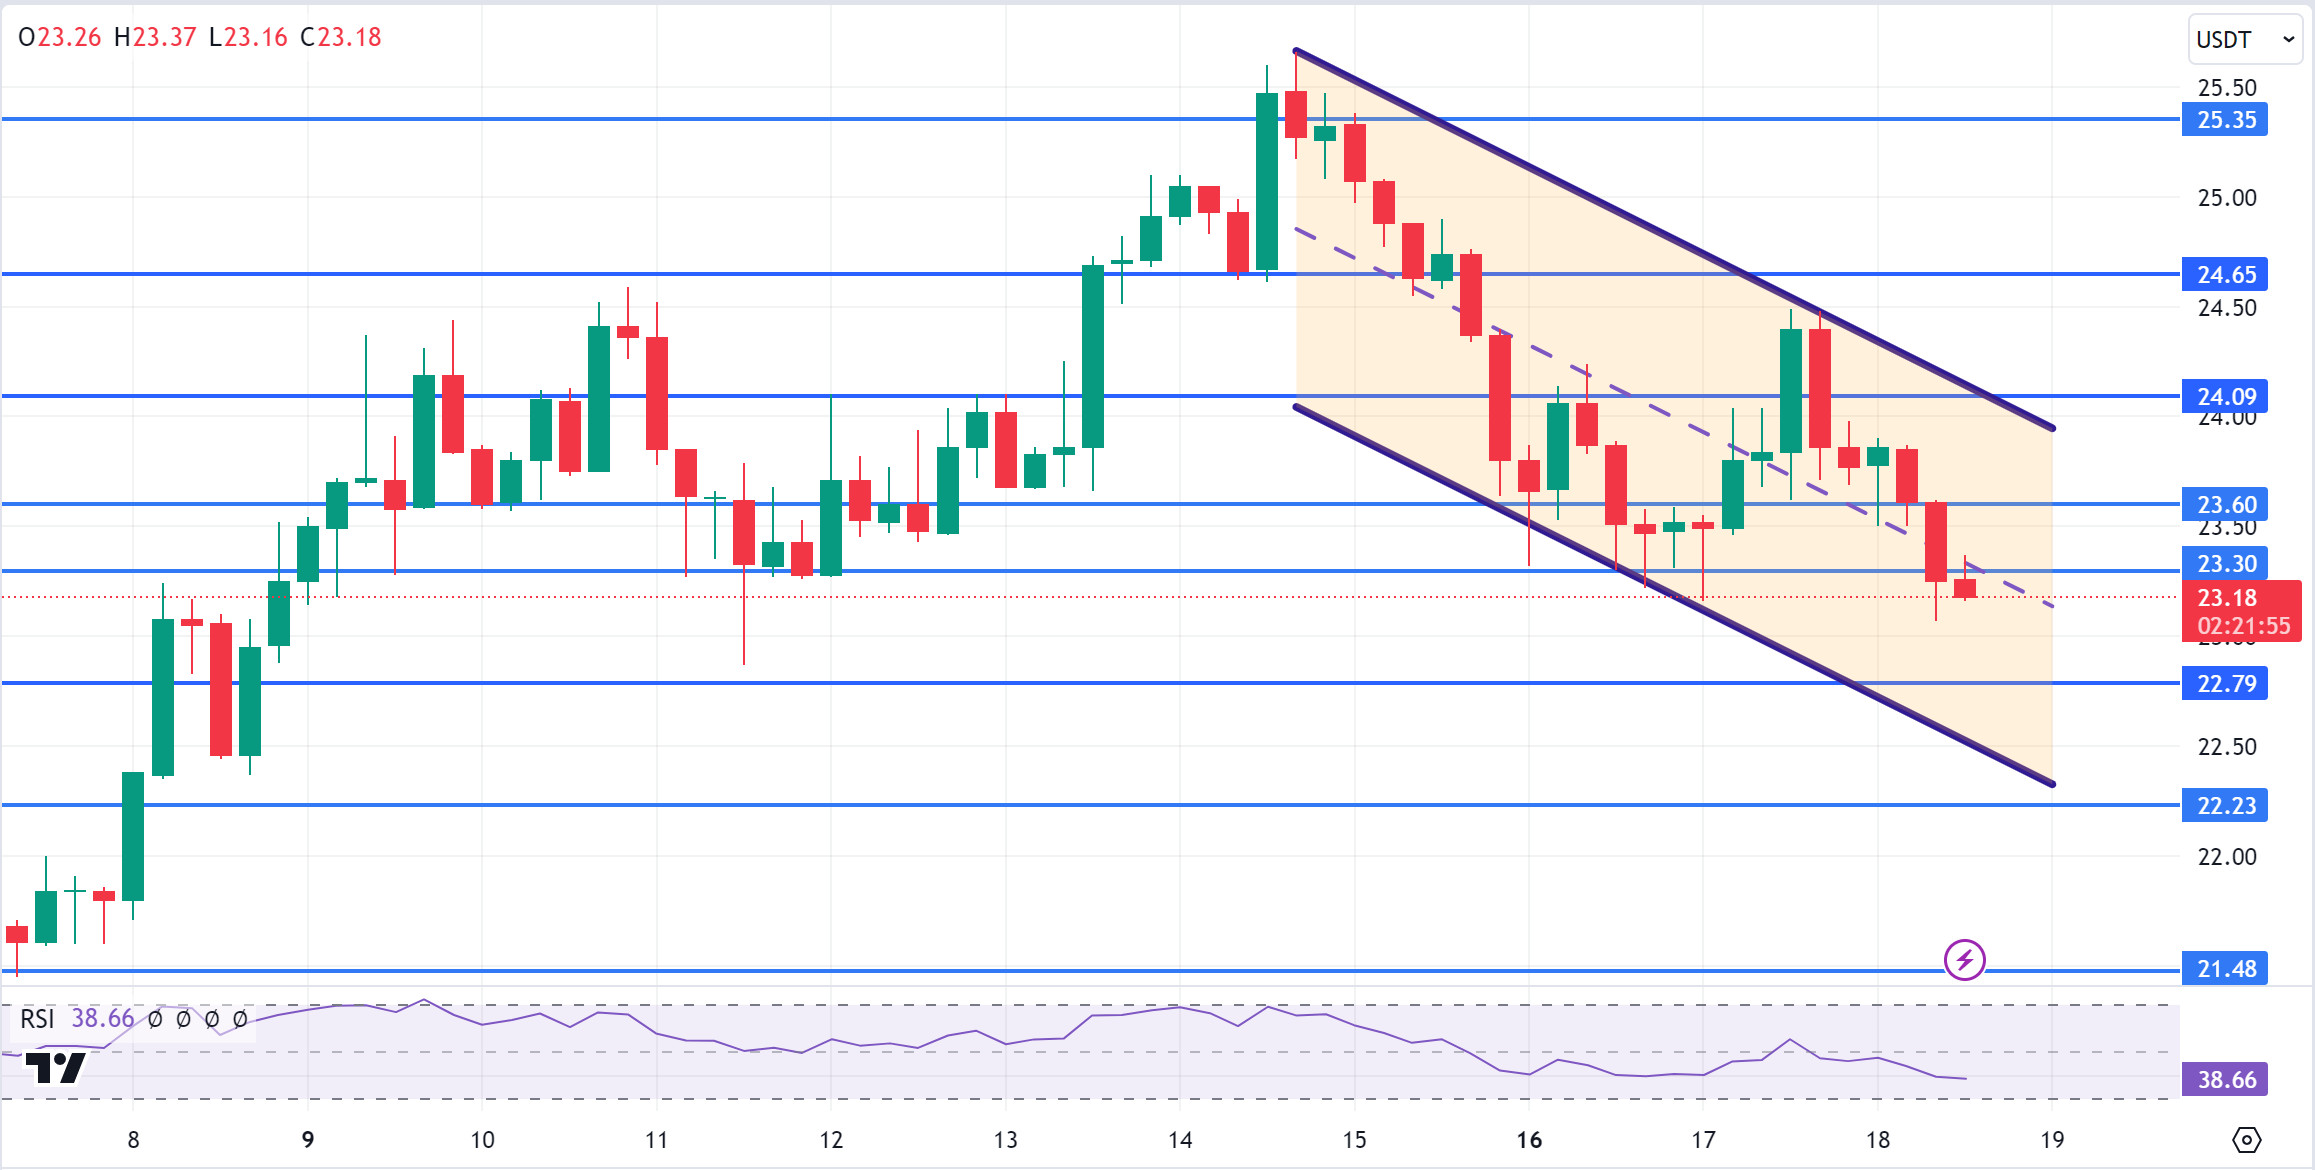
AVAX, which opened today at 23.78, fell about 2% during the day and is trading at 23.18. Today, the FED interest rate decision will be announced in the evening and then FED chairman Powell’s speech will take place. The market can be expected to have high volatility during the interest rate decision and Powell’s speech.
AVAX continues its movement within the falling channel on the 4-hour chart before the interest rate decision. It is in the middle band of the channel and tries to break the 23.30 resistance. With the selling pressure from this resistance, it may want to move to the lower band of the channel. In this case, it may test 22.79 and 22.23 supports. By breaking the 23.30 resistance and closing the candle above it, it can target the upper band of the channel and test the 23.60 and 24.09 resistances. As long as it stays above 20.38 support during the day, the desire to rise may continue. With the break of 20.38 support, selling pressure may increase.
Supports 22.79 – 22.23 – 21.48
Resistances 23.30 – 23.60 – 24.09
TRX/USDT
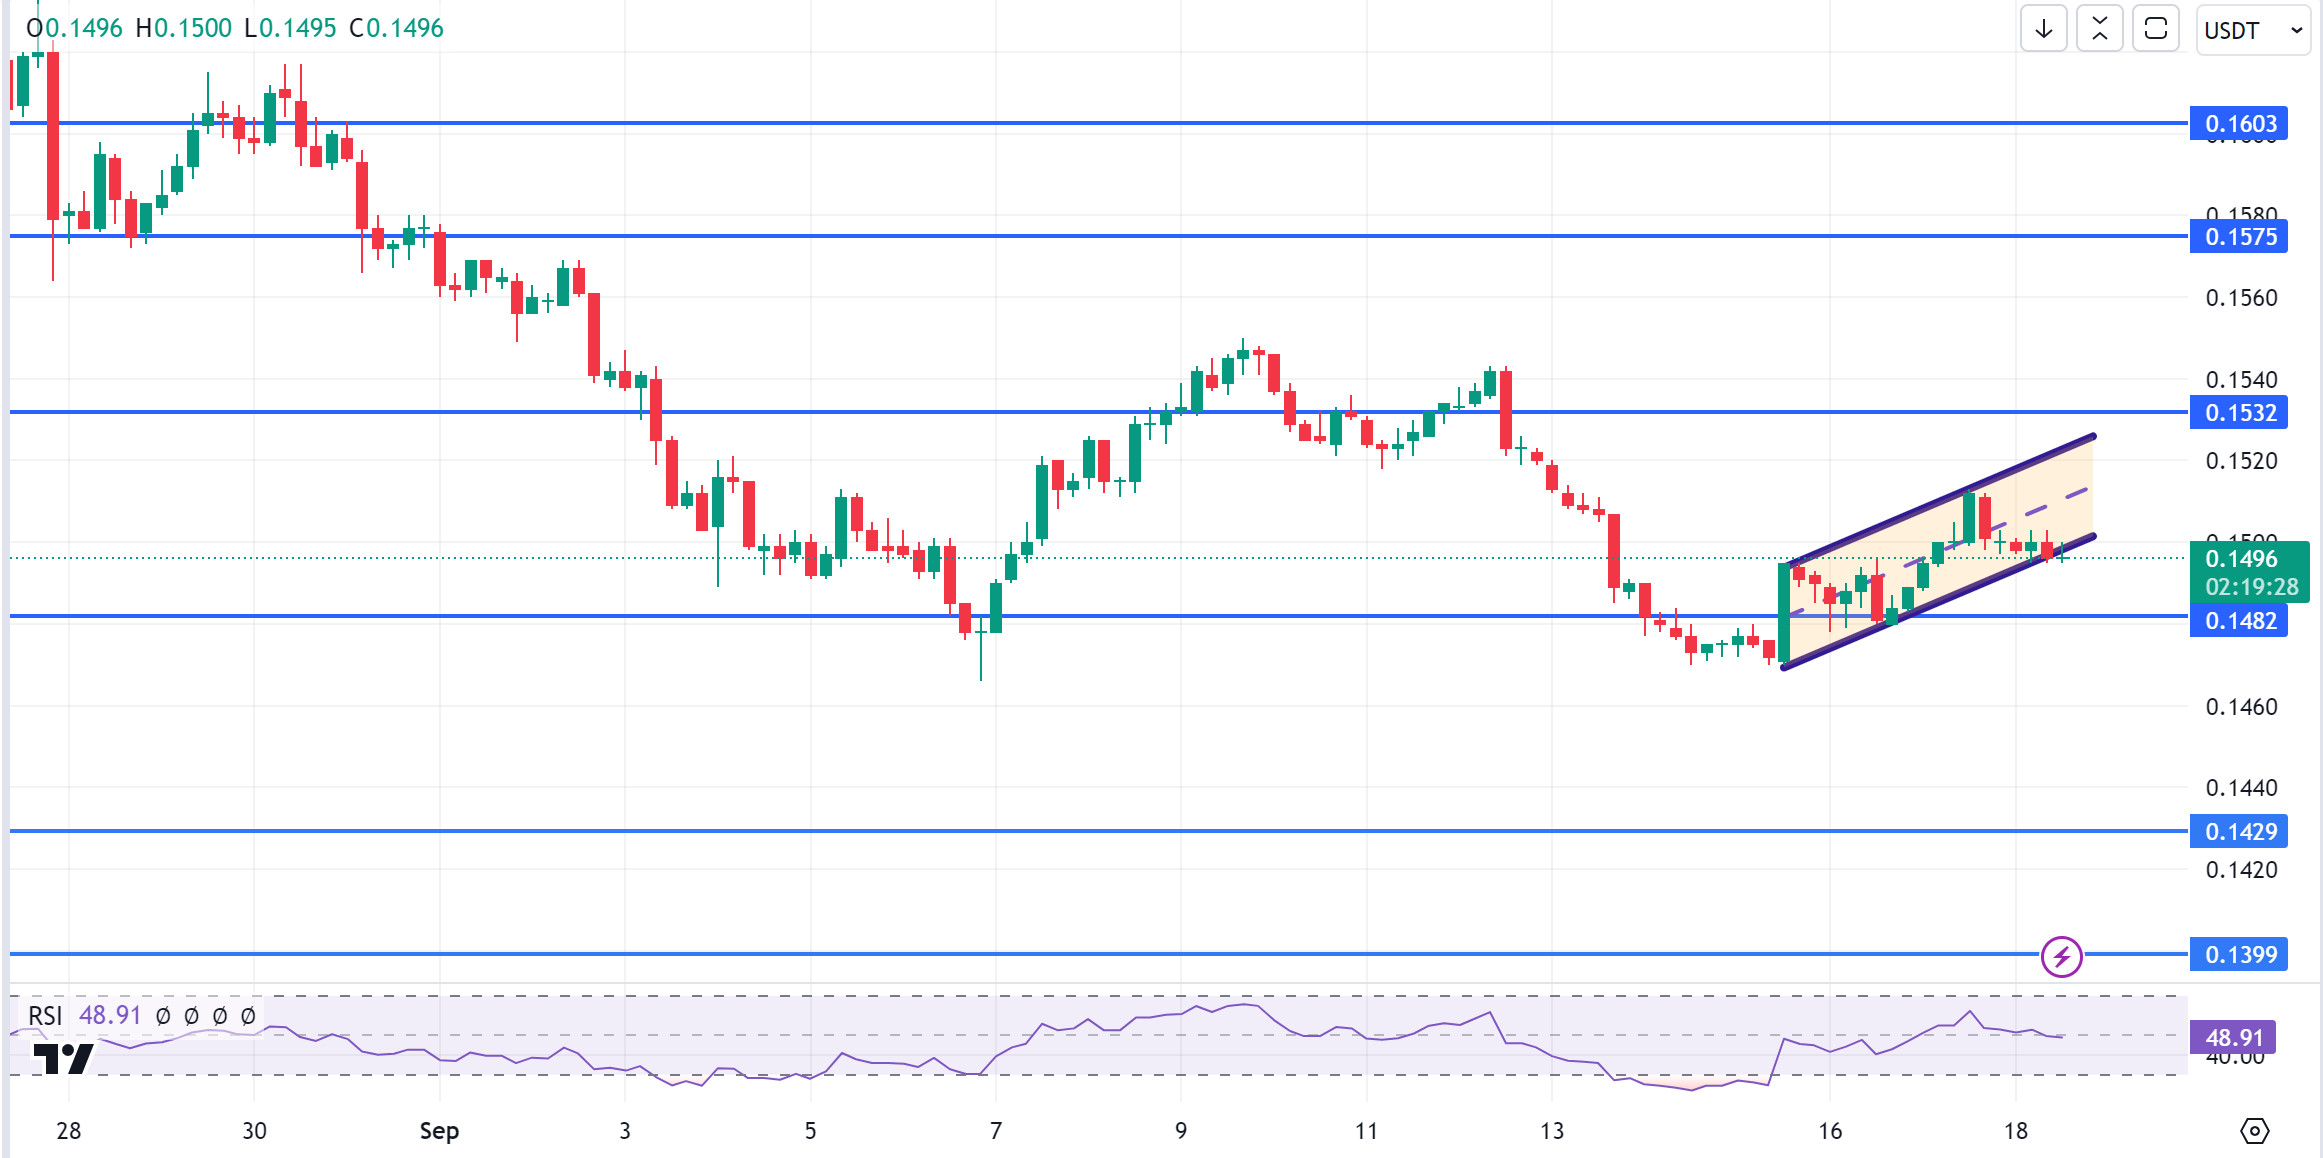
TRX, which started today at 0.1500, continues its horizontal movement during the day and is currently priced at 0.1496. Depending on the FED interest rate decision to be announced today, the market will determine the direction and TRX will be affected by this movement. During the week, low-volume transactions may be replaced by high-volume transactions and the interest rate decision may cause high volatility.
On the 4-hour chart, TRX, which is in the rising channel, is in the lower band of the rising channel and a buying reaction can be expected to come from here. In such a case, it may move to the middle and upper band of the channel and test the 0.1532 resistance. With no reaction from the lower band of the channel and breaking the lower band downwards, it may want to test 0.1482 support. As long as TRX stays above 0.1482 support, the desire to rise may continue. If this support is broken downwards, sales can be expected to increase.
Supports 0.1482 – 0.1429 – 0.1399
Resistances 0.1532 – 0.1575 – 0.1603
XRP/USDT
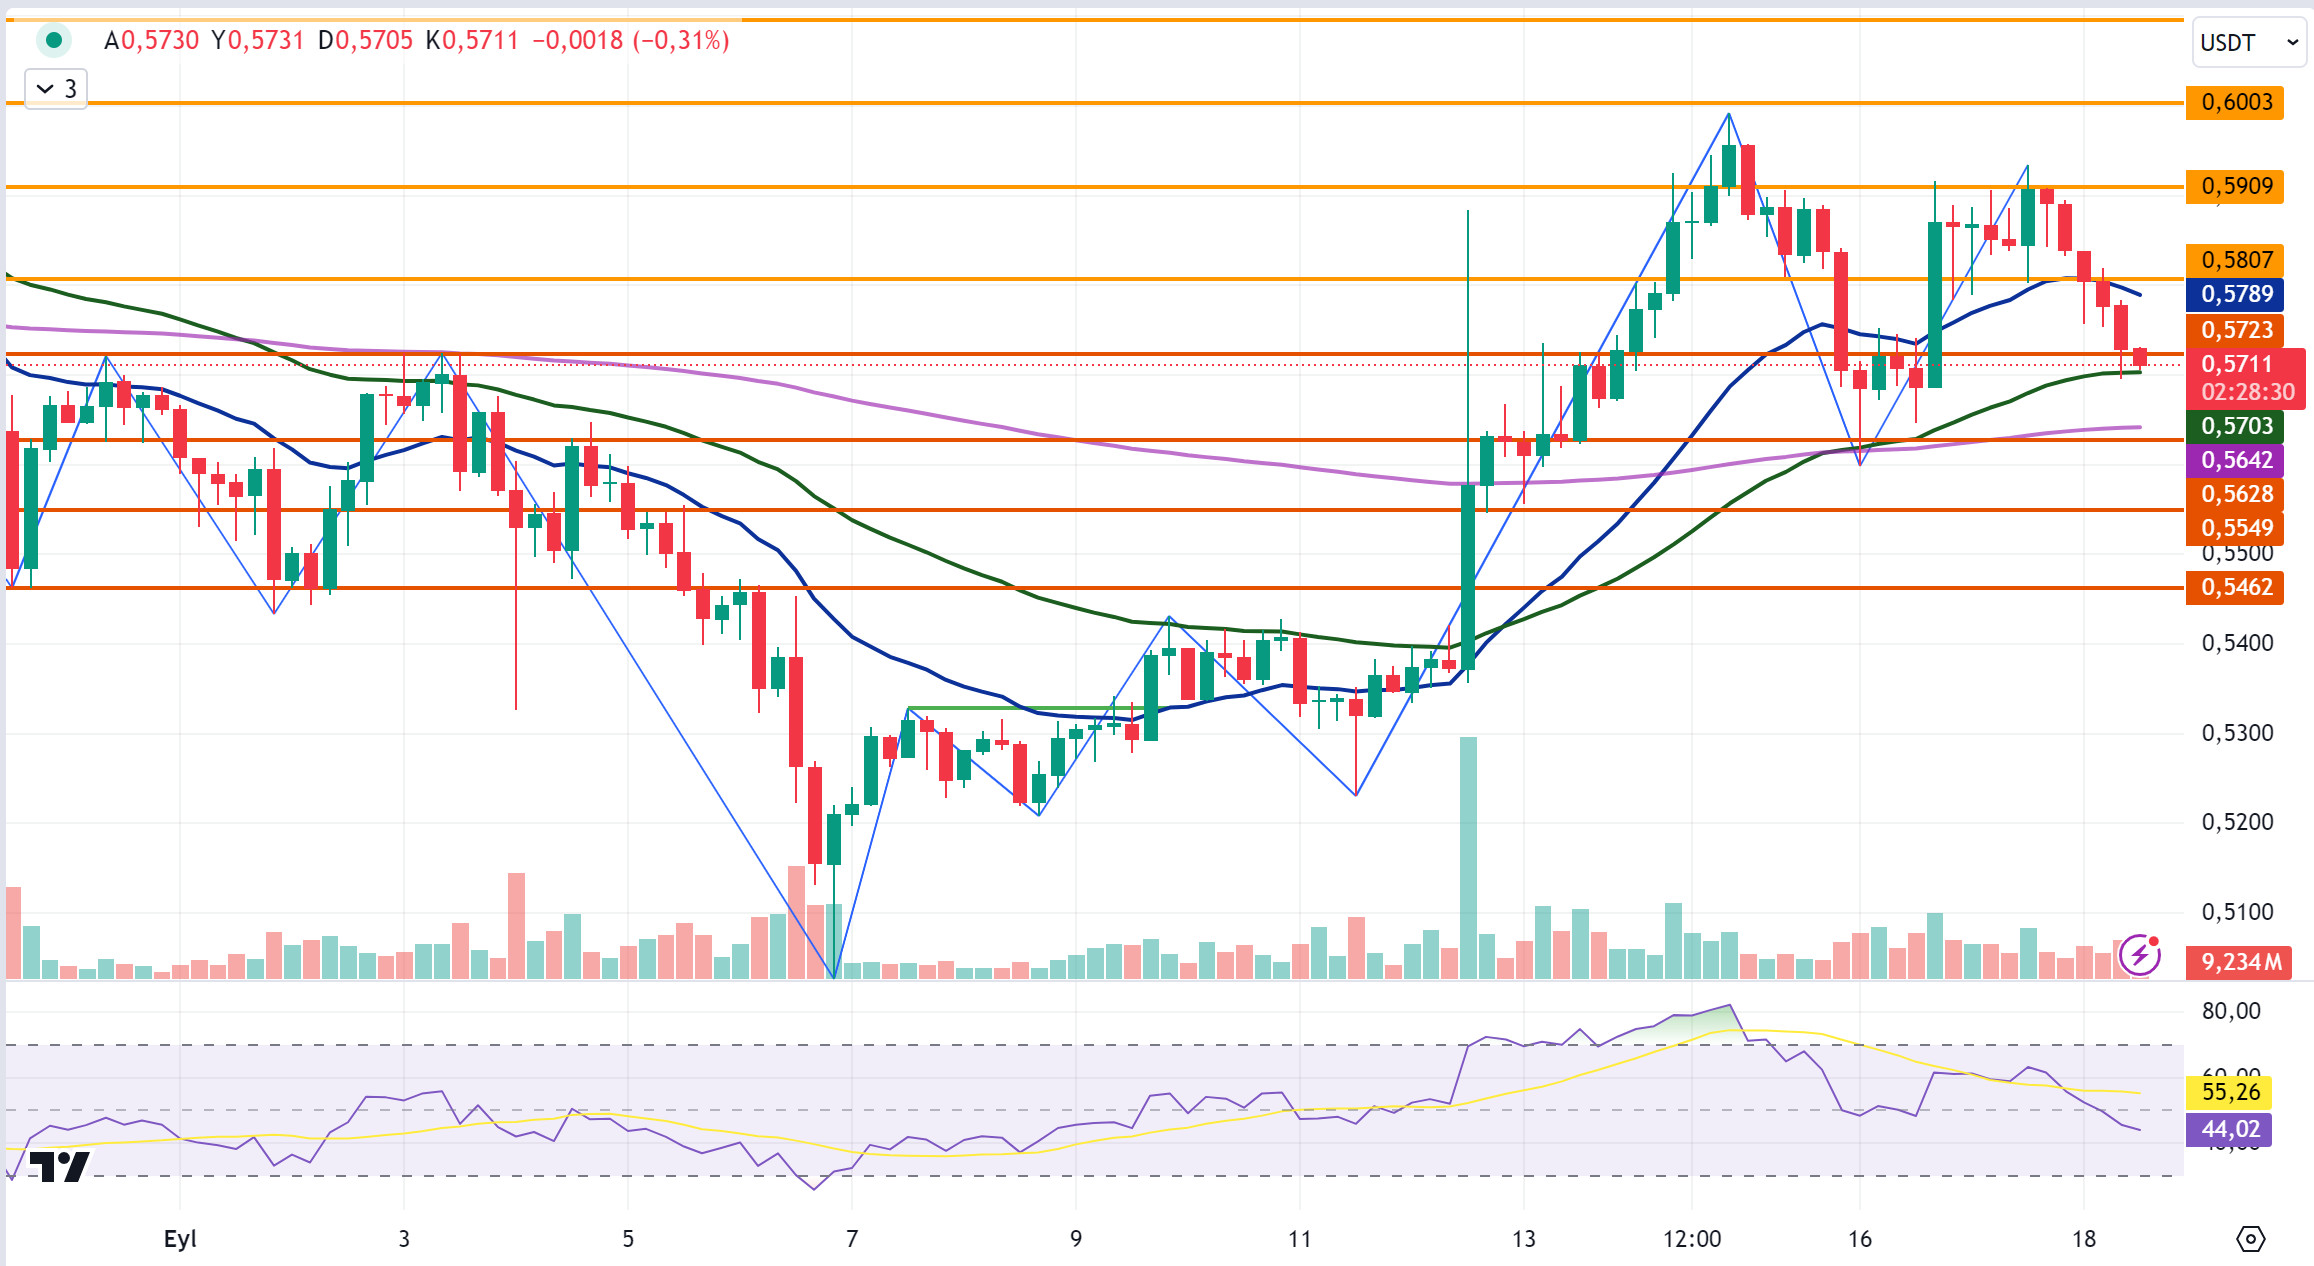
XRP continues to trade at 0.5711 with a 2% depreciation today. XRP, which was in the falling channel in the 4-hour analysis today, continued to decline with reaction sales at 0.5807 and EMA20 when it started to rise, and closed before the last candle at 0.5723 with the purchases coming after falling to the EMA50 level. In the 4-hour analysis, it continues to trade between 0.5723 and EMA50 levels, failing to break the EMA50 level after retesting below 0.5723 on the last candle. If the decline in XRP continues and the EMA50 level is broken, it may test the support levels of 0.5628-0.5549-0.5462 with the deepening of the decline. If the 0.5723 and EMA50 level is not broken and it is bullish with the incoming purchases, it may test the resistance levels of 0.5807-0.5909-0.6003.
In the 4-hour analysis, if XRP breaks the 0.5723 and EMA50 level downwards, it may offer a short trading opportunity as the decline deepens. On the contrary, with the purchases that may come, it may offer a long trading opportunity with the rise after failing to break these levels.
EMA20 (Blue Line) – EMA50 (Green Line) – EMA200 (Purple Line)
Supports 0. 5 628 – 0.5549 – 0.5462
Resistances 0.5807 – 0.5909 – 0.6003
DOGE/USDT
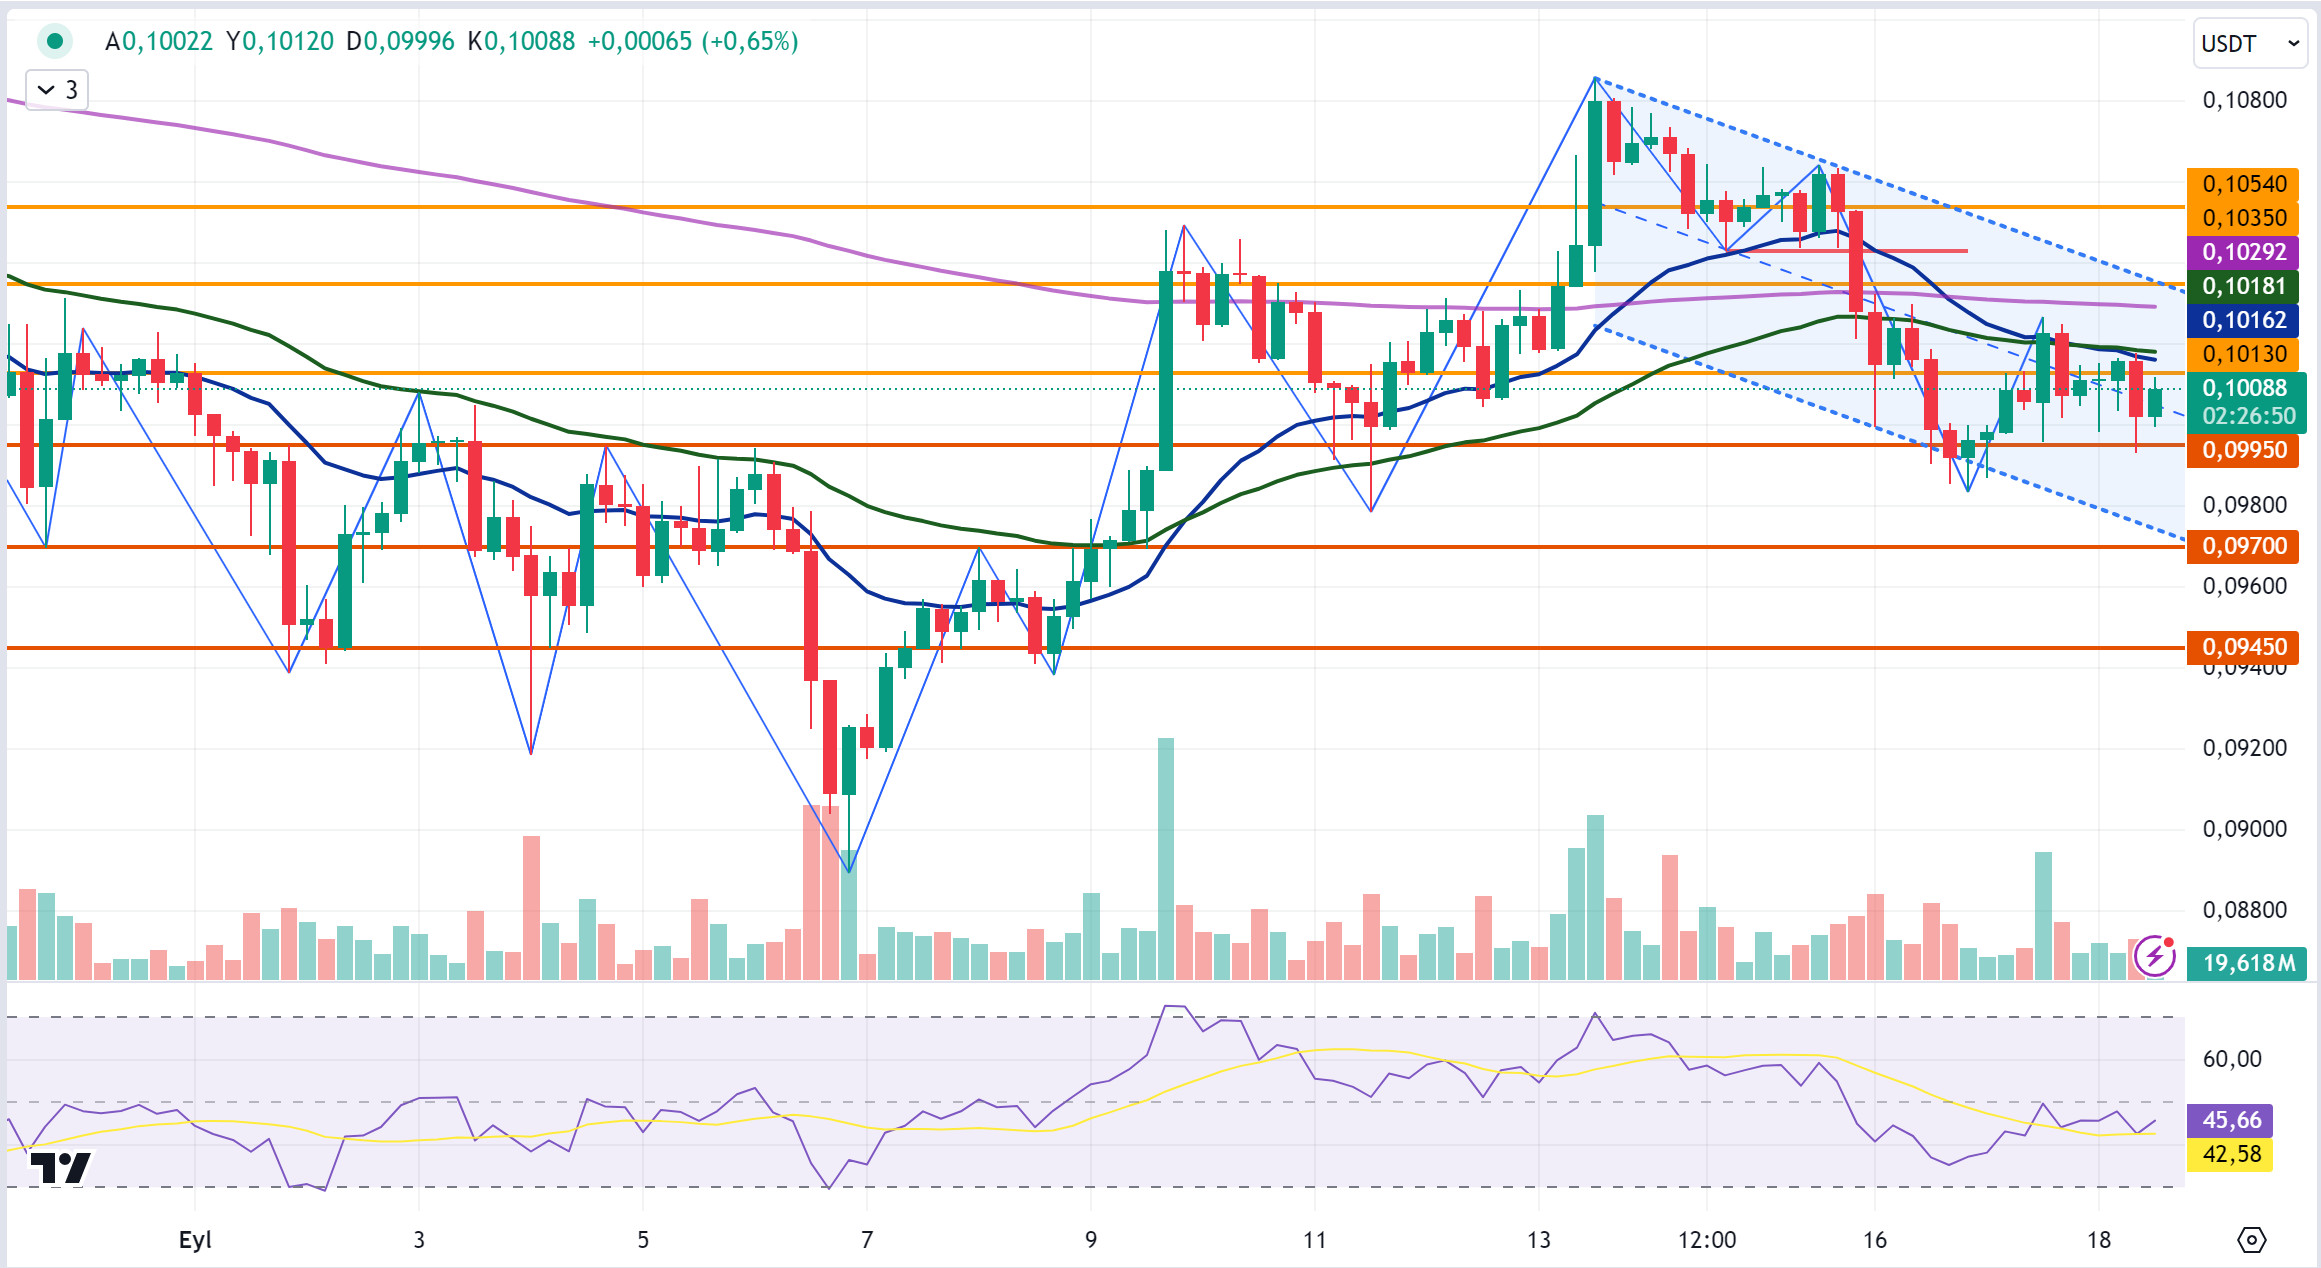
In the 4-hour analysis today, DOGE declined with the reaction sales at the EMA20 and EMA50 levels in its rise in the 4-hour analysis and fell to the starting level of the day. It is currently trading at 0.1008. Before the FED interest rate decision to be announced today, there may be a sharp decline or rise with the movement in DOGE. DOGE, which continues to be traded between 0.0995 and 0.1013, can test the resistance levels of 0.1013-0.1035-0.1054 if it continues to rise. In case of a decline, it may test support levels of 0.0995-0.0970-0.0945.
Today, ahead of the FED interest rate decision, DOGE may decline and offer a short trading opportunity with the reaction sales that may come at 0.1013 and EMA20 and EMA50 levels. In case of a decline, the 0.0995 support point stands out and may rise with the purchases that may come at this level and may offer a long trading opportunity.
EMA20 (Blue Line) – EMA50 (Green Line) – EMA200 (Purple Line)
Supports 0.0995 – 0.0970 – 0.0945
Resistances 0.1013 – 0.1 035 – 0.1054
DOT/USDT
Unique Network introduced NFT XCM technology in the Polkadot ecosystem, which enables the transfer of NFTs between different parachains. This innovation facilitates cross-chain portability of NFTs, opening new opportunities for developers and users. NFT XCM aims to expand the reach and use cases of NFTs using Polkadot’s Cross-Chain Messaging (XCM) technology.
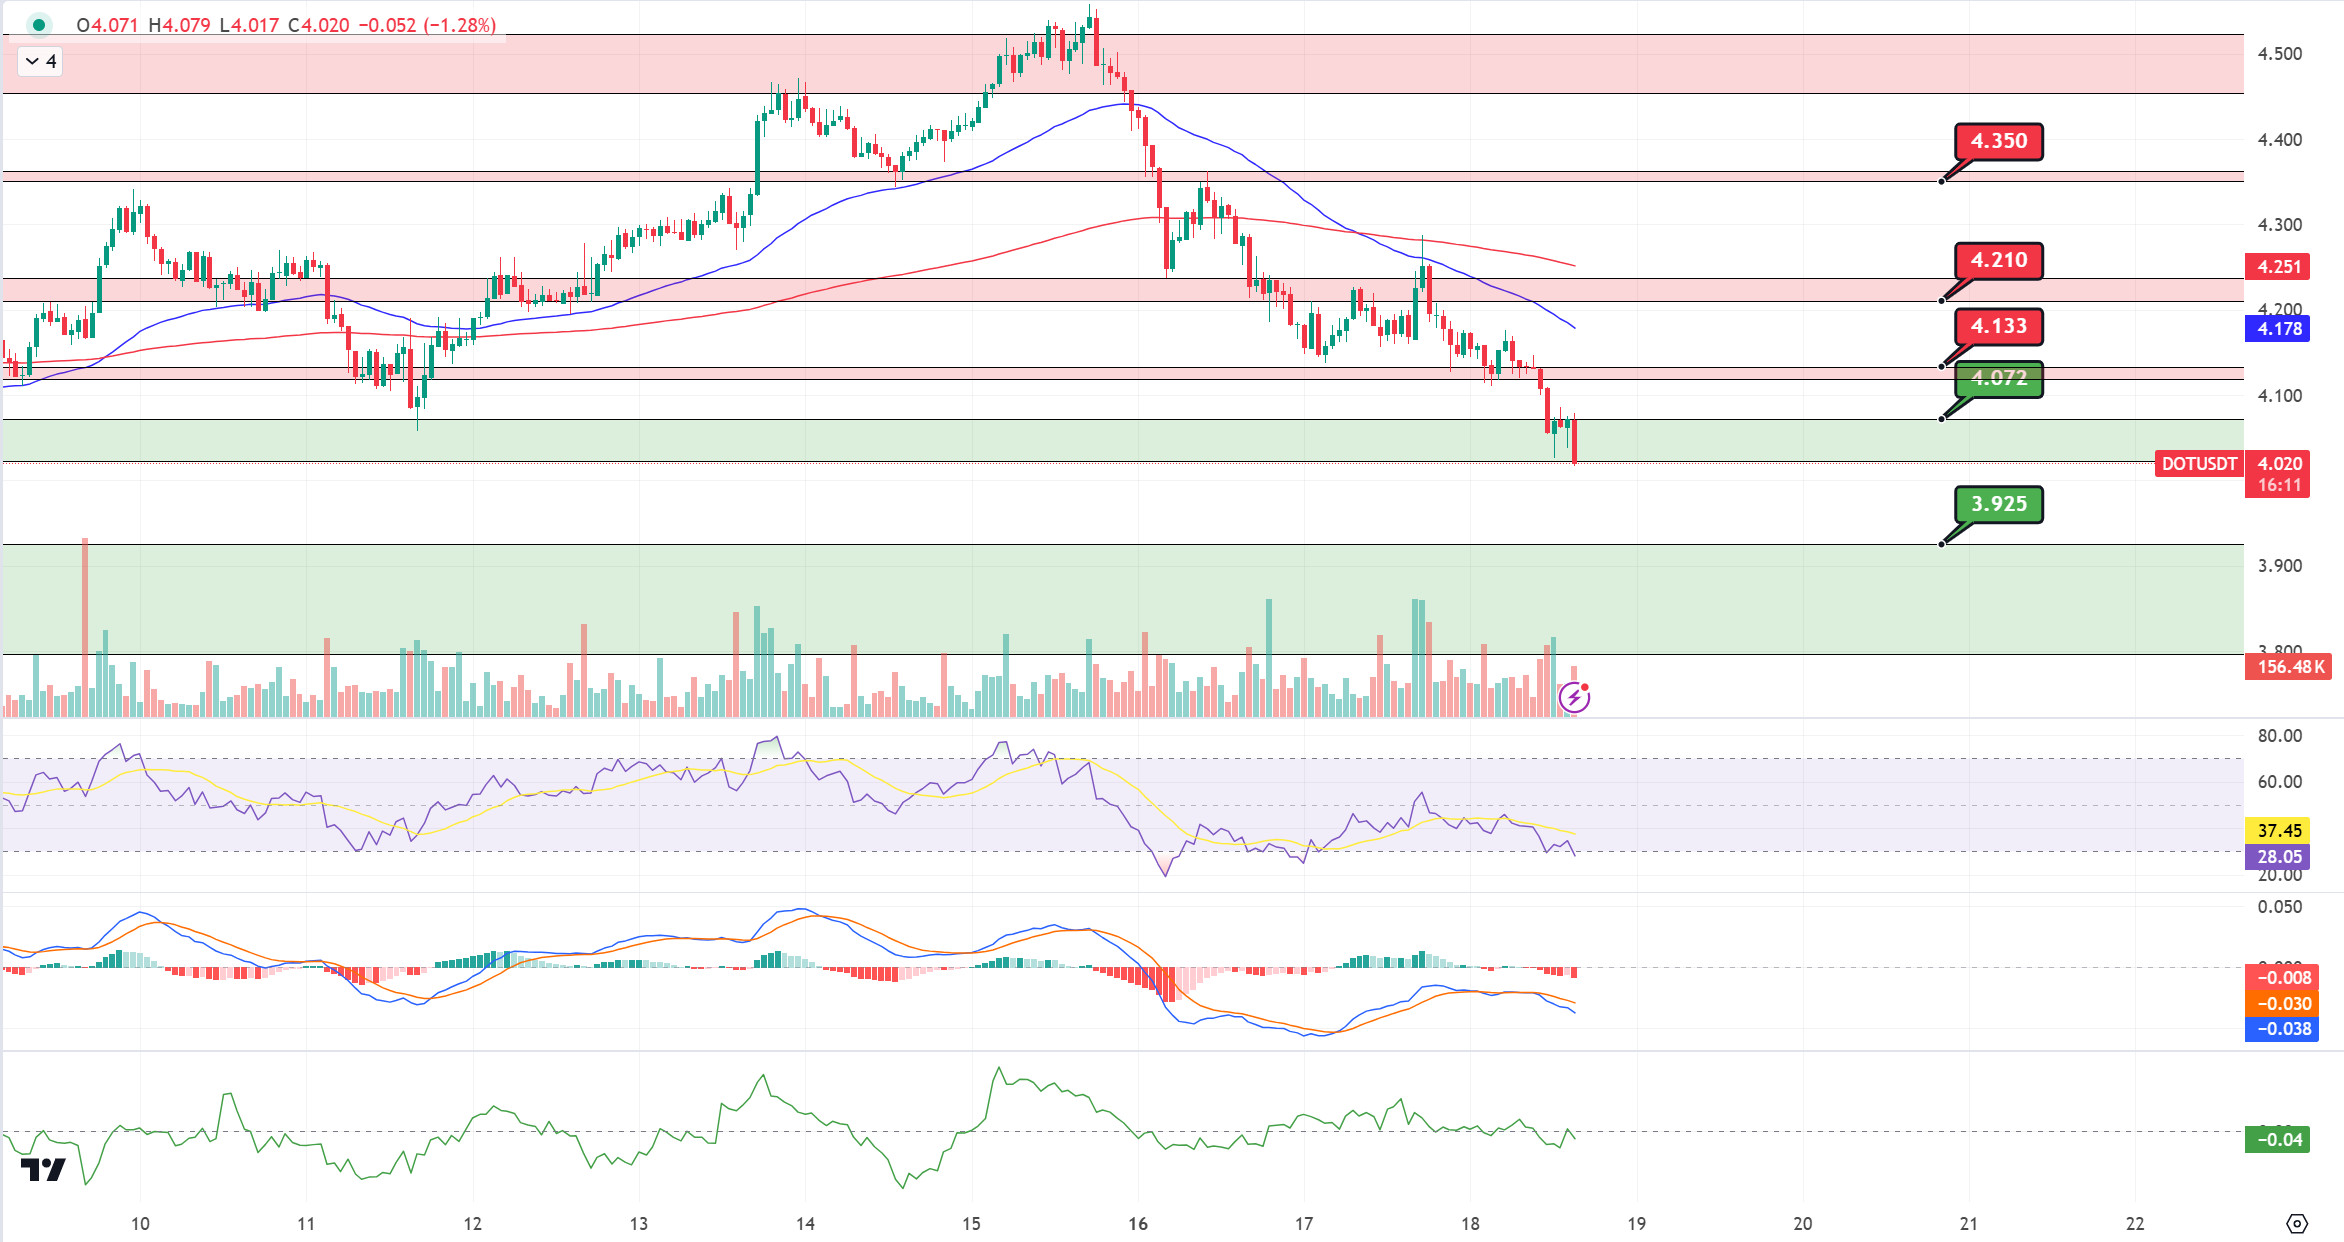
When we examine the Polkadot (DOT) chart, the price seems to have broken the 4.133 support band down. When we examine the MACD oscillator, we see that the selling pressure increased compared to the previous hour. In the negative scenario, if the price loses the 4.072 support band, it may fall to the next support level of 3.925. On the other hand, if we evaluate the positive mismatch on the RSI, the price may want to test the 4.133 levels if it can hold above the 4.072 support.
(Blue line: EMA50, Red line: EMA200)
Supports 4,072 – 3,925 – 3,590
Resistances 4.133 – 4.210 – 4.350
SHIB/USDT
The Shiba Inu (SHIB) ecosystem, in partnership with K9 Finance, has launched a liquid staking protocol on the Shibarium network. Users can now earn rewards by staking BONE tokens and redeem the staked tokens as knBONE. This feature can increase the burn rate of SHIB tokens by increasing the total value locked (TVL) and transaction volume on the Shibarium network.
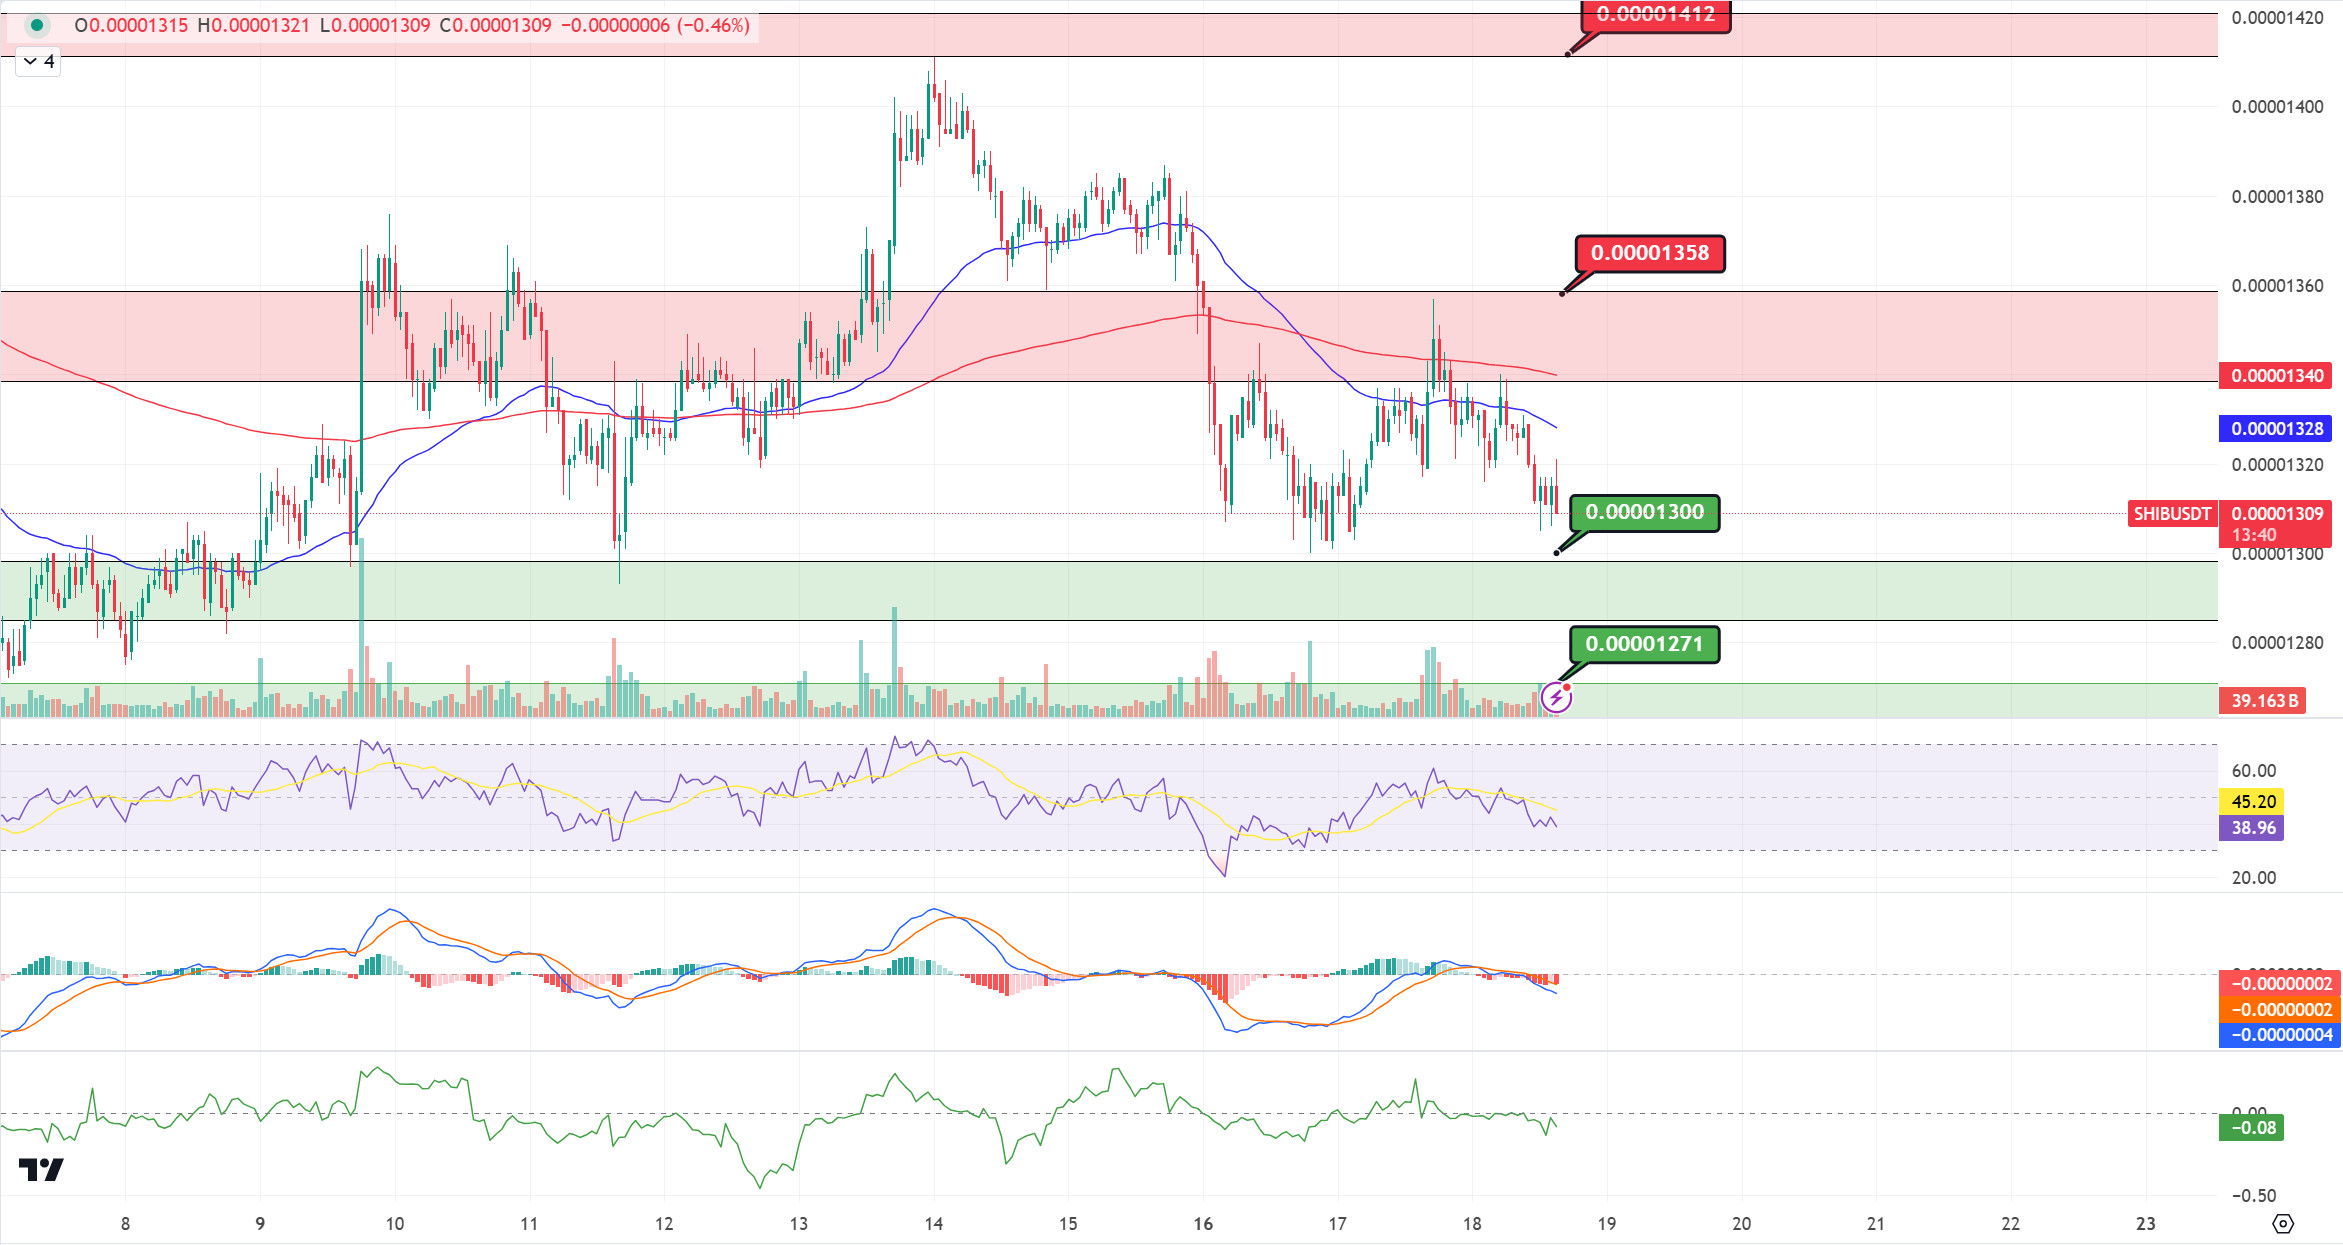
When we examine the SHIB chart, the price is moving towards 0.00001300 levels. When we examine the MACD and CMF oscillator, we can say that the selling pressure continues. In this context, the price may retreat towards the 0.00001300 level. In the positive scenario, if the selling pressure decreases, the price may want to test the 0.00001358 resistance band.
(Blue line: EMA50, Red line: EMA200)
Supports 0.00001300 – 0.00001271 – 0.00001227
Resistances 0.00001358 – 0.00001412 – 0.00001443
LEGAL NOTICE
The investment information, comments and recommendations contained herein do not constitute investment advice. Investment advisory services are provided individually by authorized institutions taking into account the risk and return preferences of individuals. The comments and recommendations contained herein are of a general nature. These recommendations may not be suitable for your financial situation and risk and return preferences. Therefore, making an investment decision based solely on the information contained herein may not produce results in line with your expectations.


