
MARKET SUMMARY
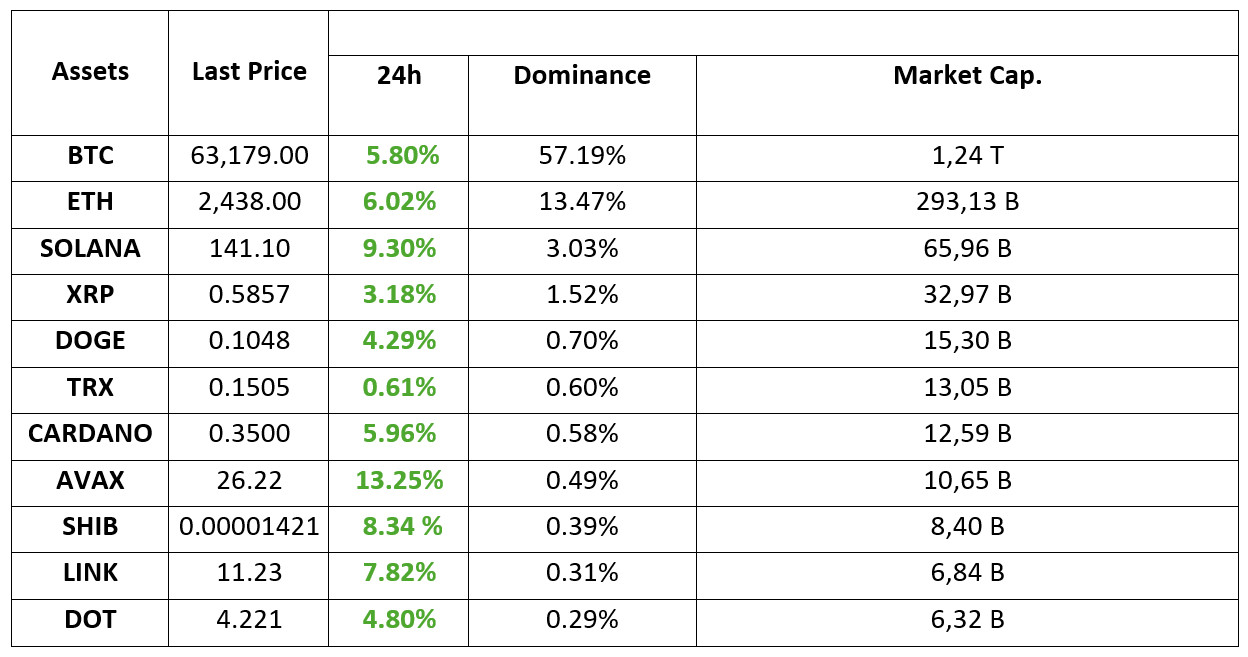
Latest Situation in Crypto Assets
*Prepared on 19.09.2024 at 14:00 (UTC)
WHAT’S LEFT BEHIND
After the FED Interest Rate Decision
The expectations of Fed members for more rate cuts in 2025 have been reflected in the projections on the Dot Plot. While most members foresee additional cuts for the remainder of 2024, they expect this process to continue into 2025. The distribution of members who believe that the current rate, which stands at 4.75%-5.0%, should be further reduced is as follows:
• 7 members expect a 25 basis point cut.
• 9 members argue for a 50 basis point cut.
• 1 member foresees an additional 75 basis point cut.
• 2 members believe no further cuts are necessary this year.
US Unemployment Claims
The US unemployment claims report has been released.
Reported: 219K
Expected: 230K
Previous: 230K
Banana Gun Project Wallets Emptied
Some users reported that their wallets were emptied in the Banana Gun project, whose token was listed on Binance. While the team announced that they were investigating the issue, the project’s Telegram bot was also shut down by the team.
German Bank Commerzbank
Commerzbank, one of Germany’s oldest and largest banks, has partnered with Crypto Finance, a subsidiary of Deutsche Börse. Initially, only Bitcoin and Ether transactions will be offered to institutional clients.
HIGHLIGHTS OF THE DAY
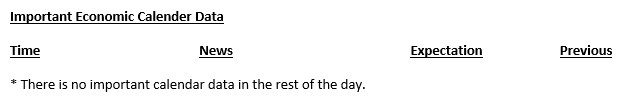
Important Economic Calender Data
Time News Expectation Previous
* There is no important calendar data in the rest of the day.
INFORMATION:
*The calendar is based on UTC (Coordinated Universal Time) time zone. The economic calendar content on the relevant page is obtained from reliable news and data providers. The news in the economic calendar content, the date and time of the announcement of the news, possible changes in the previous, expectations and announced figures are made by the data provider institutions. Darkex cannot be held responsible for possible changes that may arise from similar situations.
MARKET COMPASS
Global markets are monitoring the “post-FED decision” period. Following the Federal Open Market Committee’s (FOMC) “Jumbo” 50 basis point rate cut decision yesterday, European and US stock markets are in positive territory. The fact that the US Federal Reserve (FED) indicated continued rate cuts and does not foresee a recession has increased risk appetite. Along with stock indexes, digital assets have also recorded gains.
Today’s US data shows that Initial Jobless Claims came in lower than expected, while the Philadelphia FED manufacturing index returned to positive territory in September. Despite a rise in the dollar index following these macro indicators, the strength of risk appetite in crypto assets has supported the recent uptrend.
Although the FED’s rate cut cycle is considered a driving force for riskier assets like cryptocurrencies, we believe the equation needs to be more solid for the uptrend in major coins to continue. The upward momentum may persist for a while, but under the assumption that the FED will make data-driven decisions at each meeting, it wouldn’t be surprising to see gains limited after the recent rise, with movements remaining more sideways until new catalysts emerge.
TECHNICAL ANALYSIS
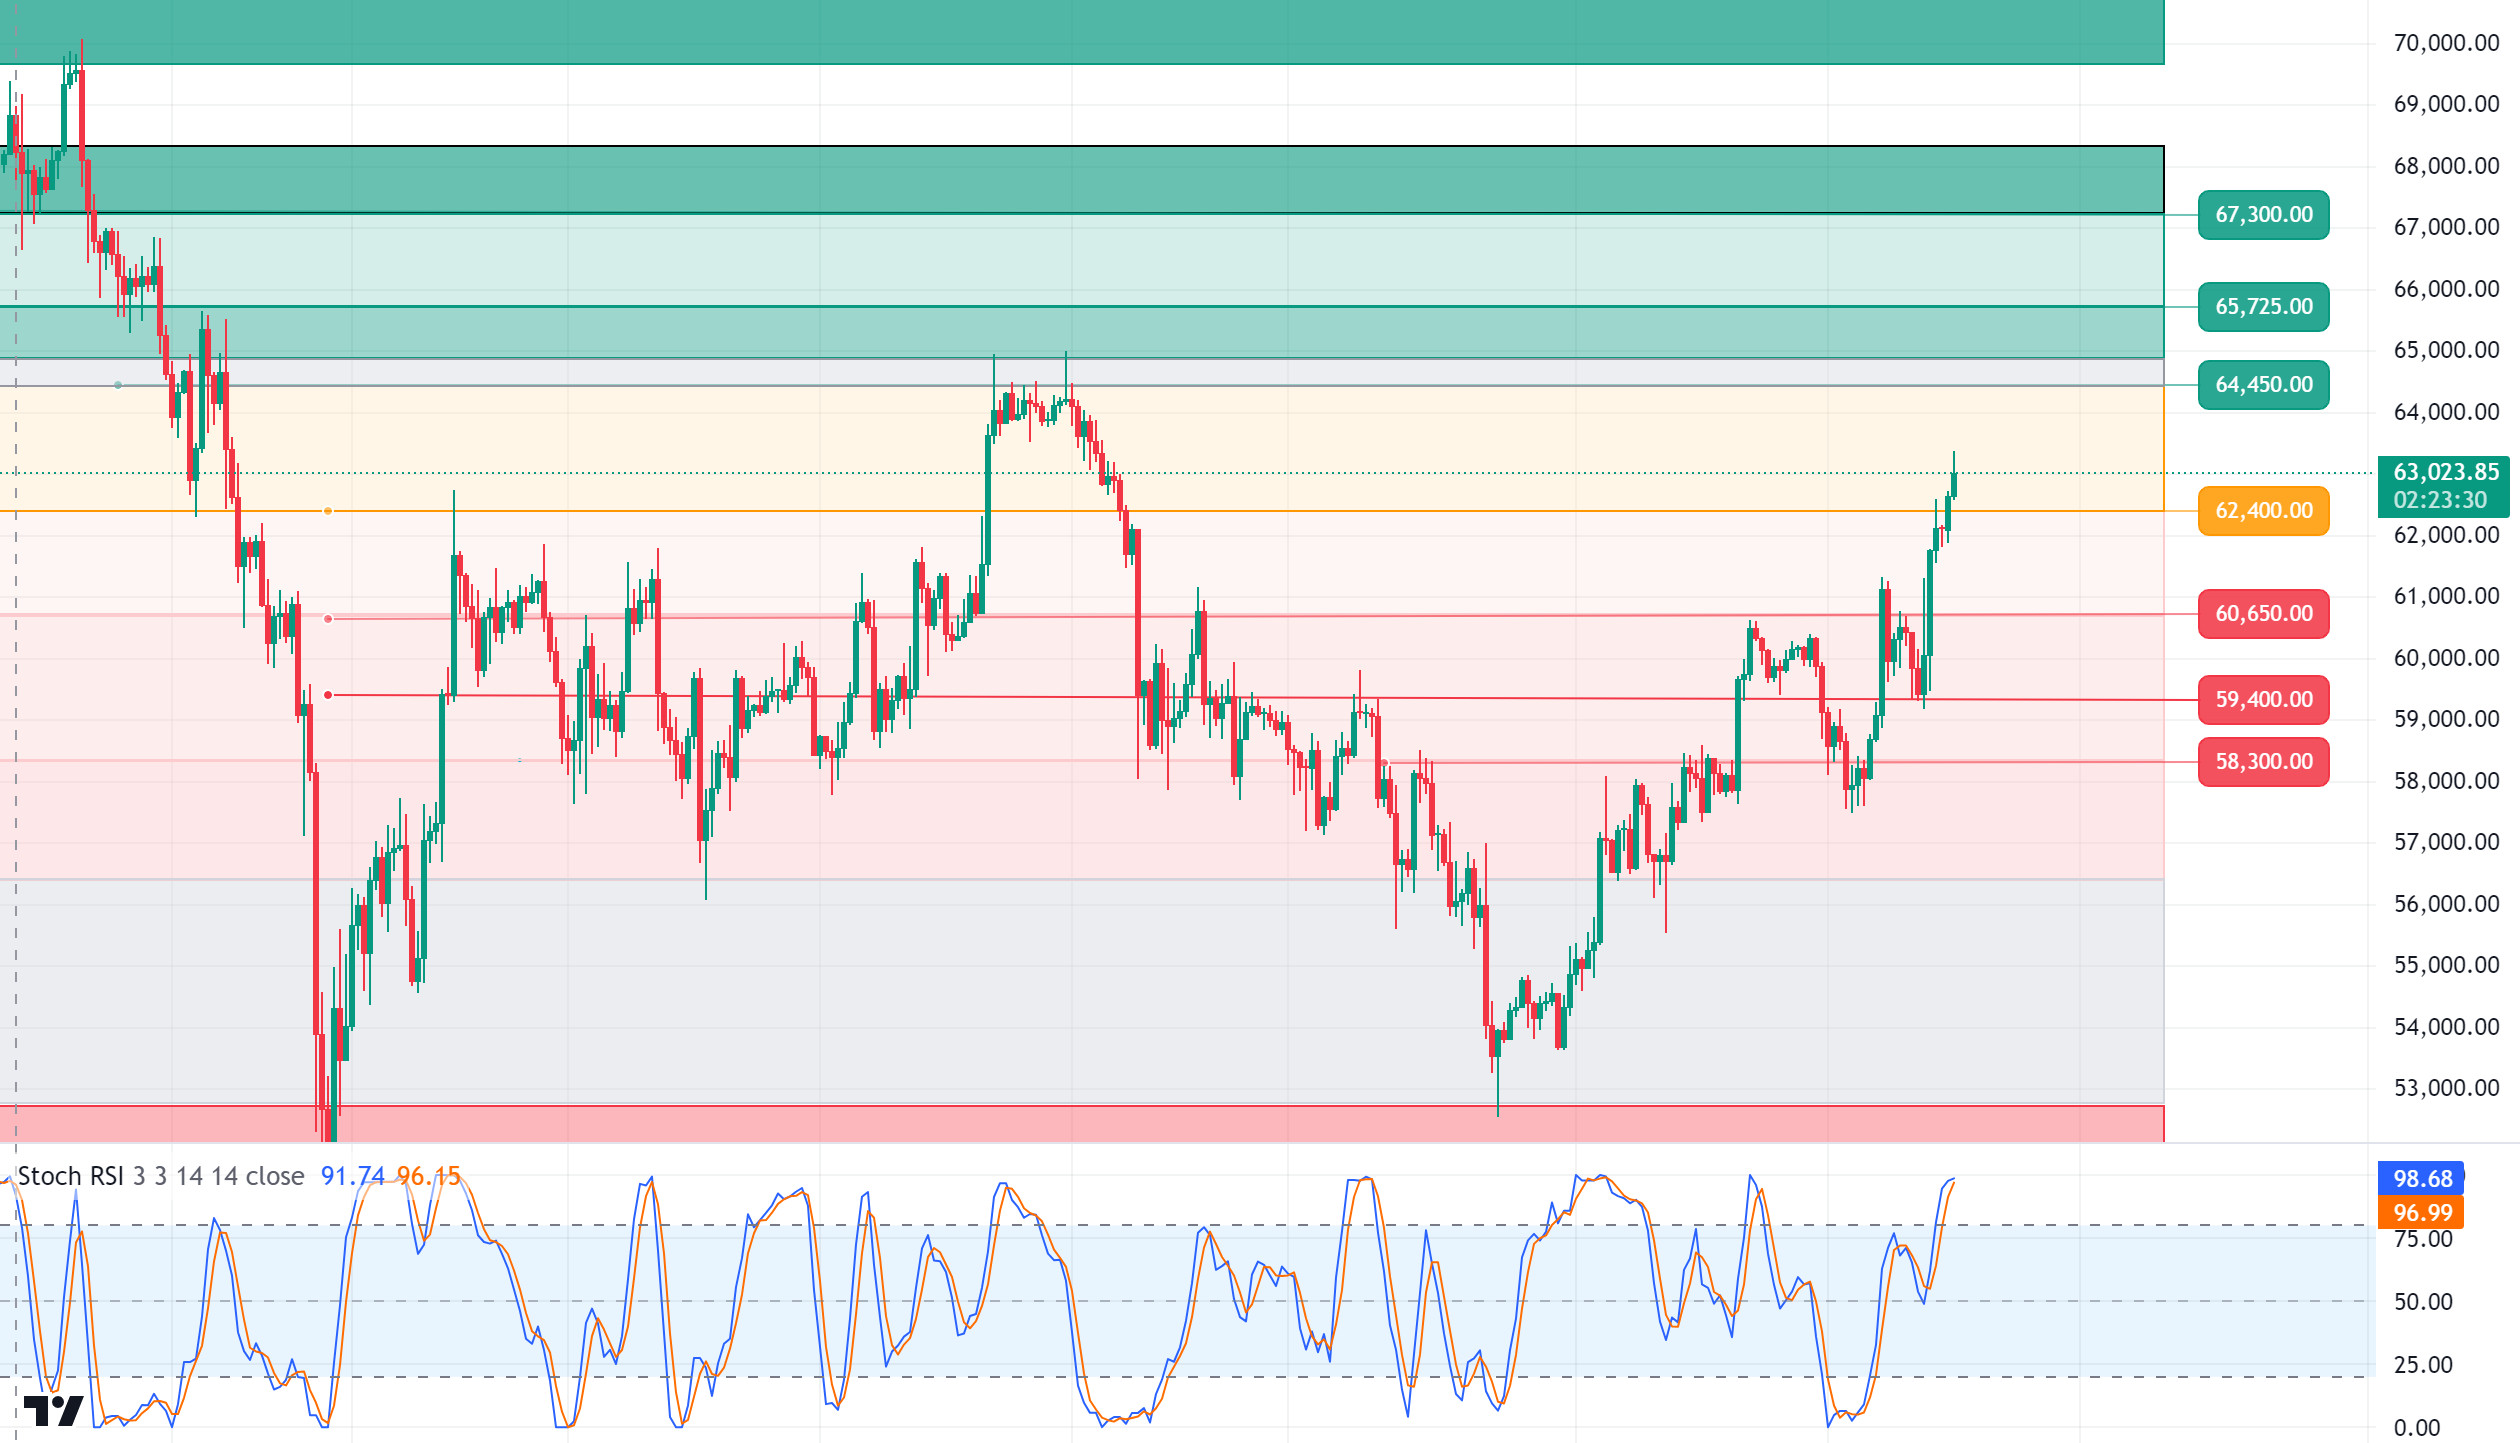
BTC/USDT
Will the Upward Trend Continue? Bitcoin, which gained upward momentum after the FED’s interest rate cut decision, attracts attention with a 5% increase in value in September. With its current outlook, Bitcoin seems likely to close September positively. Looking at historical data, the positive closes of September usually brought a strong uptrend in the last quarter of the year. With interest rate cuts leading to an increase in liquidity, demand for risky assets is expected to continue to increase. In the BTC 4-hour technical analysis, Bitcoin, which drew a strong image by maintaining its gains during the day, turned its direction to the next resistance level of 64,450 with the resistance level of 62,400. Bitcoin, which is in a strong correlation with the US market, positive pricing there is important for the continuation of the rise and may be reflected in its price. Otherwise, BTC, which takes the wind behind it with the optimistic atmosphere in the market, may need a possible correction. In this direction, the 62,400 level, which appears as a resistance level, will be our new support level.
Supports are: 60,650 – 59,400 – 58,300
Resistances 64,450 – 65,725 – 67,300
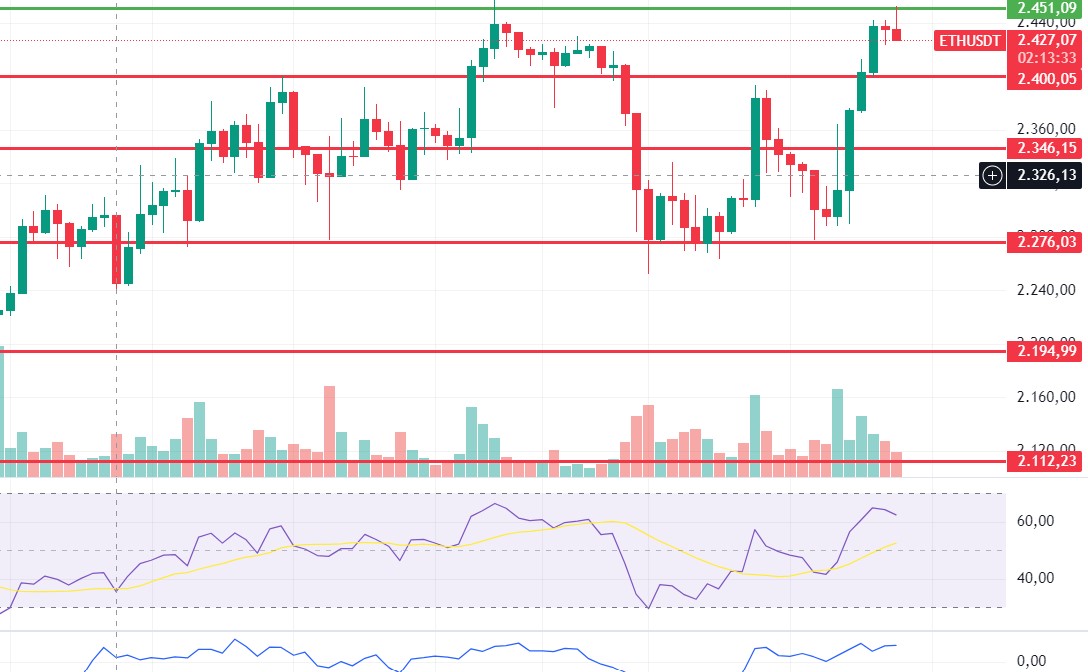
ETH/USDT
Ethereum, which continued to rise during the day, experienced a slight retreat from the 2,451 resistance. Although the structure still looks positive, the continuation of the decline in ETH/BTC shows that the rises in Ethereum may be more limited compared to Bitcoin. Apart from this, it is important to exceed the 2,451 resistance for the continuation of positive structures in OBV, CMF, RSI and momentum. With the level exceeded, we can see very fast rises to 2,490 and then 2,558 levels. In the bad scenario, with the break of the 2,400 level, a re-test to the 2,346 level can be expected.
Supports 2,400 – 2,346 – 2,276
Resistances 2,451 – 2,490 – 2,558
LINK/USDT
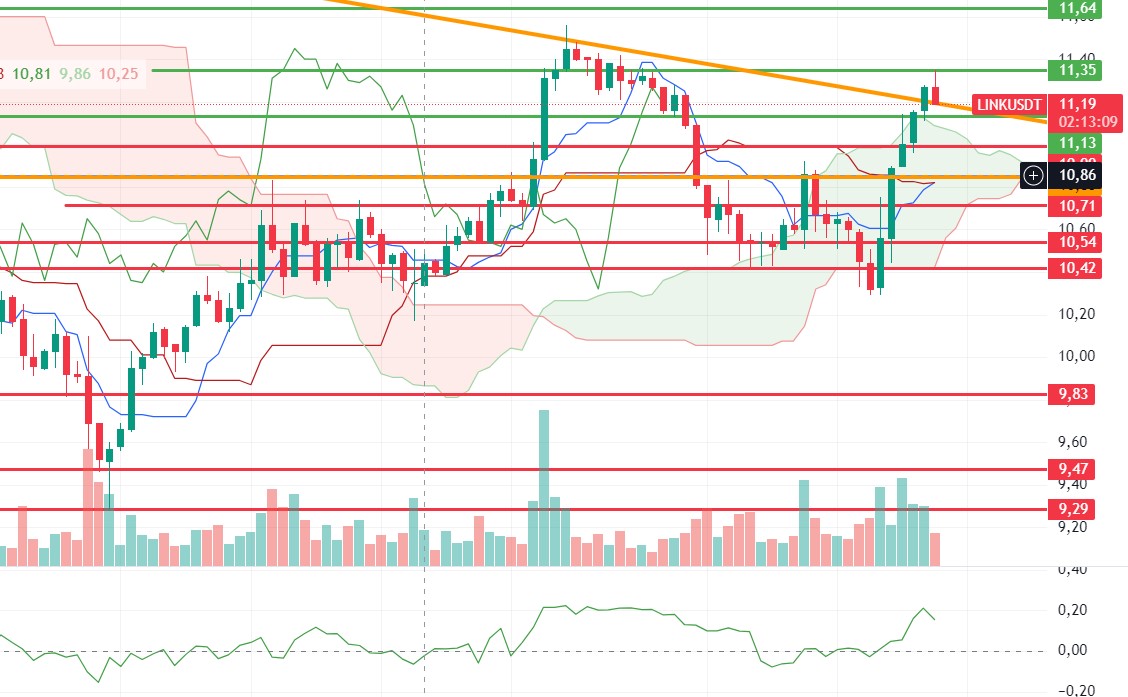
For LINK, which continues to rise by exceeding the Kumo cloud resistance 11.13 level, it seems positive that there is no discordance in the indicators. In addition, the fact that the trend breakout has come seems to be another positive effect. Although it retreated a little with the positive opening of the US markets, it seems likely to exceed the 11.35 level during the day. Loss of 11.13 level may bring declines up to 10.85 levels.
Supports 11.13 – 10.85 – 10.54
Resistances 11.35 – 11.64 – 12.19
 SOL/USDT
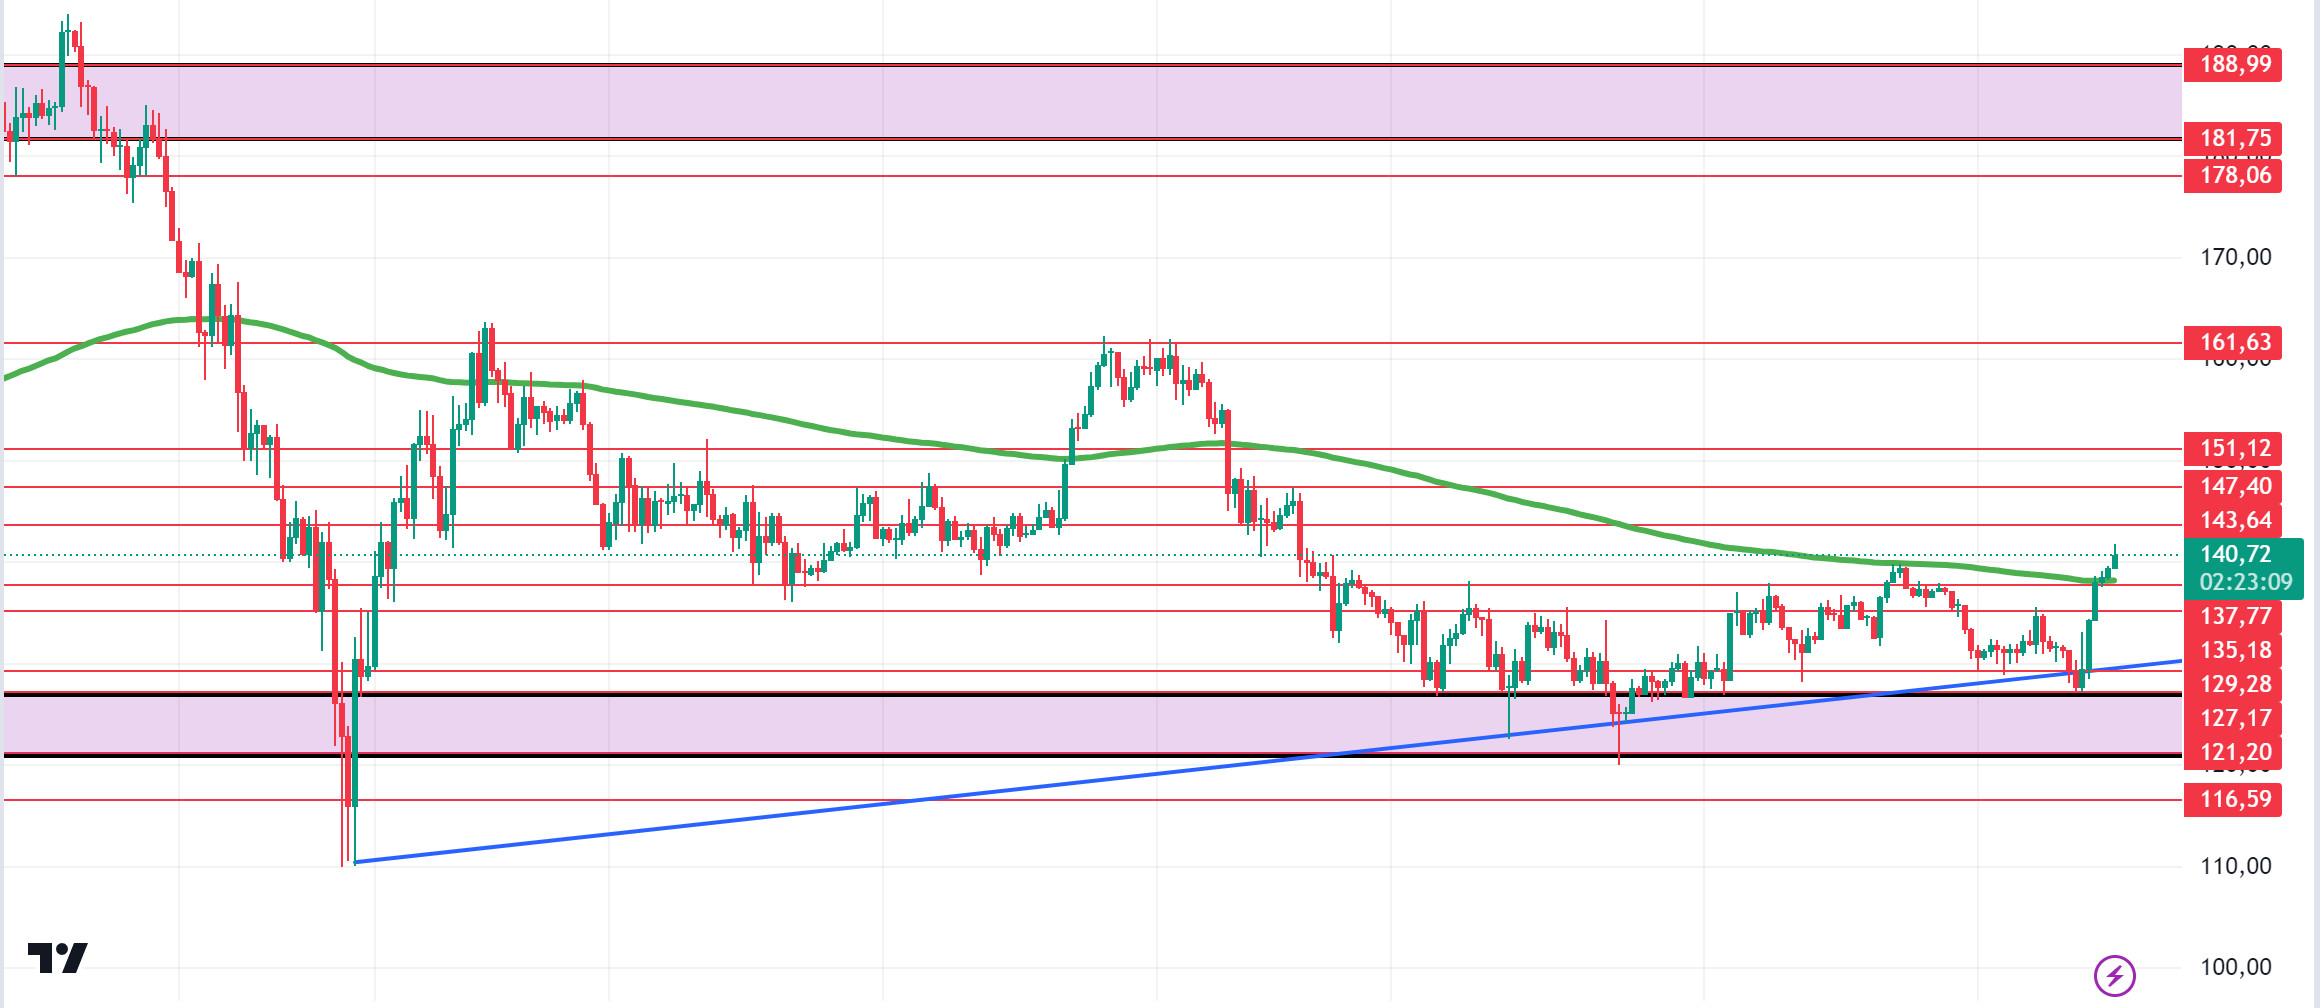
cations for Unemployment Benefits were announced. Unemployment Claims showed a significant decline according to the latest economic data. The data expected as 230k was realised as 219k. This indicator, which is positive for the dollar, is an indication that the economy is entering the recovery process. However, the interest rate decision from the Bank of Japan is also very important. The expectation is that it will be kept constant at 0.25%. Technically, Solana was trading in a narrowing triangle pattern for a long time. It is currently priced above the 200 EMA on the 4-hour chart, breaking the triangle pattern. It is highly likely that the possibility of a US interest rate cut will continue. This shows that we may enter a new uptrend. Since 5 August, will Sol, which has been consolidating since August 5, be able to break the strong resistance level of 188.99 with this news and get out of the consolidated area? In the rises caused by both macroeconomic conditions and innovations in the Solana ecosystem, 143.64 – 147.40 levels appear as resistance. If it rises above these levels, the rise may continue. In case of profit sales by investors, 137.77 – 135.18 can be followed as support levels. If it comes to these support levels, a potential rise should be followed.
Supports 137.77 – 135.18 – 129.28
Resistances 143.64 – 147.40 – 151.12
 ADA/USDT
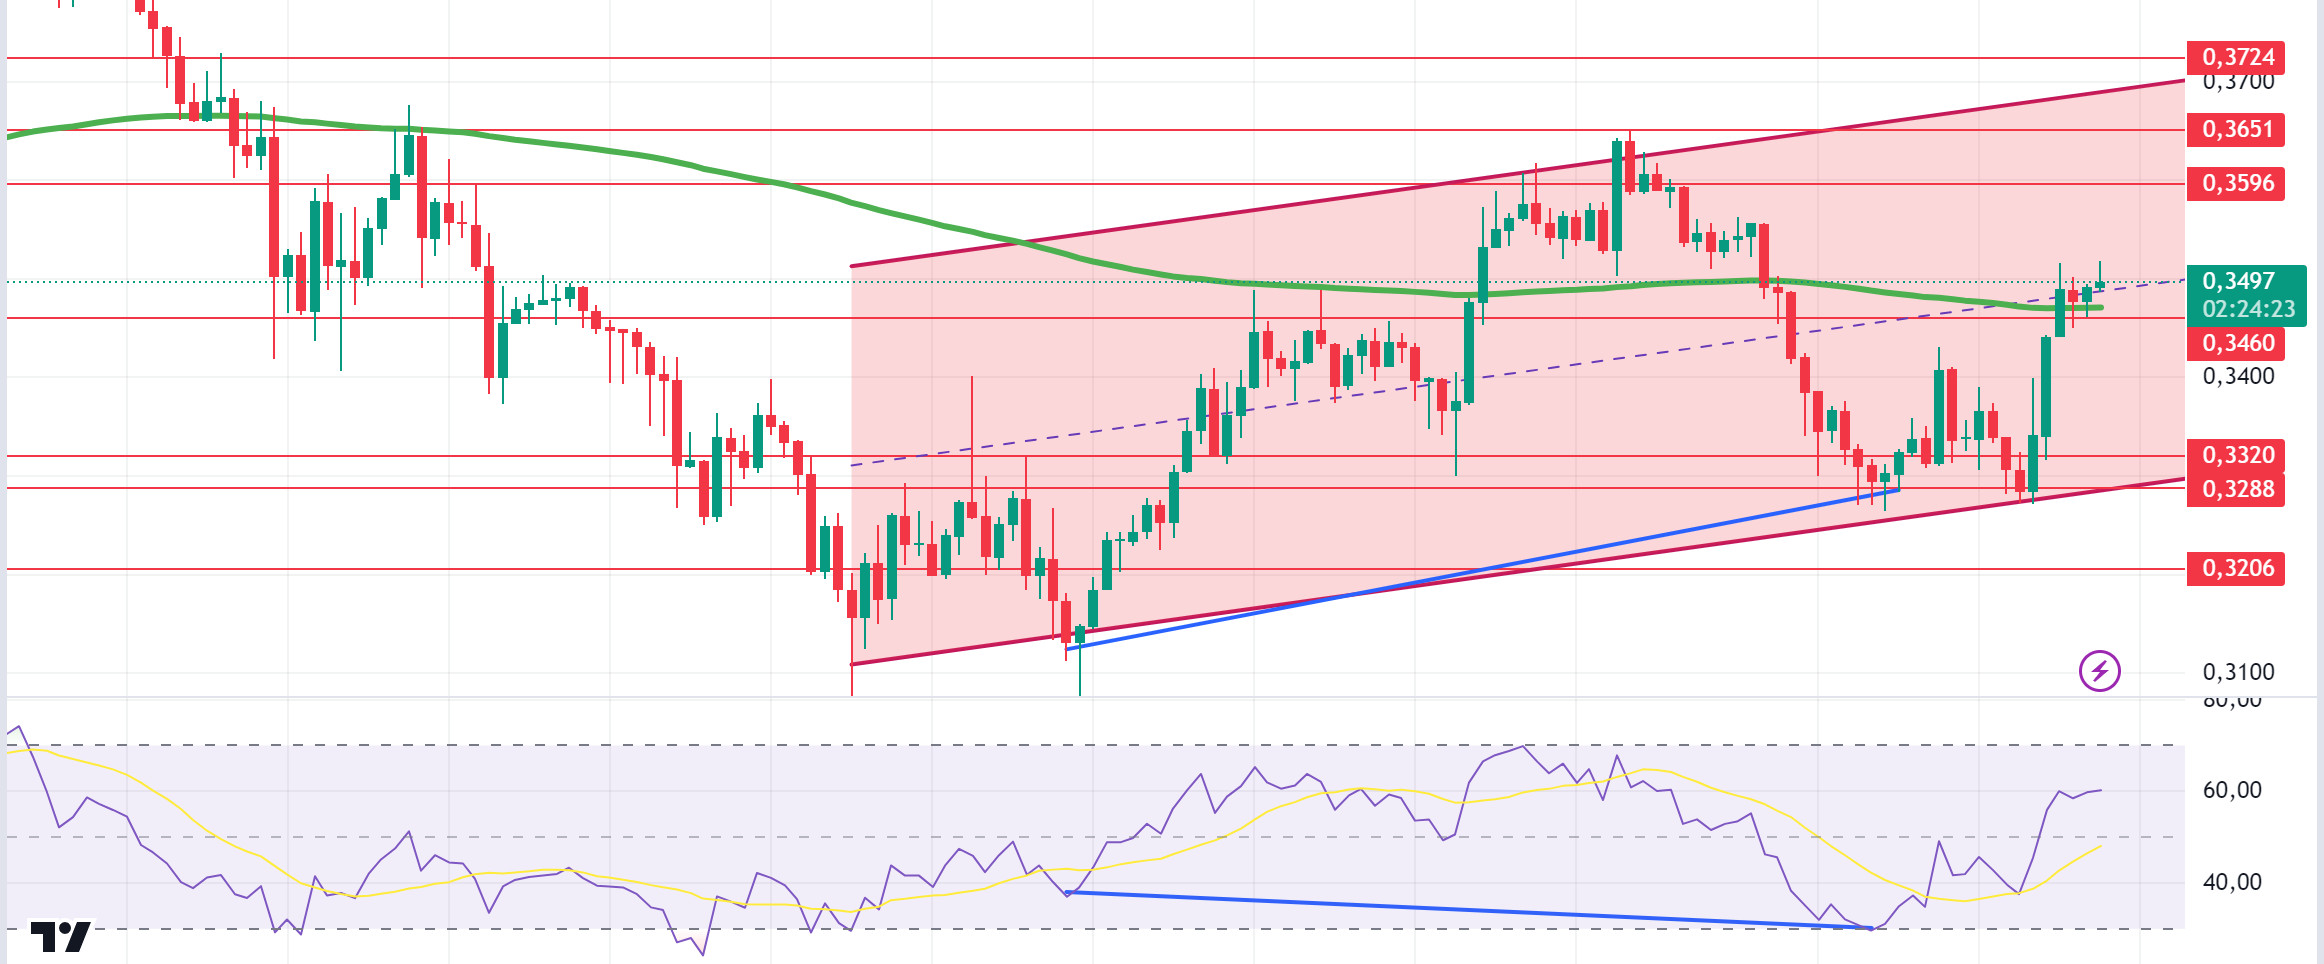
US Applications for Unemployment Benefits were announced. Unemployment Claims showed a significant decline according to the latest economic data. The data expected as 230k was realised as 219k. This indicator, which is positive for the dollar, is an indication that the economy is entering the recovery process. However, the interest rate decision from the Bank of Japan is also very important. The expectation is that it will be kept constant at 0.25%. Technically, the RSI indicator seems to have worked together with the macroeconomic data coming with the mismatch on the 4-hour chart. ADA, which has been priced with slight increases since our technical analysis in the morning, is priced at the level of the EMA200 moving average on the 4-hour chart. This may be a situation that indicates that the rise will continue with the momentum it receives. In possible retracements, 0.3460 – 0.3320 levels appear as support. In the rises that will take place with macroeconomic data raising BTC or good news in the ecosystem, 0.3596 – 0.3651 levels can be followed as resistance levels.
Supports 0.3460 – 0.3320 – 0.3288
Resistances 0.3596 – 0.3651 – 0.3724
AVAX/USDT
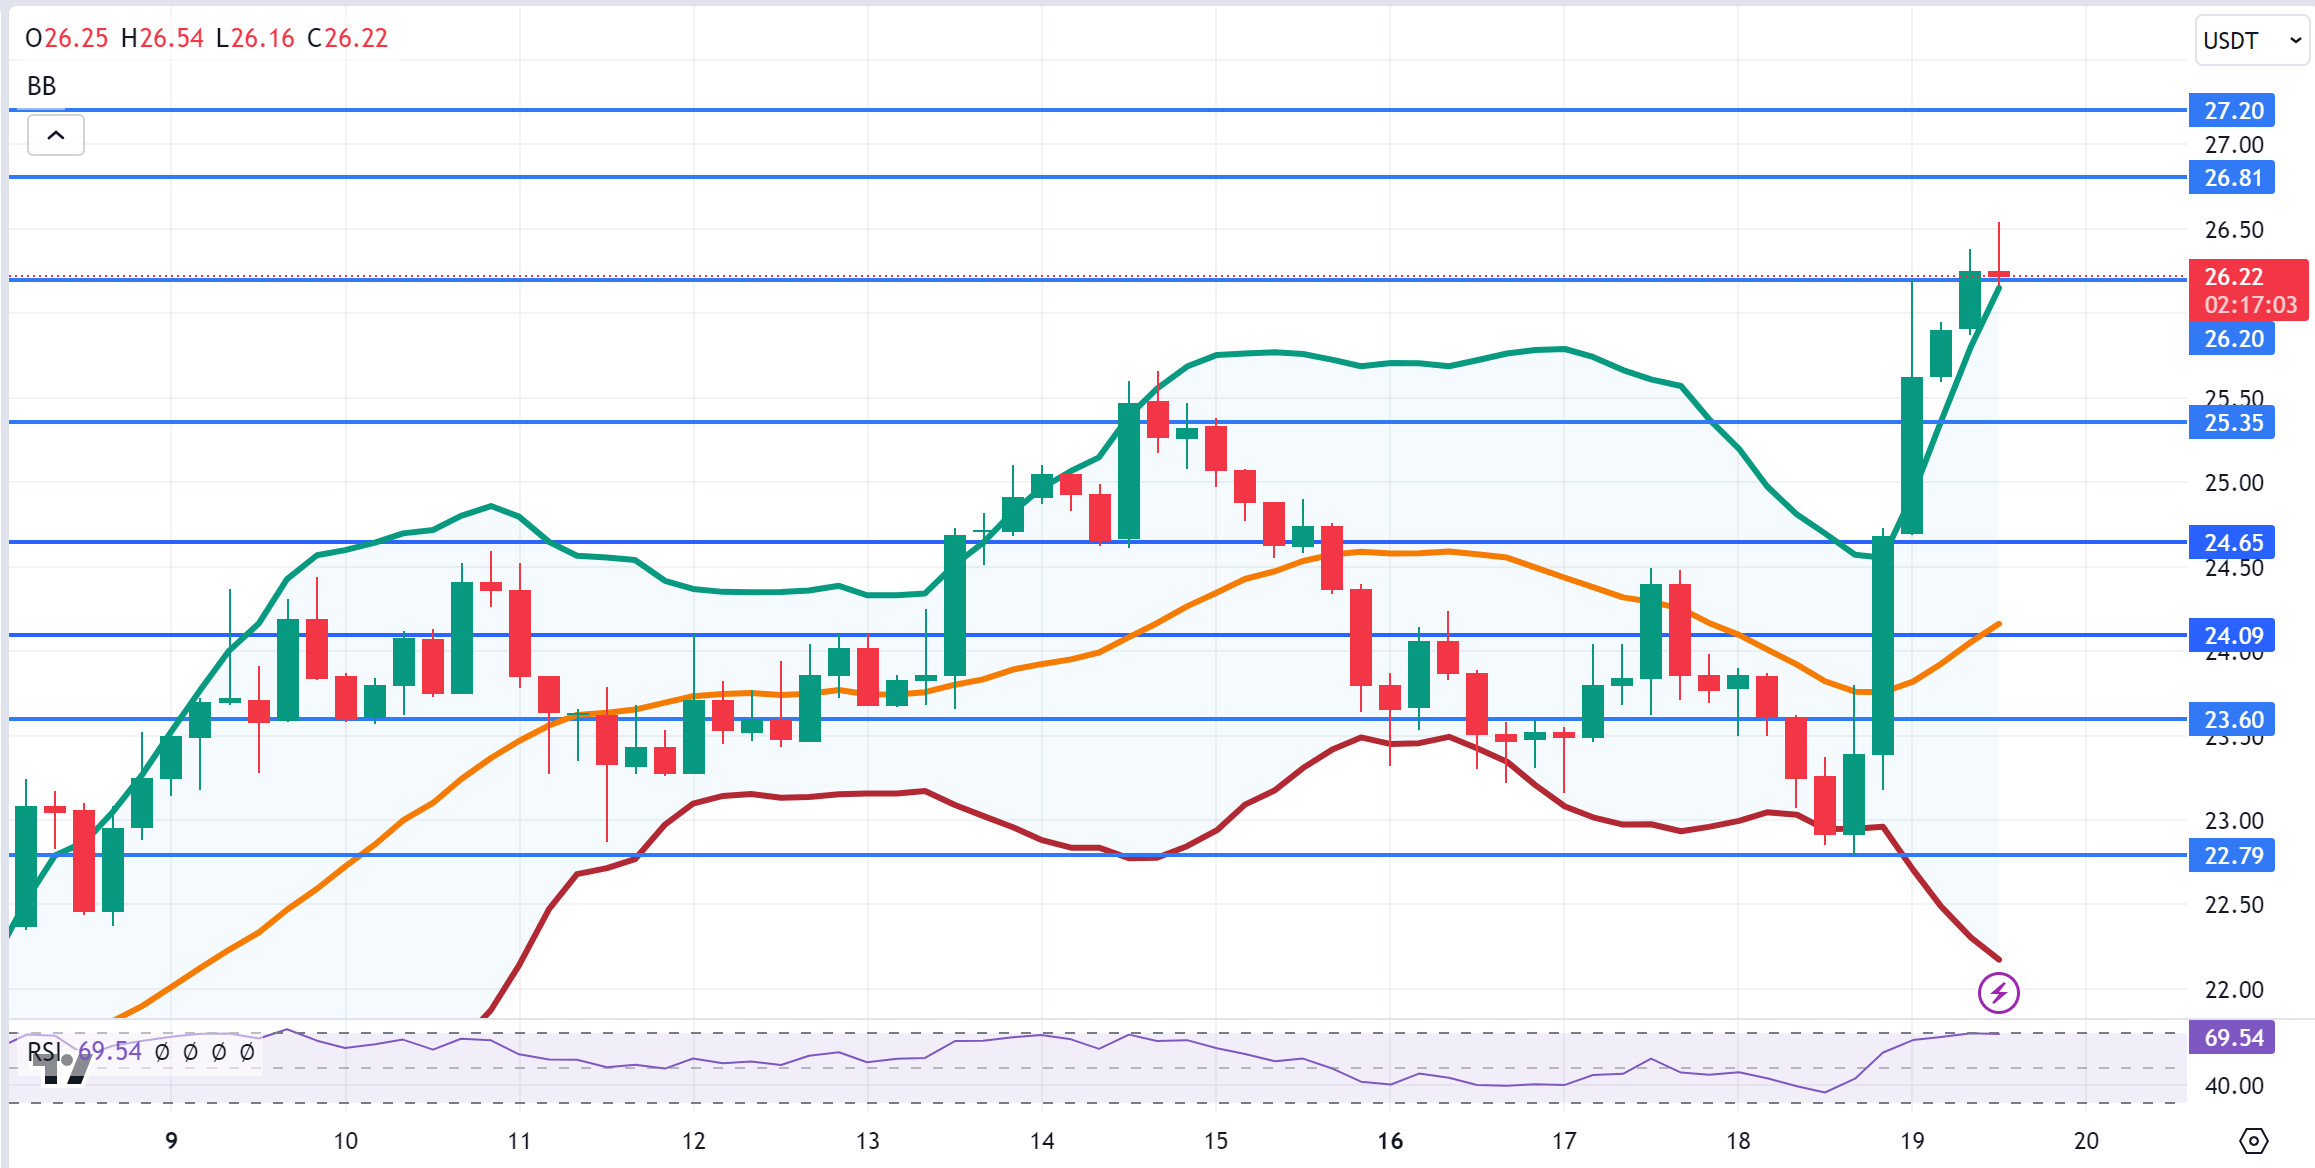
AVAX, which opened today at 24.70, continues to rise after the US unemployment benefit applications announced today and is trading at 26.22.
On the 4-hour chart, it has risen above the Bollinger upper band. AVAX, which is in the overbought zone with RSI 70, may face a sales reaction from these levels. With the candle closure below 26.20 support, it can move towards the Bollinger middle band and test the supports of 25.35 and 24.65. On the other hand, it may want to test the 27.20 resistance with the candle closing above the 26.81 resistance. As long as it stays above 22.79 support during the day, the desire to rise may continue. With the break of 22.79 support, selling pressure may increase.
Supports 26.20 – 25.35 – 24.65
Resistances 26.81 – 27.20 – 28.00
TRX/USDT
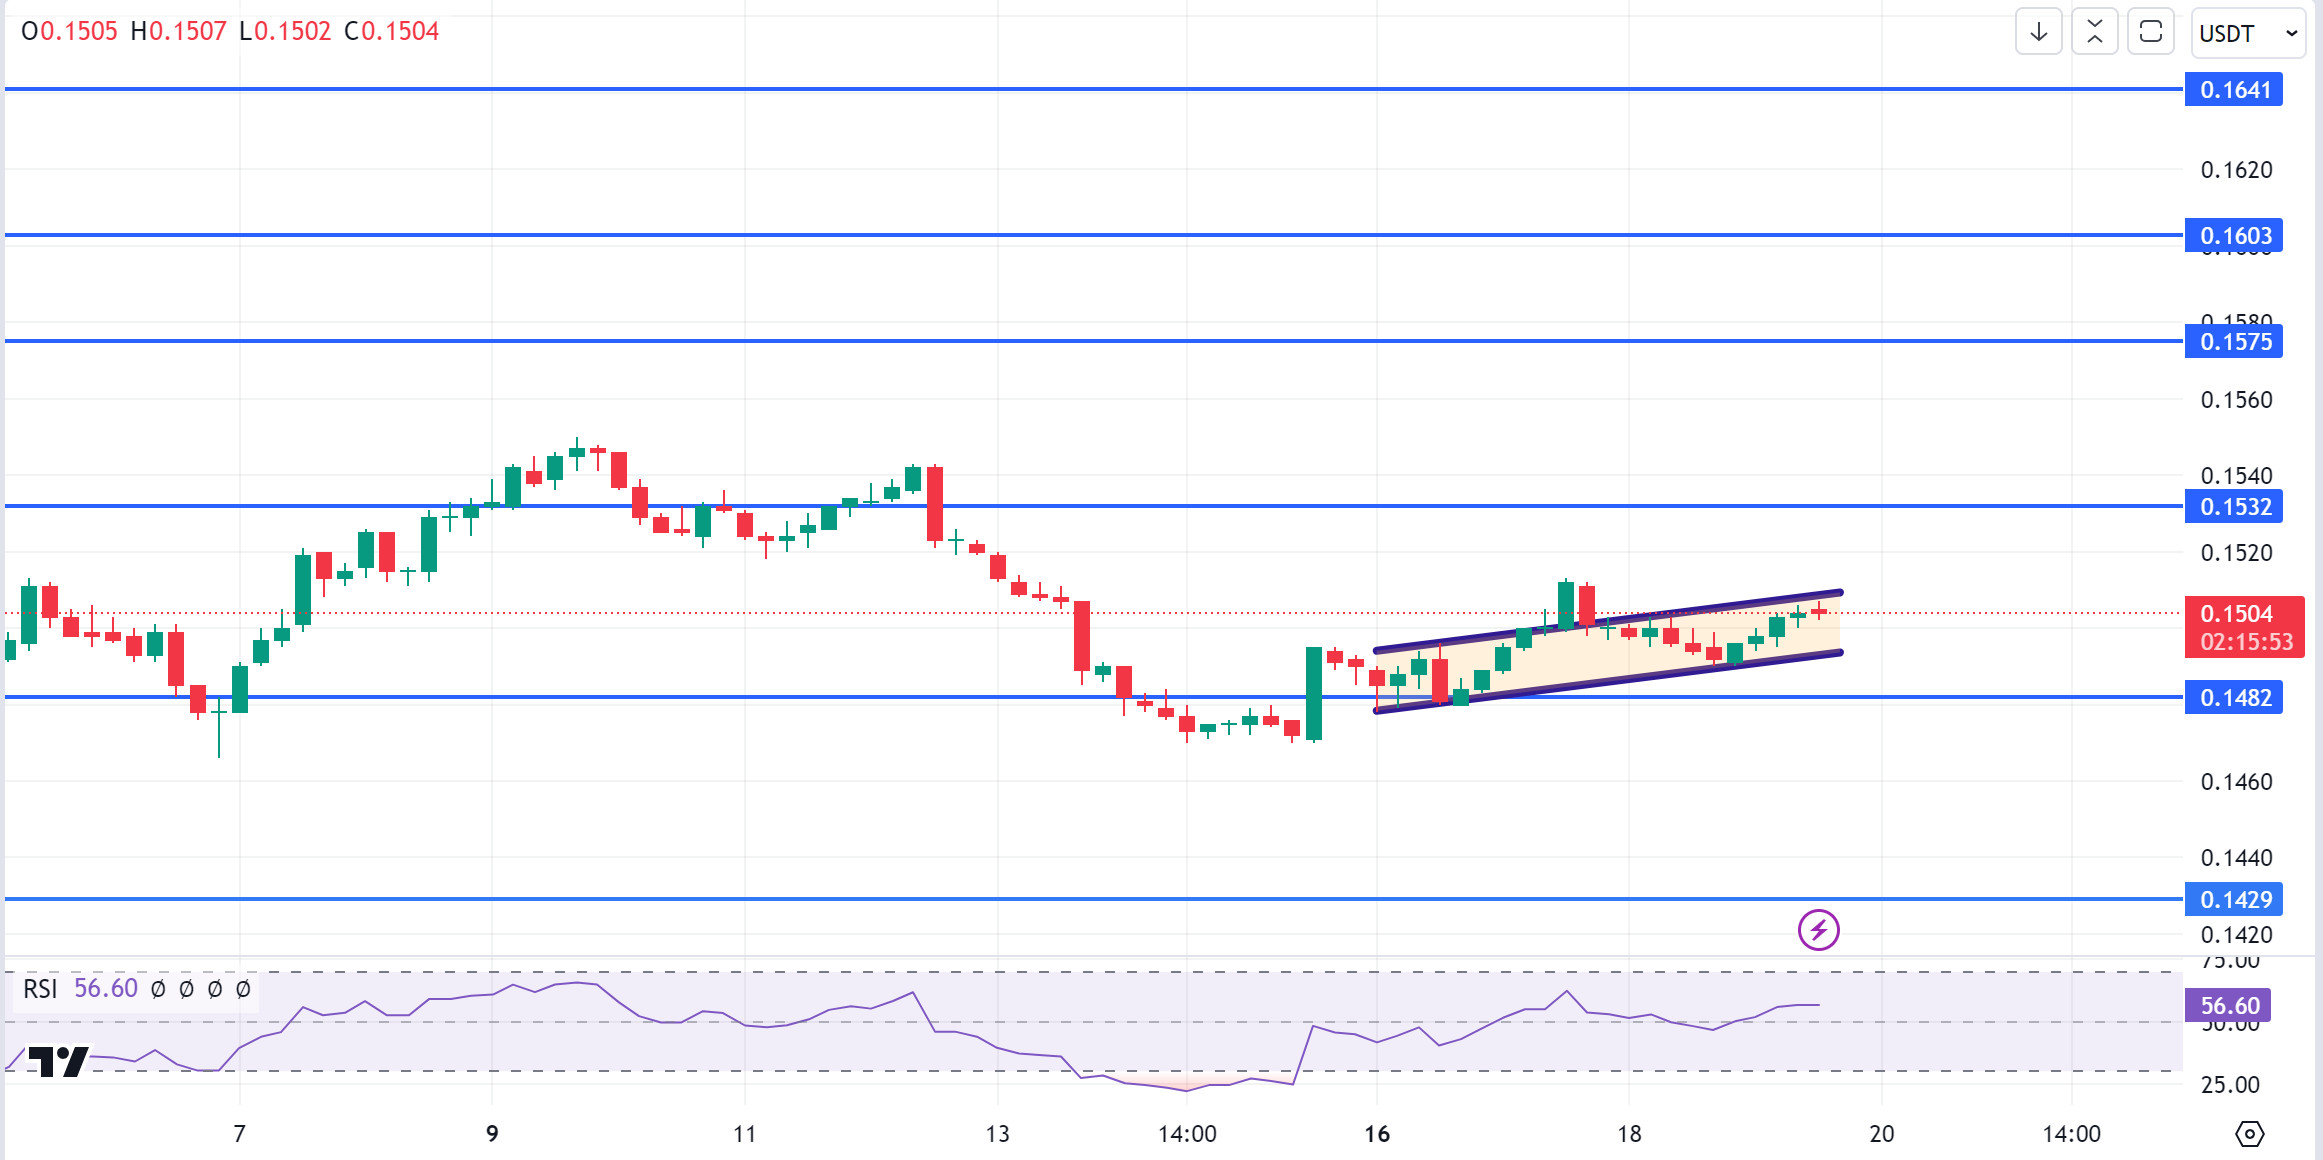
TRX, which started today at 0.1496, continues its horizontal course after the opening of the US stock markets and is traded at 0.1504. On the 4-hour chart, TRX, which is in the rising channel, is in the upper band of the channel and a sales reaction can be expected from here. In such a case, it may move to the lower band of the channel and test the support of 0.1482. If it breaks the channel upwards with voluminous purchases from the upper band of the channel, it may want to test the 0.1532 resistance. As long as TRX stays above 0.1482 support, the desire to rise may continue. If this support is broken downwards, sales can be expected to increase.
Supports 0.1482 – 0.1429 – 0.1399
Resistances 0.1532 – 0.1575 – 0.1603
XRP/USDT
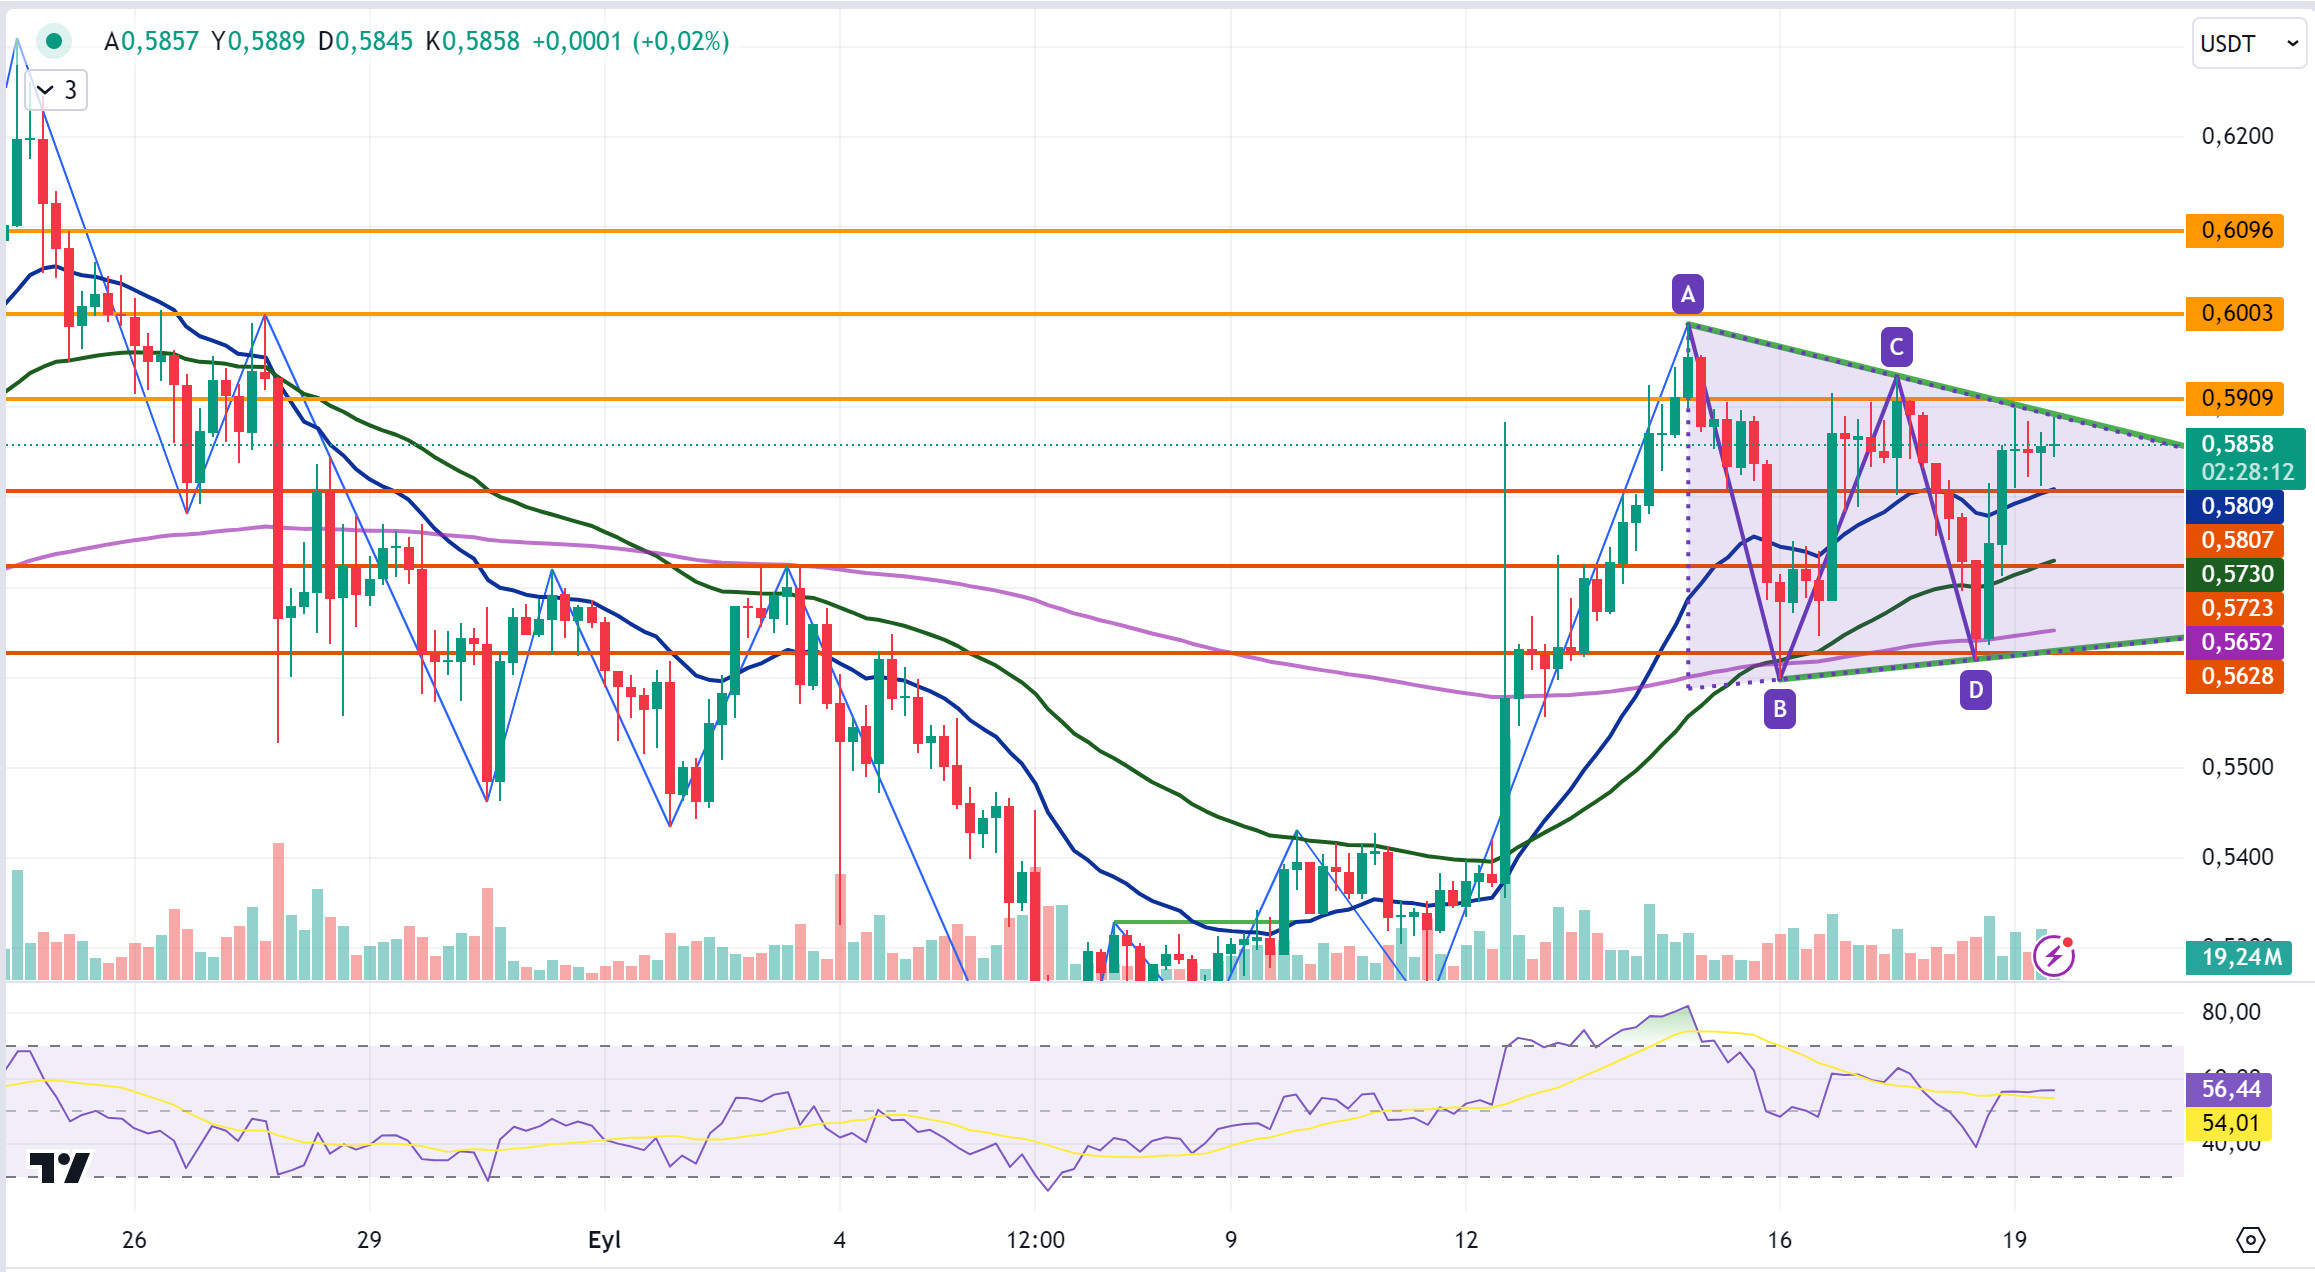
XRP continues to be traded in a horizontal band in the 4-hour analysis today. In the 4-hour analysis, XRP fell with the reaction sales after rising to the level of 0.59 in the triangle formation. XRP, which fell to 0.58 during the day with the decline, continues to be traded at 0.5858, the starting level of the day with the incoming purchases. If XRP breaks the triangle formation and 0.5909 resistance level with its rise, it can continue its rise and test the resistance levels of 0.6003-0.6096. In case of a decline, it may test the 0.5807 support level and the EMA20 level, and if these levels are broken, it may test the 0.5723-0.5628 support levels with the deepening of the decline.
In the XRP decline, it may rise with the purchases that may come at the 0.5807 and EMA20 level and may give a long trading opportunity. If these levels are broken downwards, the decline may deepen and offer a short trading opportunity.
EMA20 (Blue Line) – EMA50 (Green Line) – EMA200 (Purple Line)
Supports 0.5807 – 0.5723 – 0.5628
Resistances 0.5909 – 0.6003 – 0.6096
DOGE/USDT
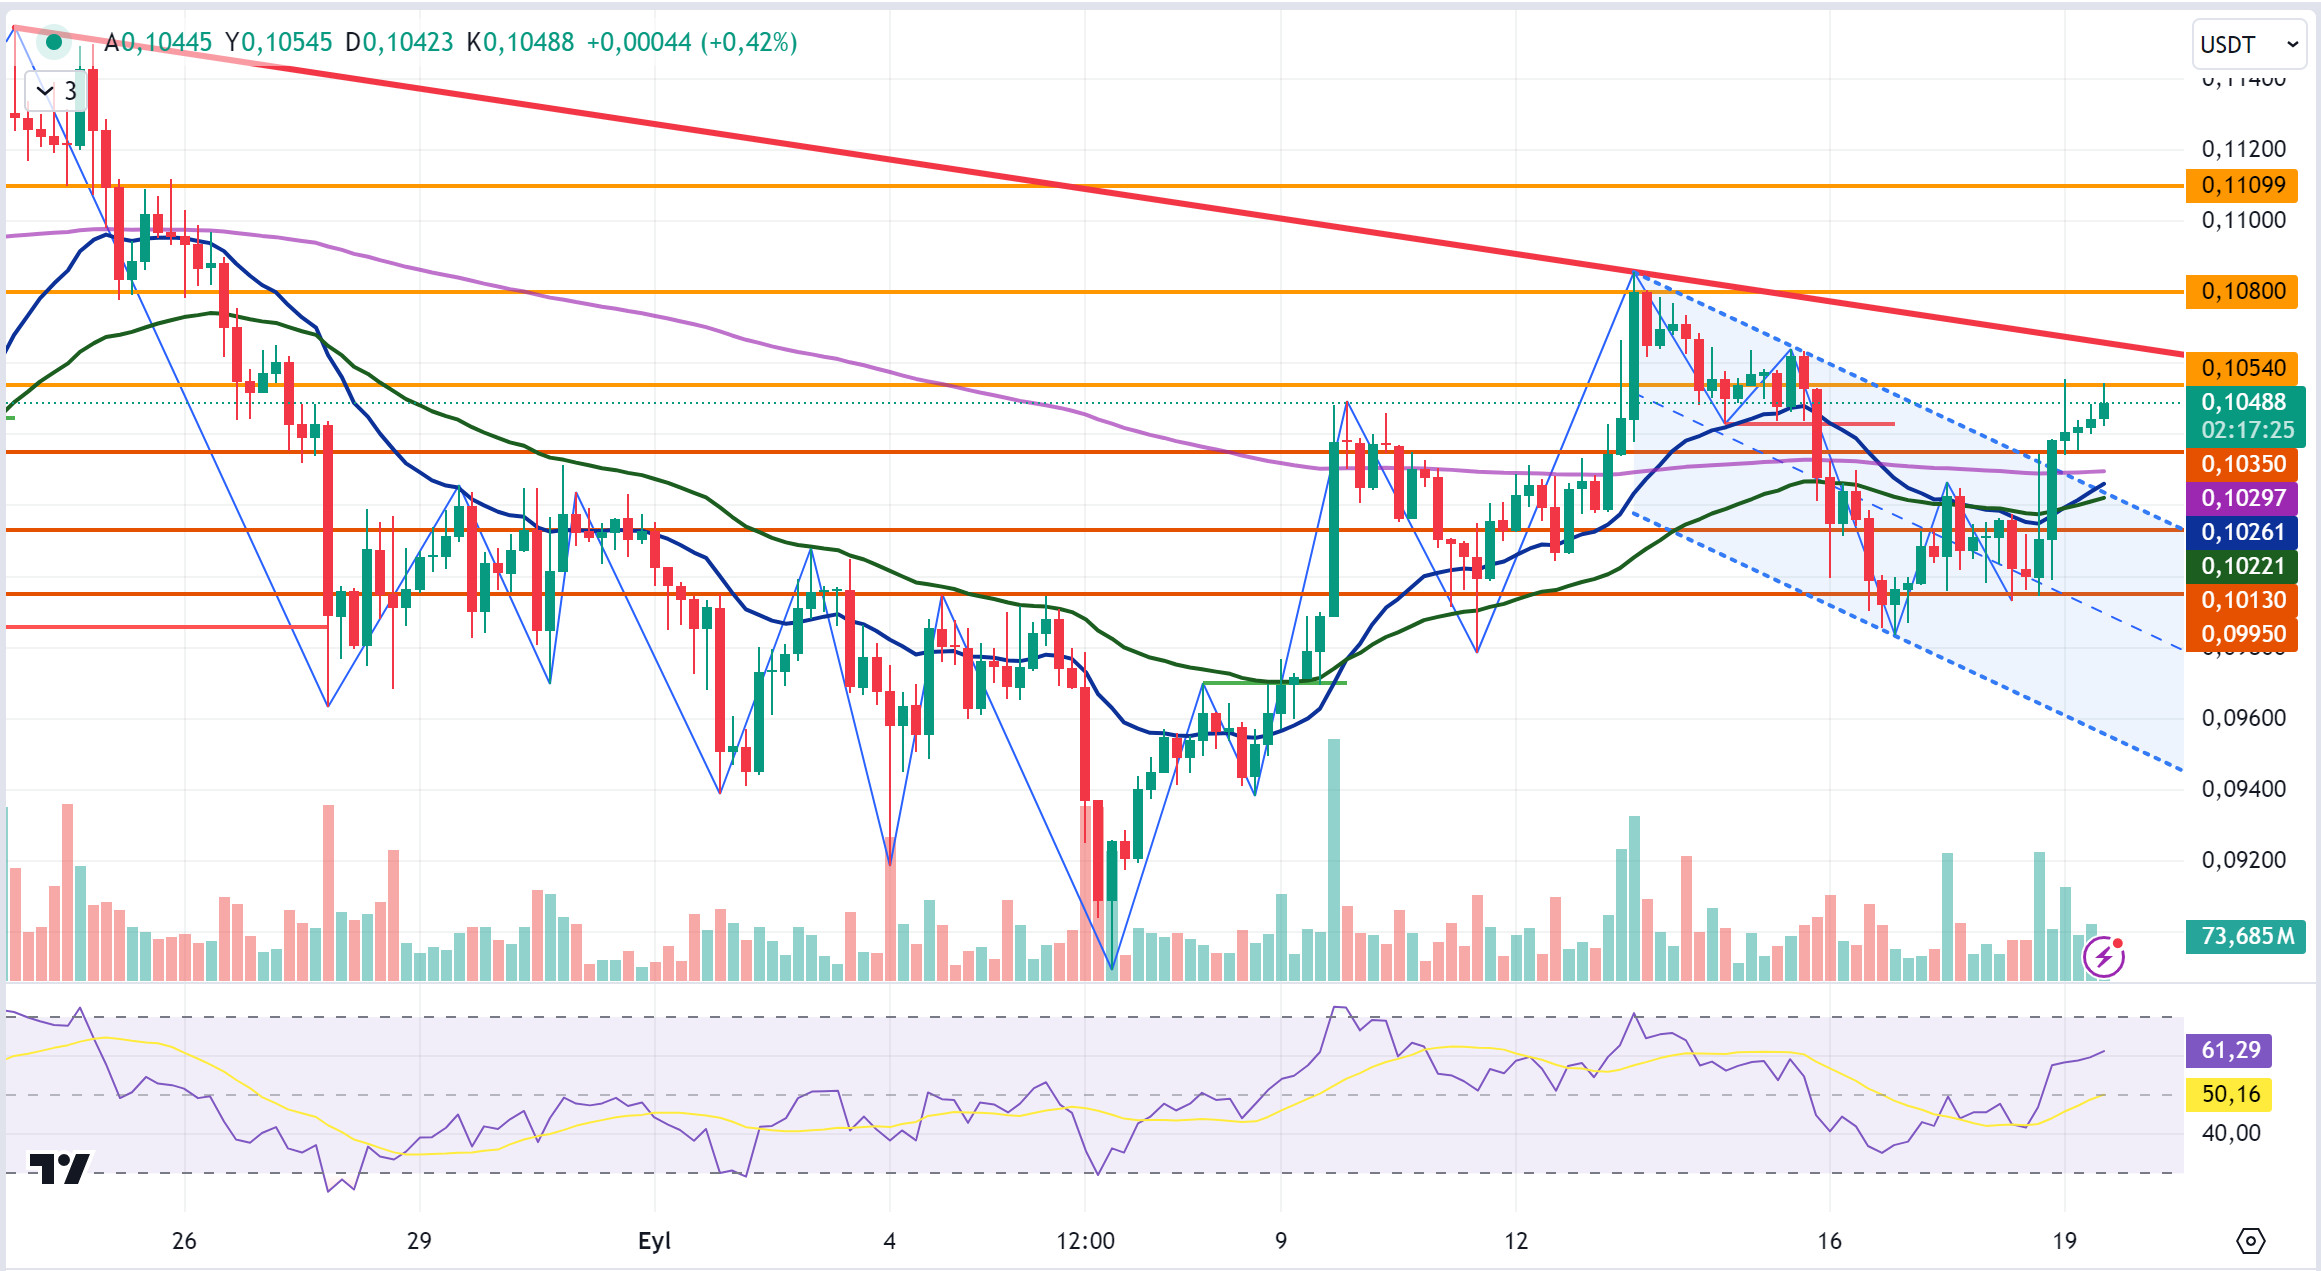
DOGE, which started today at 0.1038, continues to be traded at 0.1048 with a 0.7% increase in value. DOGE, which rose after the FED interest rate decision yesterday, continued to rise today and fell after testing the 0.1054 resistance level in its rise. DOGE continues to trade in a horizontal band between the 0.1035 support level and the 0.1054 resistance level. DOGE can retest the 0.1054 resistance level with the rise and if it breaks it, it can continue its rise and test the 0.1080-0.1109 resistance levels. In case of a decline, it may retest the 0.1035 support level, which it has tested 2 times today, and if it continues to decline by breaking it, it may test the 0.1013-0.0995 support levels.
If DOGE declines, the 0.1035 and EMA200 level comes to the fore and may rise with purchases that may come from these levels and may offer a long trading opportunity. If these levels are broken downwards, the decline may deepen and offer a short trading opportunity.
EMA20 (Blue Line) – EMA50 (Green Line) – EMA200 (Purple Line)
Supports 0.1035 – 0.1013 – 0.0995
Resistances 0.1054 – 0.1080 – 0.1109
DOT/USDT
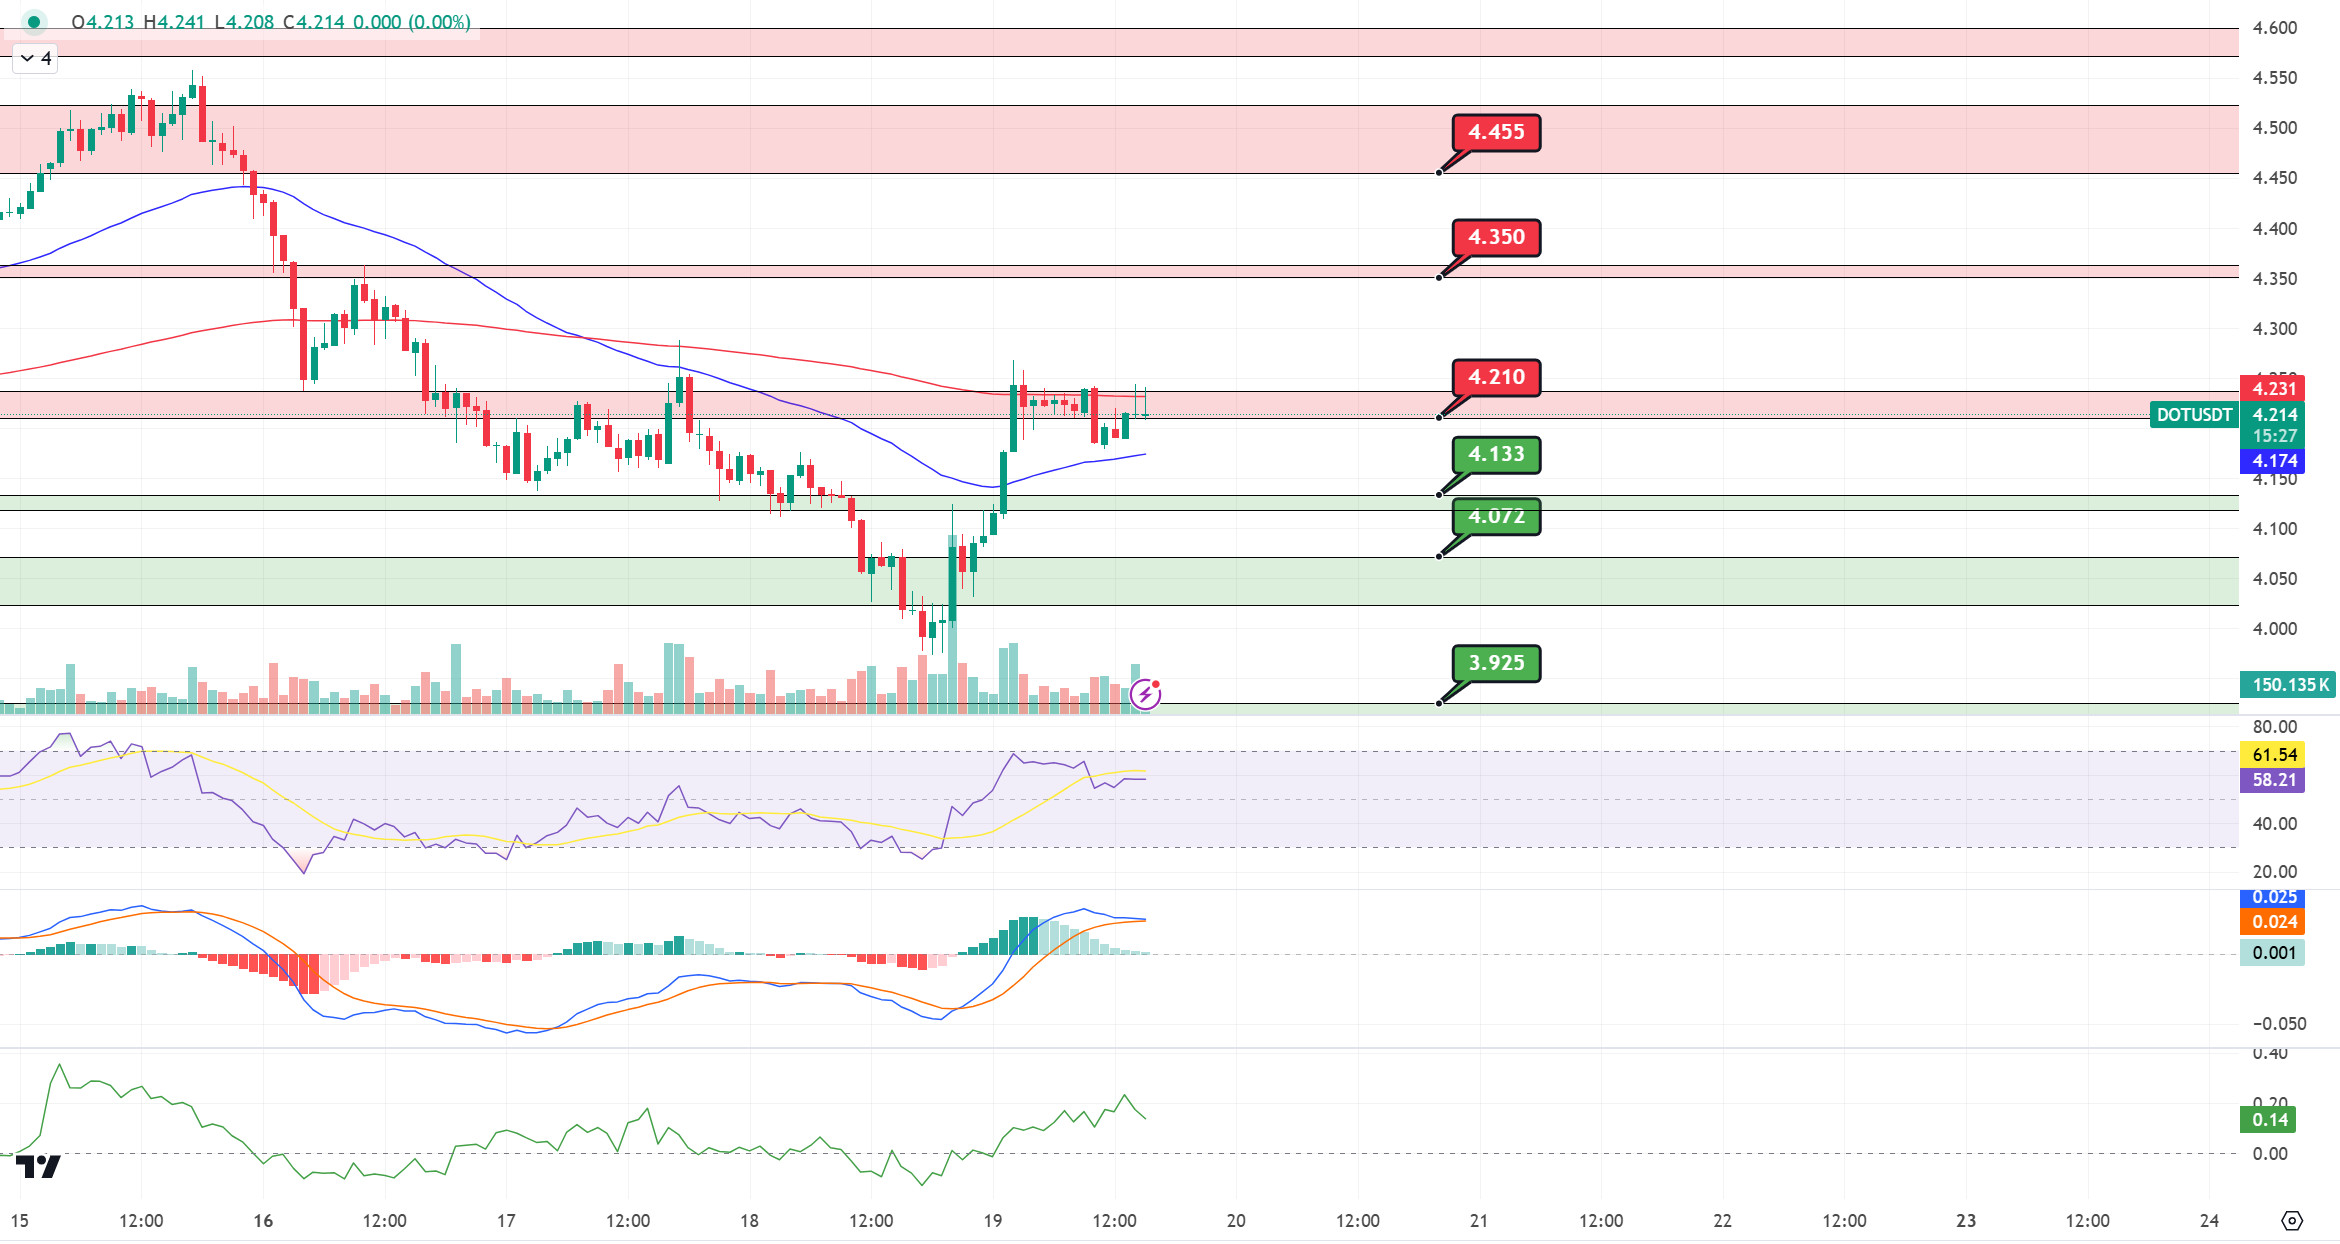
When we examine the Polkadot (DOT) chart, the price seems unable to break the 4.210 resistance band. The price returning from the EMA200 is trying to break the 4,210 resistance band. In a positive scenario, if the price maintains above the EMA200, it may rise to the next resistance level of 4,350. On the other hand, if the price rejects from the 4,210 level, we can expect it to retreat to the first support level of 4,133 support band.
(Blue line: EMA50, Red line: EMA200)
Supports 4,133 – 4,072 – 3,925
Resistances 4.210 – 4.350 – 4.455
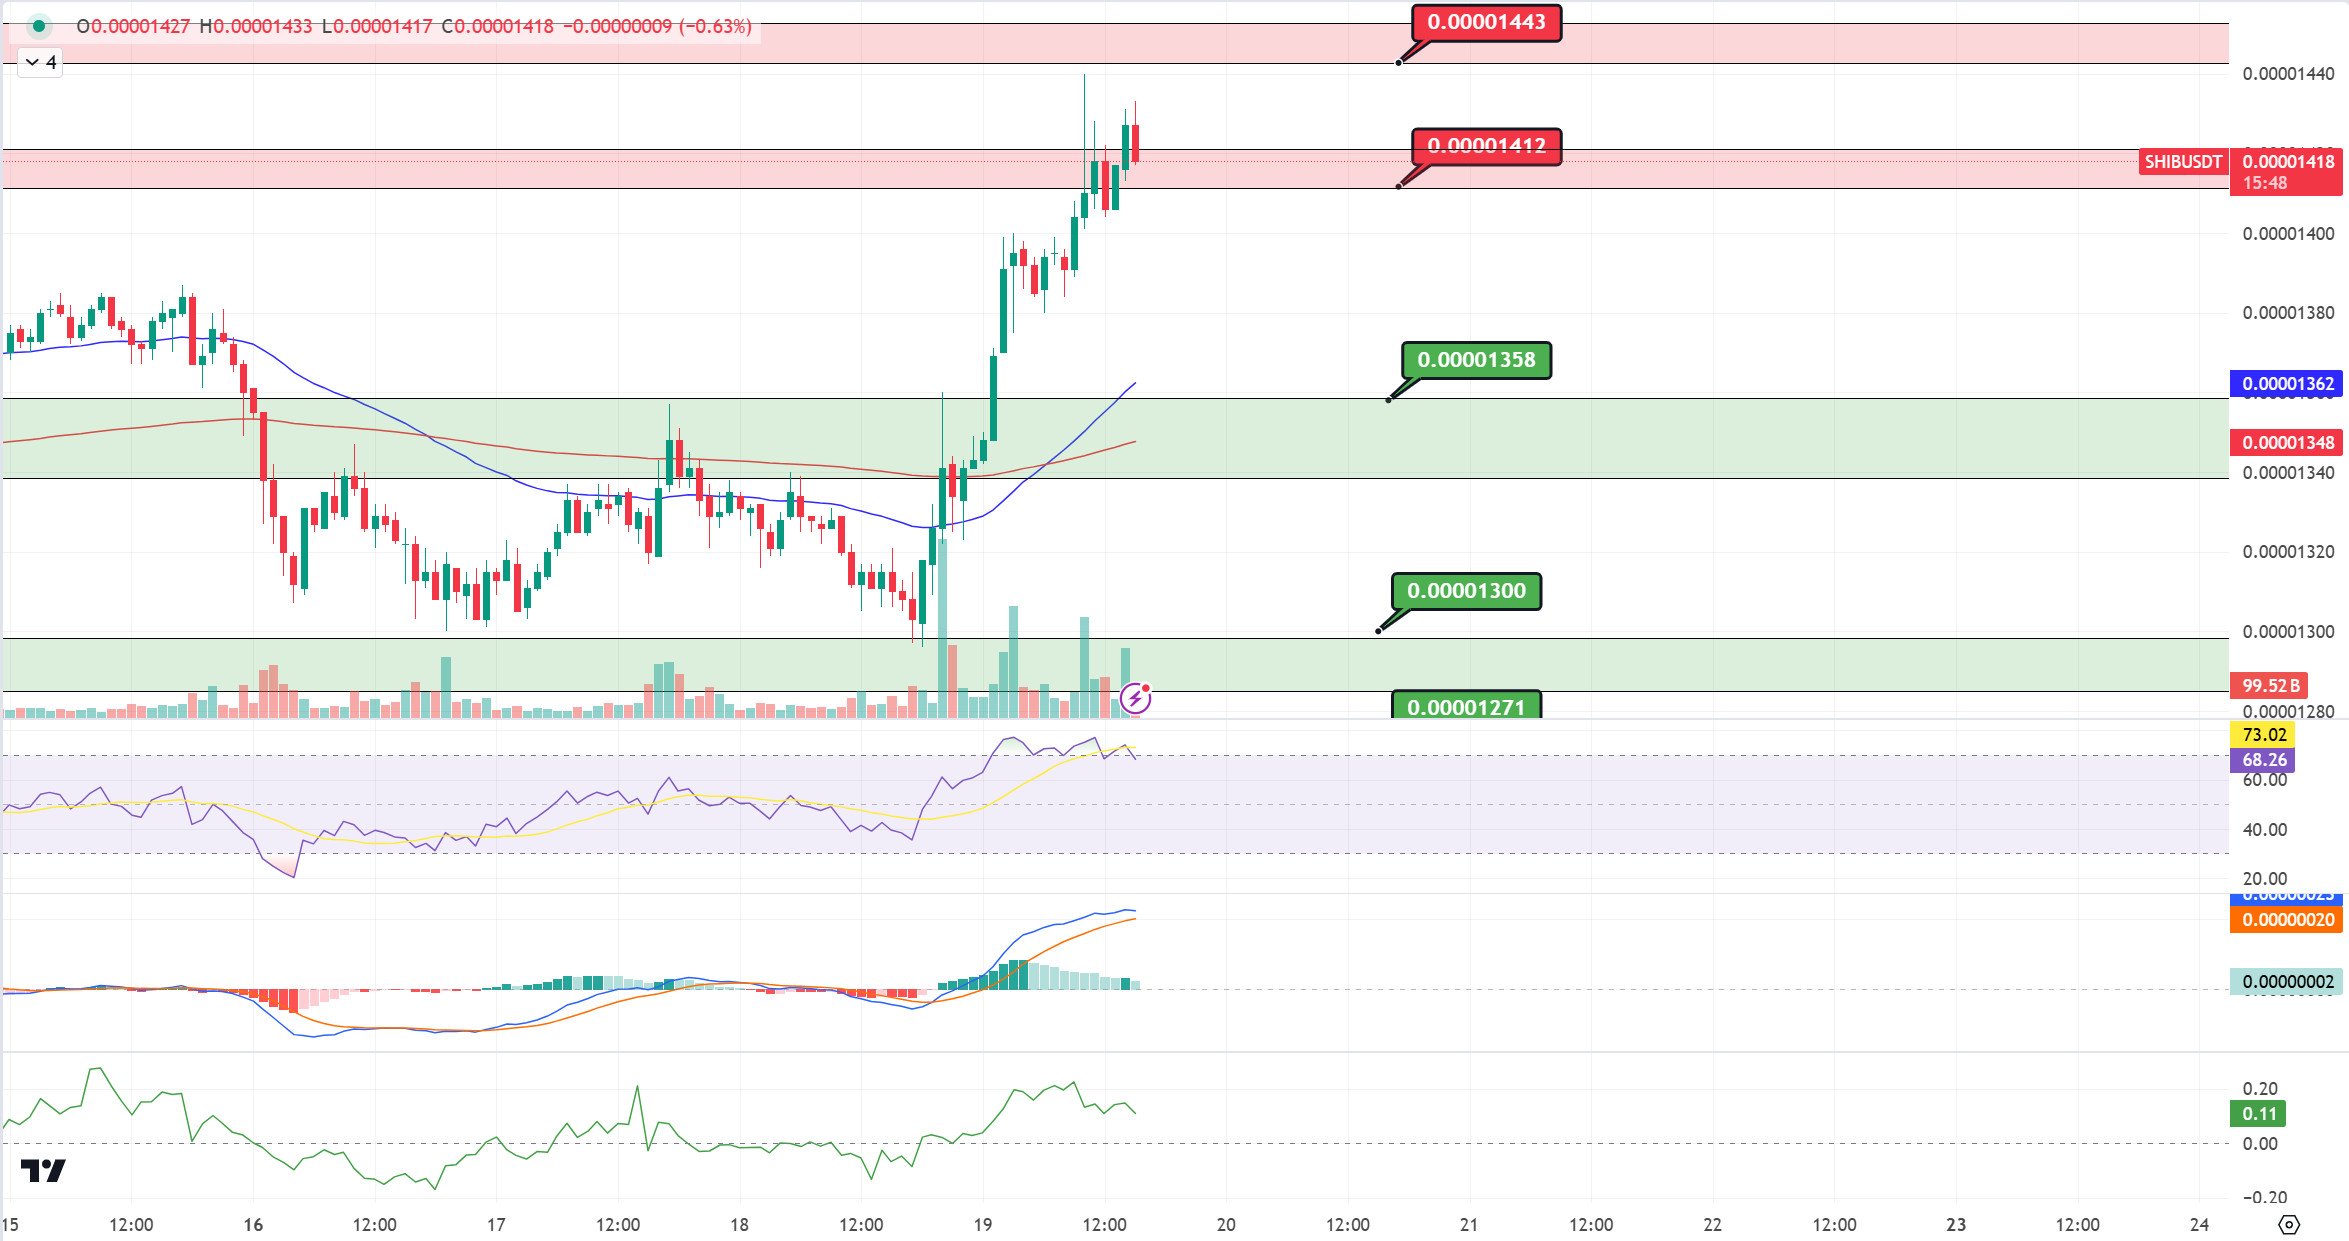
SHIB/USDT
Shytoshi Kusama’s recent tweet has caused a stir in the Shiba Inu community. In the photo of the tweet, a figure wearing a mask and a different coloured mask next to it draws attention. Kusama’s tweet, which he shared with the #token2049 tag, shows that he may have attended the blockchain event in Singapore. The plastic card in the photo carries Tron’s logo.
When we examine the SHIB chart, the price seems to have broken the 0.00001412 resistance band and approached the 0.00001443 resistance band. SHIB, which retreated towards 0.00001412 levels with increasing selling pressure at 0.00001443 levels, may test 0.00001412 levels if selling pressure increases. If the price cannot provide permanence at 0.00001412 levels, we can expect a correction to the support level of 0.00001358 band. On the other hand, if the price can maintain above the 0.00001412 level after the correction, it may want to break the selling pressure at the resistance level of 0.00001443.
(Blue line: EMA50, Red line: EMA200)
Supports 0.00001358 – 0.00001300 – 0.00001271
Resistances 0.00001412 – 0.00001443 – 0.00001475
LEGAL NOTICE
The investment information, comments and recommendations contained herein do not constitute investment advice. Investment advisory services are provided individually by authorized institutions taking into account the risk and return preferences of individuals. The comments and recommendations contained herein are of a general nature. These recommendations may not be suitable for your financial situation and risk and return preferences. Therefore, making an investment decision based solely on the information contained herein may not produce results in line with your expectations.
