
MARKET SUMMARY
Latest Situation in Crypto Assets
*Prepared on 25.09.2024 at 14:00 (UTC)
WHAT’S LEFT BEHIND
Crypto demand in China grows despite ban
The recent economic troubles in China, which saw signs of monetary expansion yesterday, seem to have pushed investors into the crypto space. According to research by blockchain analysis firm Chainalysis, $75.4 billion entered OTC platforms in China in the 3 quarter period until June.
Quarterly Bitcoin Options Expire
Cryptocurrency exchange Deribit reported that the bitcoin (BTC) market could experience volatility over the next two days as options contracts worth several billion dollars are set to expire at 08:00 UTC on Friday. At the time of writing, 90,000 BTC options contracts worth $5.8 billion, as well as $1.9 billion worth of ether options, are due to expire.
Visa to offer banks services for tokenization and smart contracts
Visa has created a new platform to accelerate the adoption of tokenized assets and smart contracts in the financial sector. The platform allows financial institutions to issue fiat-backed tokens and test their use cases.
HIGHLIGHTS OF THE DAY

INFORMATION
*The calendar is based on UTC (Coordinated Universal Time) time zone. The economic calendar content on the relevant page is obtained from reliable news and data providers. The news in the economic calendar content, the date and time of the announcement of the news, possible changes in the previous, expectations and announced figures are made by the data provider institutions. Darkex cannot be held responsible for possible changes that may arise from similar situations.
MARKET COMPASS
The US Federal Reserve’s (FED) 50 basis point interest rate cut followed by steps taken by China to support the economy had increased the risk appetite in global markets. Investors seem more inclined to take some money off the table today.
The fear of a recession, which has worried the markets from time to time in the past weeks, does not seem to have resurfaced despite yesterday’s lower than expected Conference Board Consumer Confidence data. While the Middle East is heating up again, we can say that it has ceased to be the main dynamic dominating prices for now. Still, we are seeing a pullback today in asset groups that are considered to be relatively riskier. However, it is more reasonable to attribute this not to “risk aversion” but to the nature of the market after the recent rises. It is also being questioned how successful China’s large-scale easing moves will be in revitalizing the world’s second largest economy quickly.
European stock markets are generally on the negative side and US indices are in the green but for now close to flat. The dollar index gave back almost all of its morning gains. We can say that there is a horizontal or slight retreat in digital assets.
In the second half of the week, US data and statements from Federal Open Market Committee (FOMC) officials will be under scrutiny. In addition, the expiration of a large percentage of BTC options on Friday is another factor that could increase volatility in the market. Although all components of the equation point to a continuation of the rises brought about by increased risk appetite, the euphoria seems to have subsided somewhat. Major digital asset BTC’s morning pullback also continued despite the biggest ETF inflows in almost a month yesterday, but a reaction should not be ruled out. However, we would expect the recent losses to continue if the markets start looking for a new catalyst for further gains and fail to find it.
TECHNICAL ANALYSIS
BTC/USDT
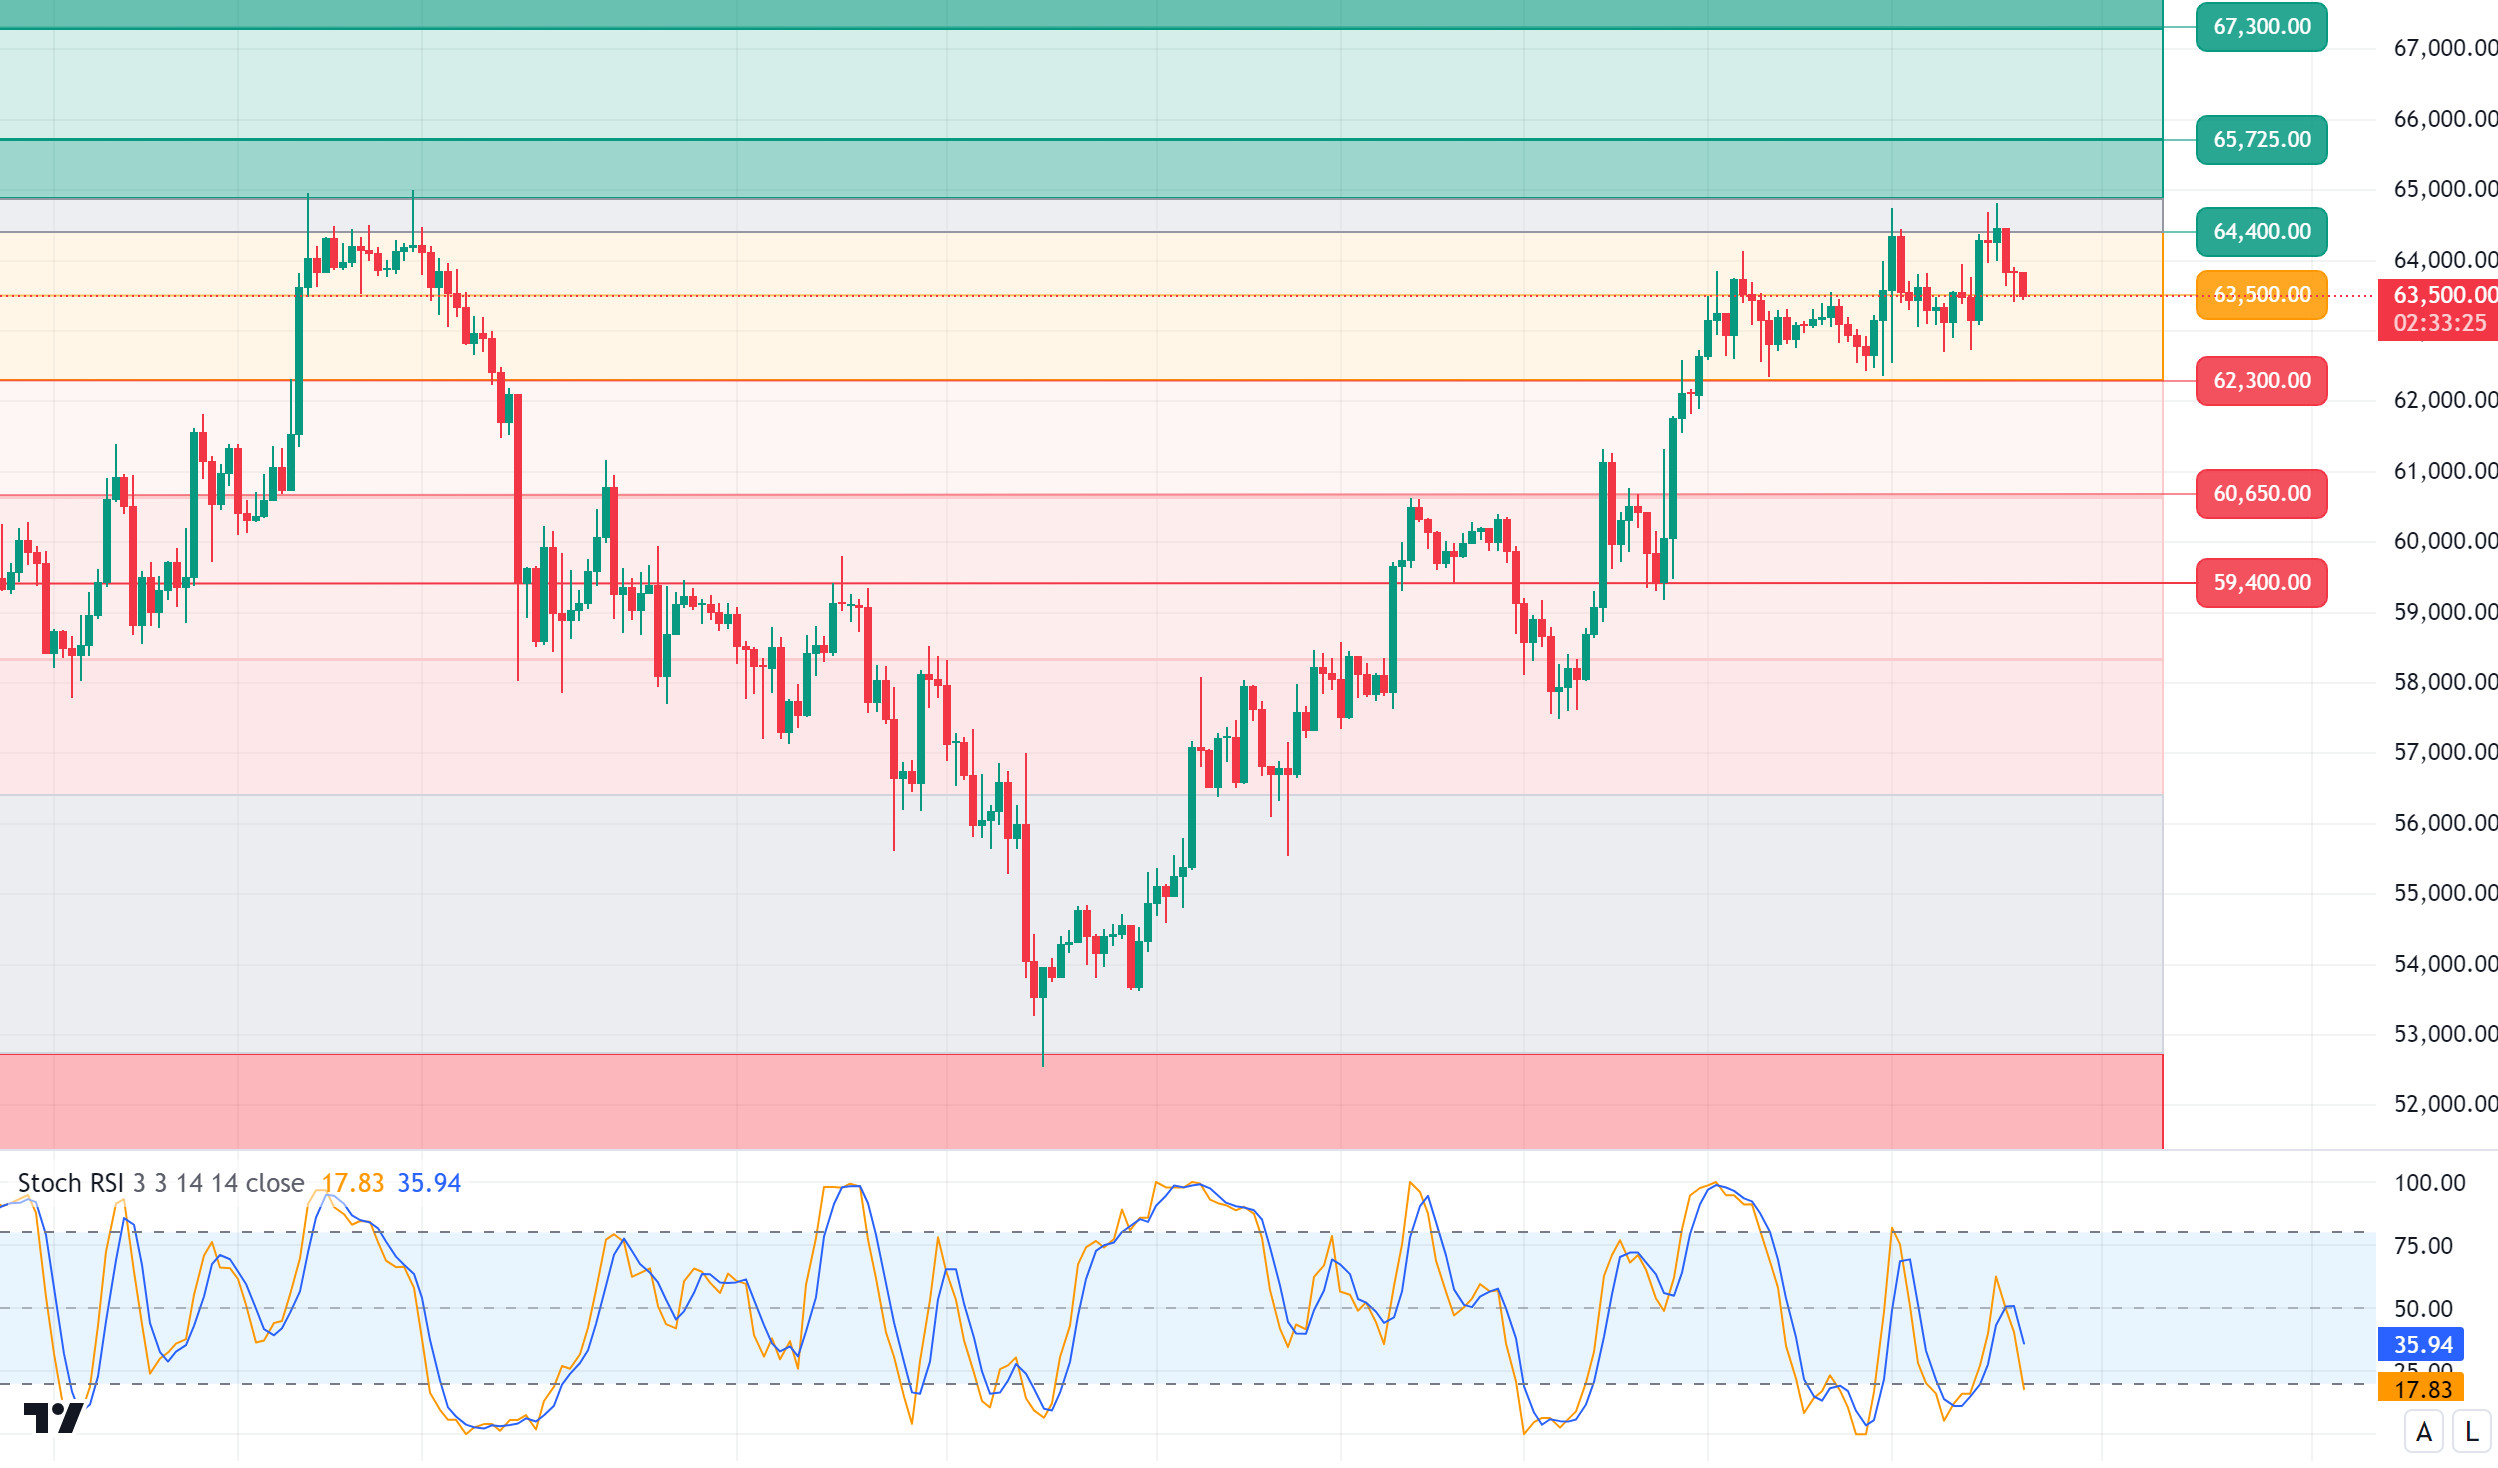
Correction from Bitcoin! In the crypto market, where optimistic weather is experienced, US macroeconomic data and liquidity inflows with the Chinese stimulus package continue to reassure the market. In this period when market corrections remain limited, the low supply in Bitcoin stands out as one of the most important factors in keeping the price strong, with long-term expectations replacing short-term sub-sells. In the BTC 4-hour technical analysis, we see that the price, which gave bearish signals from the 64,000 level in the morning hours, is currently in a correction movement by coming to the 63,500 minor support level. Liquidation, which is the part we emphasized in our previous analysis, may end a correction movement that is likely to be weighted on long transactions at the 62,300 support level by testing this level. Otherwise, it should be noted that the bullish mood on the market continues and with the upward movement, the 64,400 level may appear as resistance again.
Supports 62,300 – 60,650 – 59,400
Resistances 64,450 – 65,725 – 67,300
ETH/USDT
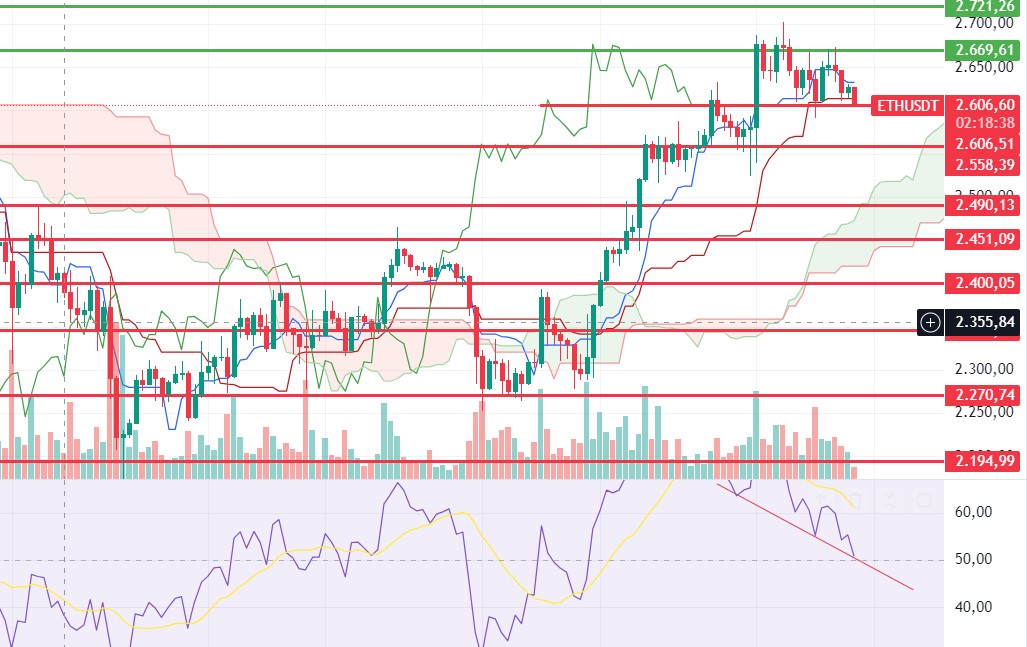
For Ethereum, which tried to hold on to the 2,612 level during the day, negative structures in OBV, momentum and RSI seem to continue. With the loss of the 2,612 level, we can see a rapid retracement to 2,558 levels. The 2,558 level stands out as a level to be considered for purchases. If there is no reaction from this level, it can be said that a deep decline towards 2,490 levels may come. In order for the positive trend to continue, a voluminous break of the 2.669 level seems to be needed. The break of this level may trigger rises towards 2,721, then 2,815.
Supports 2,612 – 2,558 – 2,490
Resistances 2,669 – 2,721 – 2,815
LINK/USDT
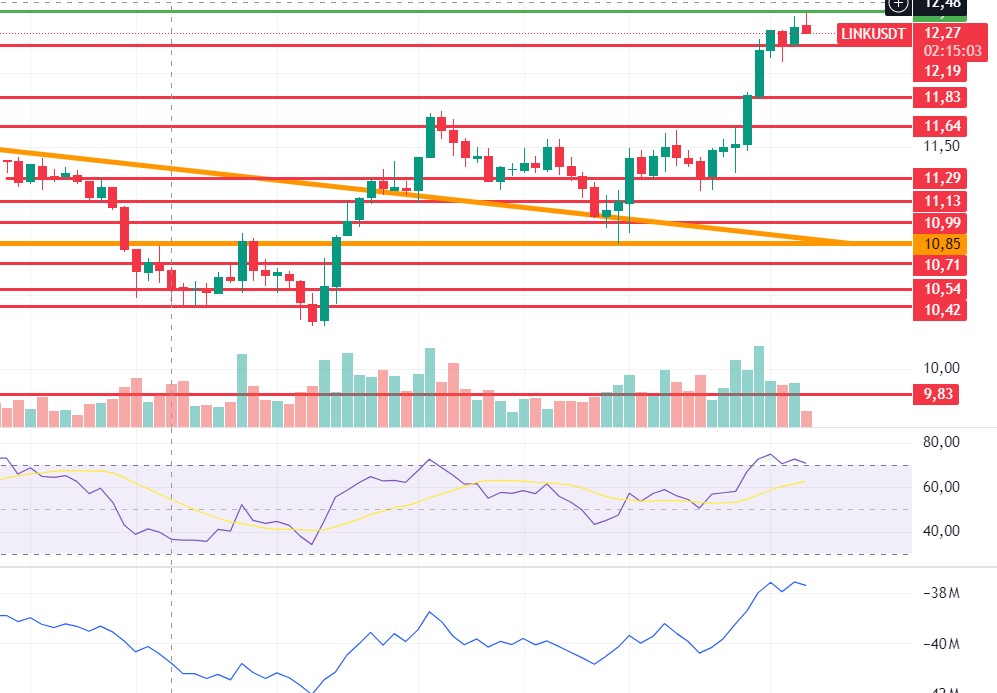
LINK continues horizontally after the rise towards 12.42, the first target with the gain of 12.19 level. With the RSI giving a negative mismatch in the overbought zone and the sell signal in OBV, a re-test to 12.19 levels can be expected during the day. The break of this level may bring declines to 11.83 levels. Closes above 12.42 may cause the continuation of the positive trend and rises up to 12.71.
Supports 12.19 – 11.83 – 11.64
Resistances 12.42 – 12.71 – 13.46
SOL/USDT
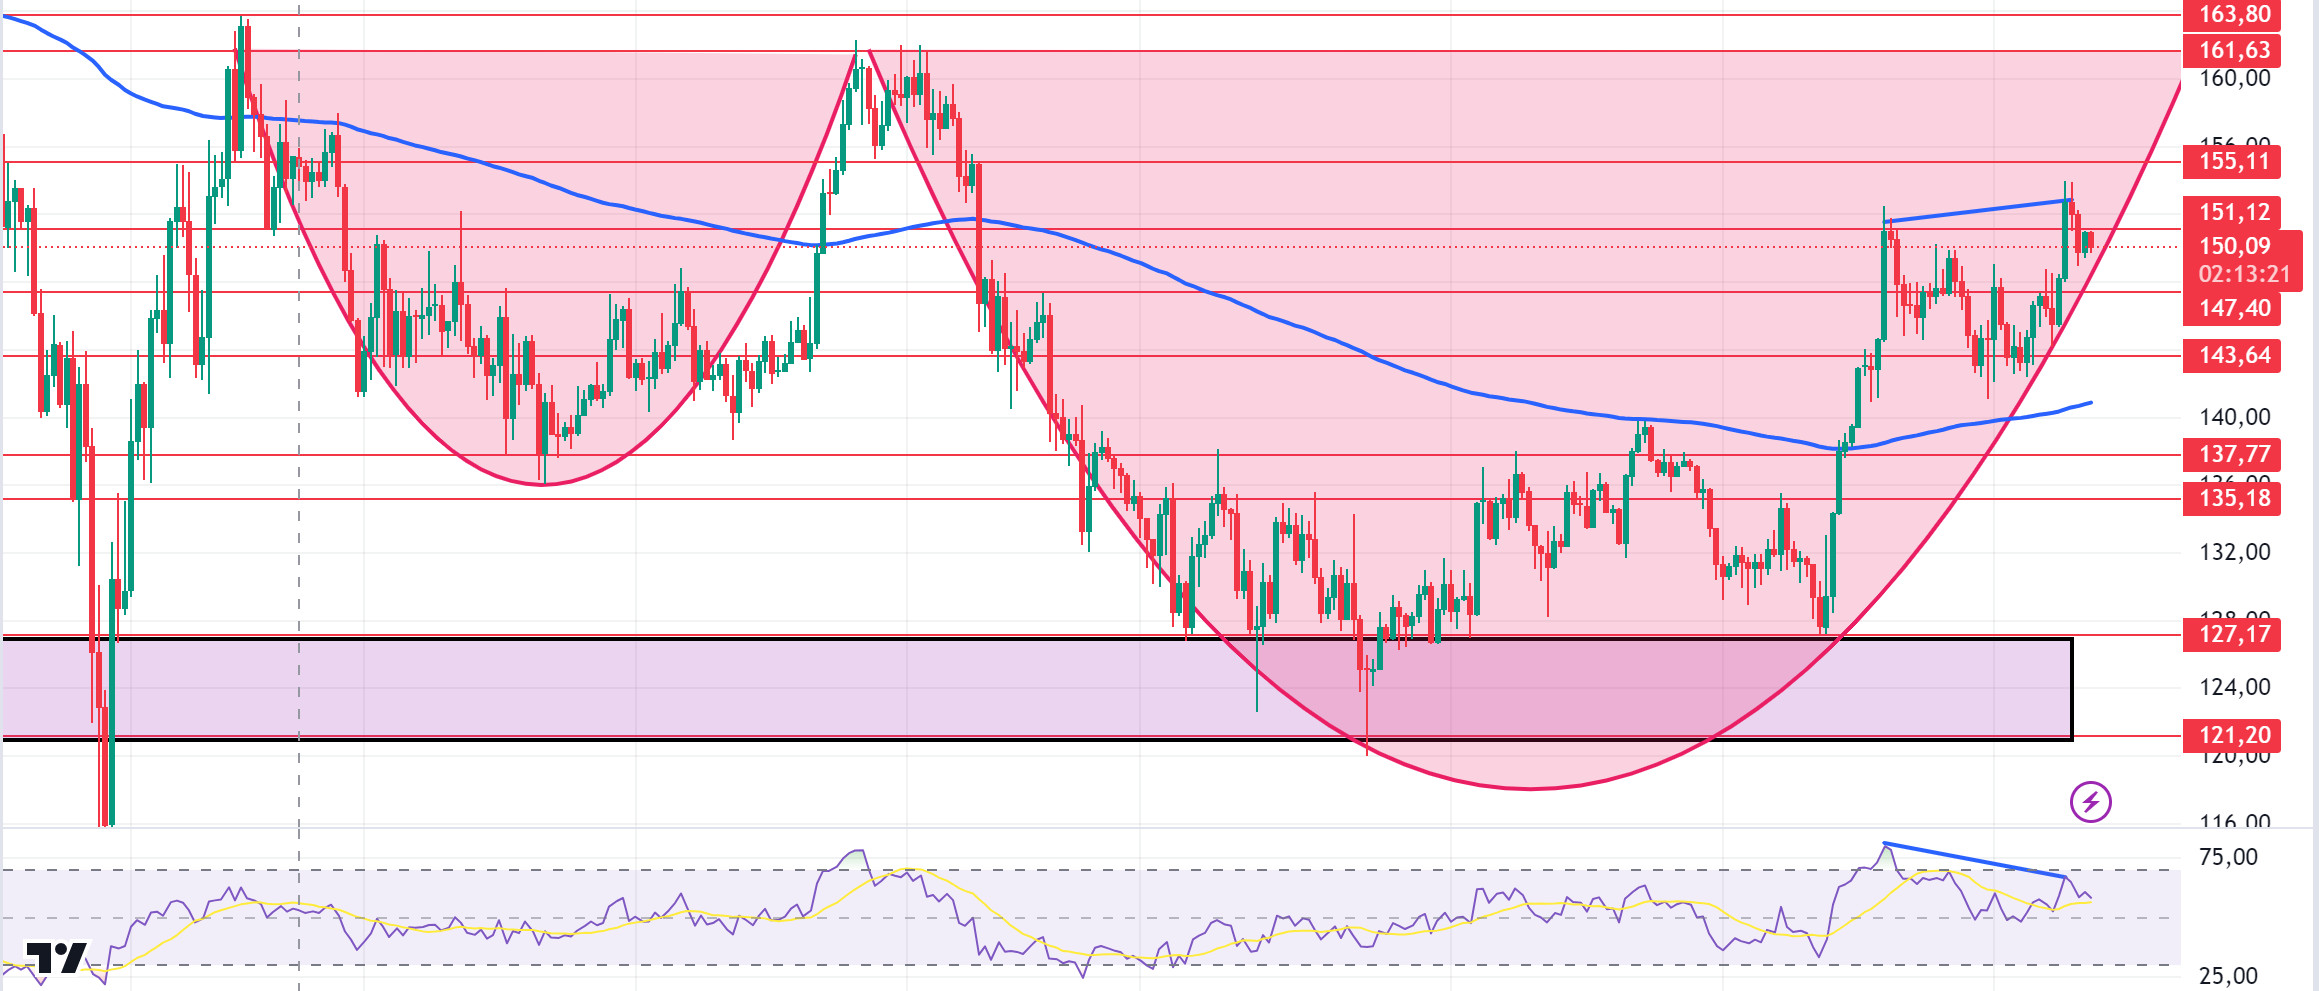
Hivemapper, Helium and Helio co-founders Solana discuss blockchain projects and bringing crypto to real life. When we examine the chart, light profit sales continue to come since our analysis in the morning. The cup handle pattern continues to form and continues to form. On the other hand, there is a mismatch in the rsi (14) indicator on the 4-hour chart. This is a signal that profit sales may continue. Both macroeconomic conditions and innovations in the Solana ecosystem, 151.12 – 155.11 levels appear as resistance levels. If it rises above these levels, the rise may continue. It can support the 200 EMA average in the pullbacks that will occur if investors continue profit sales. 147.40 – 143.64 levels appear as support. If it comes to these support levels, a potential rise should be followed.
Supports 147.40 – 143.64 – 137.77
Resistances 151.12 – 155.11 – 161.63
ADA/USDT
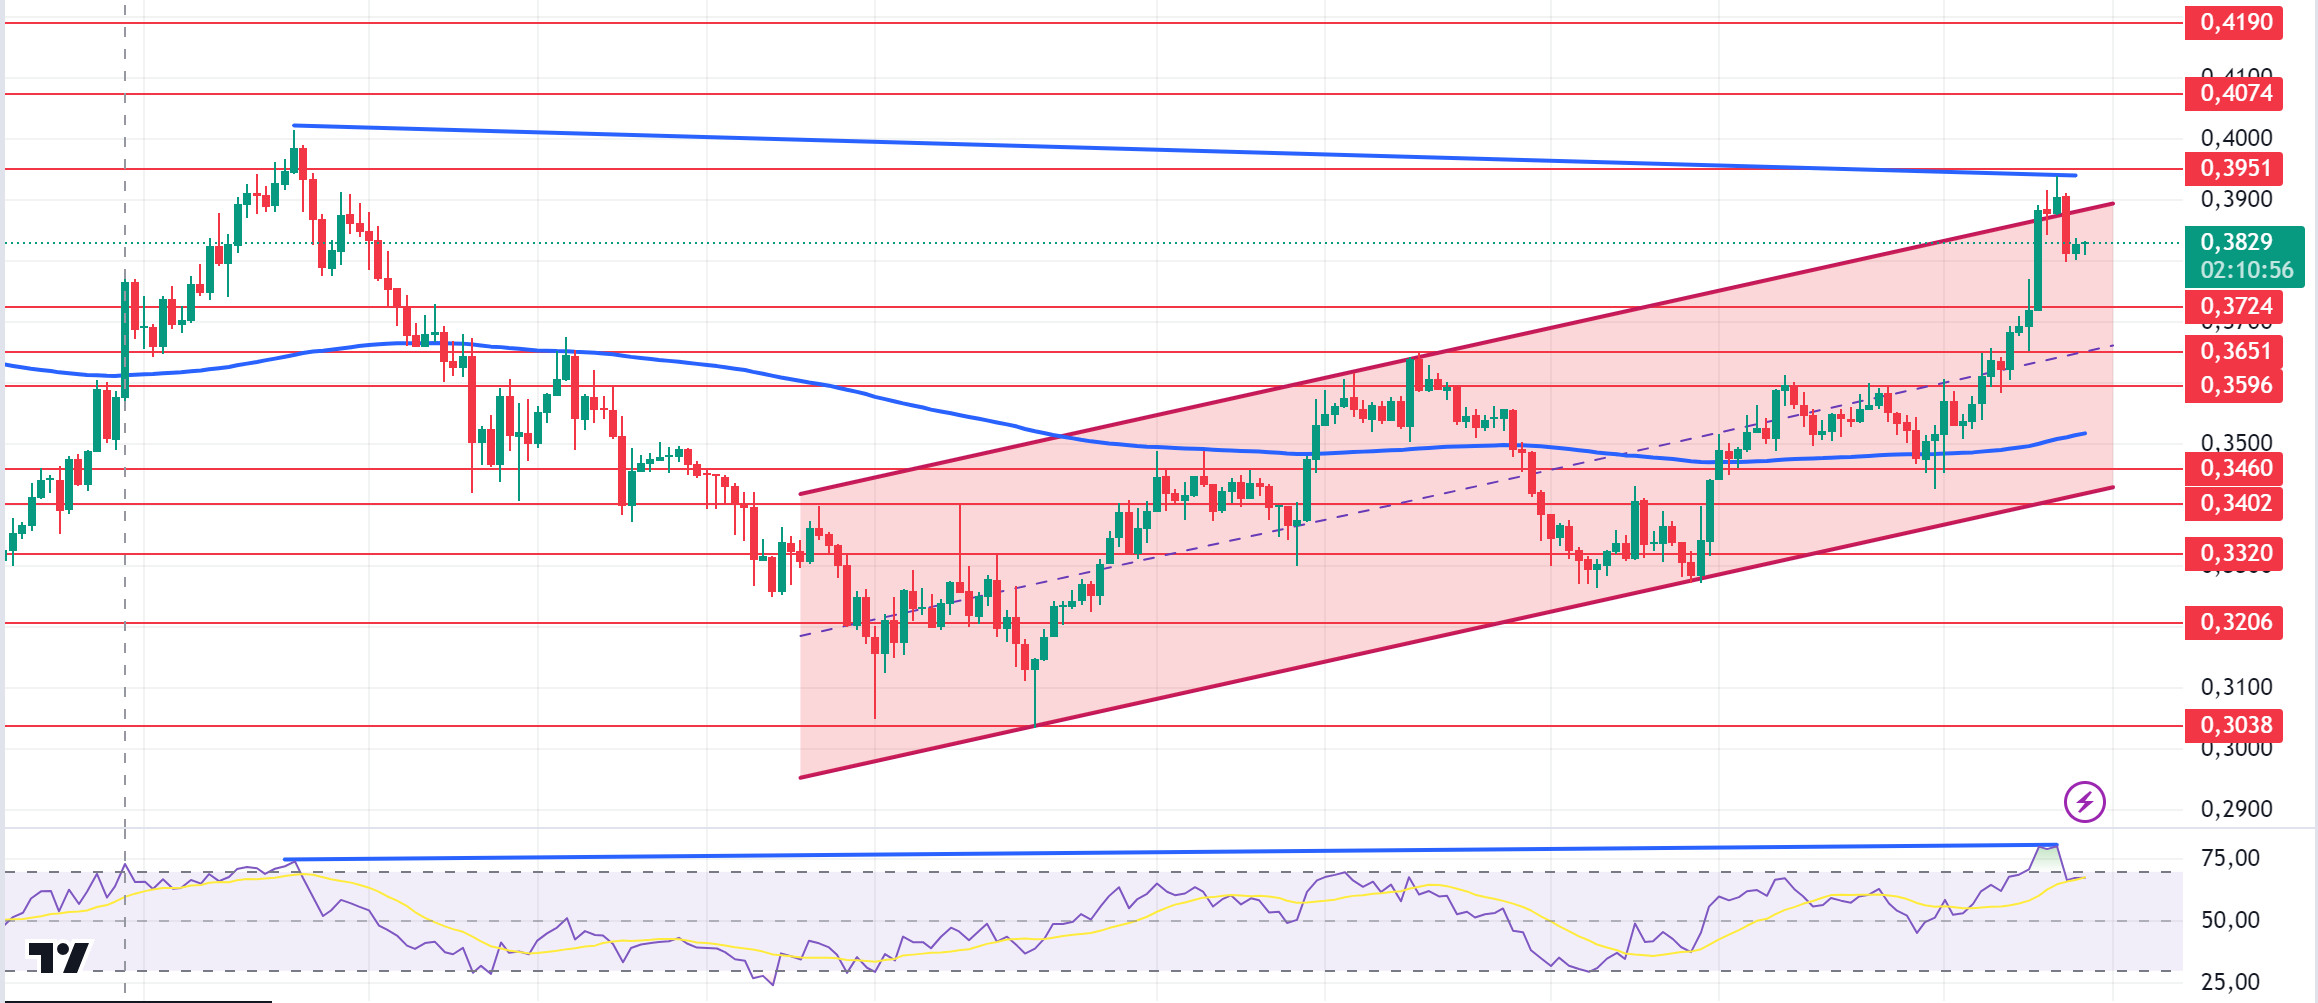
Since our analysis in the morning, ADA has kept pace with the market, falling 2.96%. Although whale buying increased, the market pullback as well as profit taking caused ADA to re-enter the bullish channel since September 2. On the other hand, investors are cautious as the RSI (14) has reached its saturation point and a mismatch has formed on the 4-hour chart. The 0.3651 level and the 200 EMA stand out as strong support in retracements due to possible profit sales. With the continuation of the positive atmosphere in the ecosystem, the 0.3951 level can be followed as resistance in the rises that will take place.
Supports 0.3724 – 0.3651 – 0.3596
Resistances 0.3951 – 0.4074 – 0.4190
AVAX/USDT
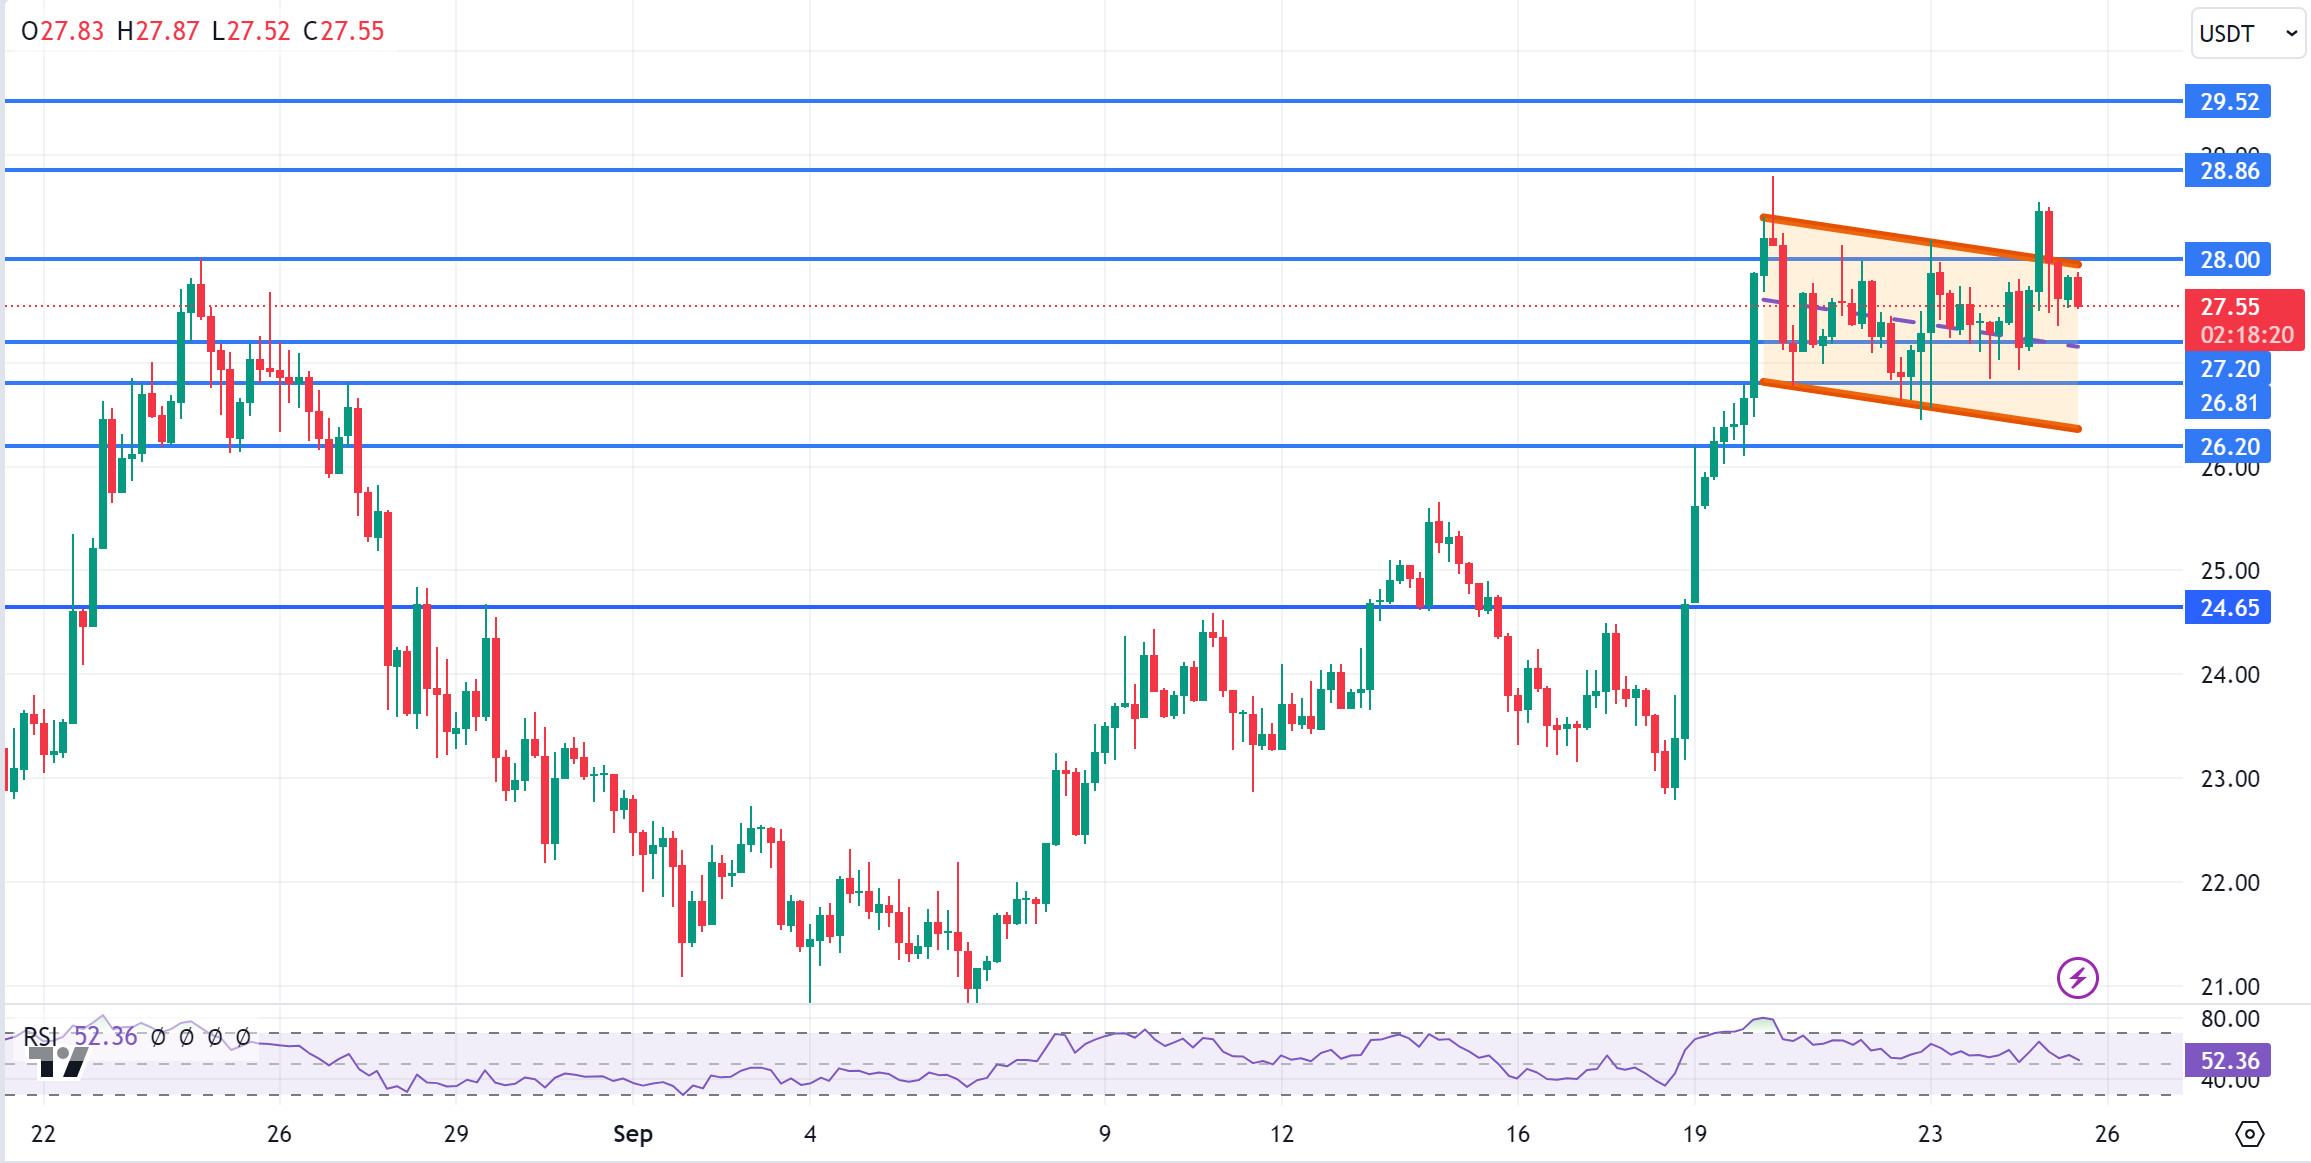
AVAX, which opened today at 28.46, fell by about 3% during the day and is currently trading at 27.55. On the 4-hour chart, we see a rising flag pattern. It continues to consolidate in the falling channel near the horizontal and can be expected to break the channel upwards after moving in the channel for a while. In such a case, it may test the 28.86 and 29.52 resistances. If recession concerns in the market create selling pressure, it may break the channel downwards. In this case, it may test the 27.20 and 26.81 supports. As long as it stays above 24.65 support during the day, it can be expected to continue its upward trend. With the break of 24.65 support, selling pressure may increase.
Supports 27.20 – 26.81 – 26.20
Resistances 28.00 – 28.86 – 29.52
TRX/USDT
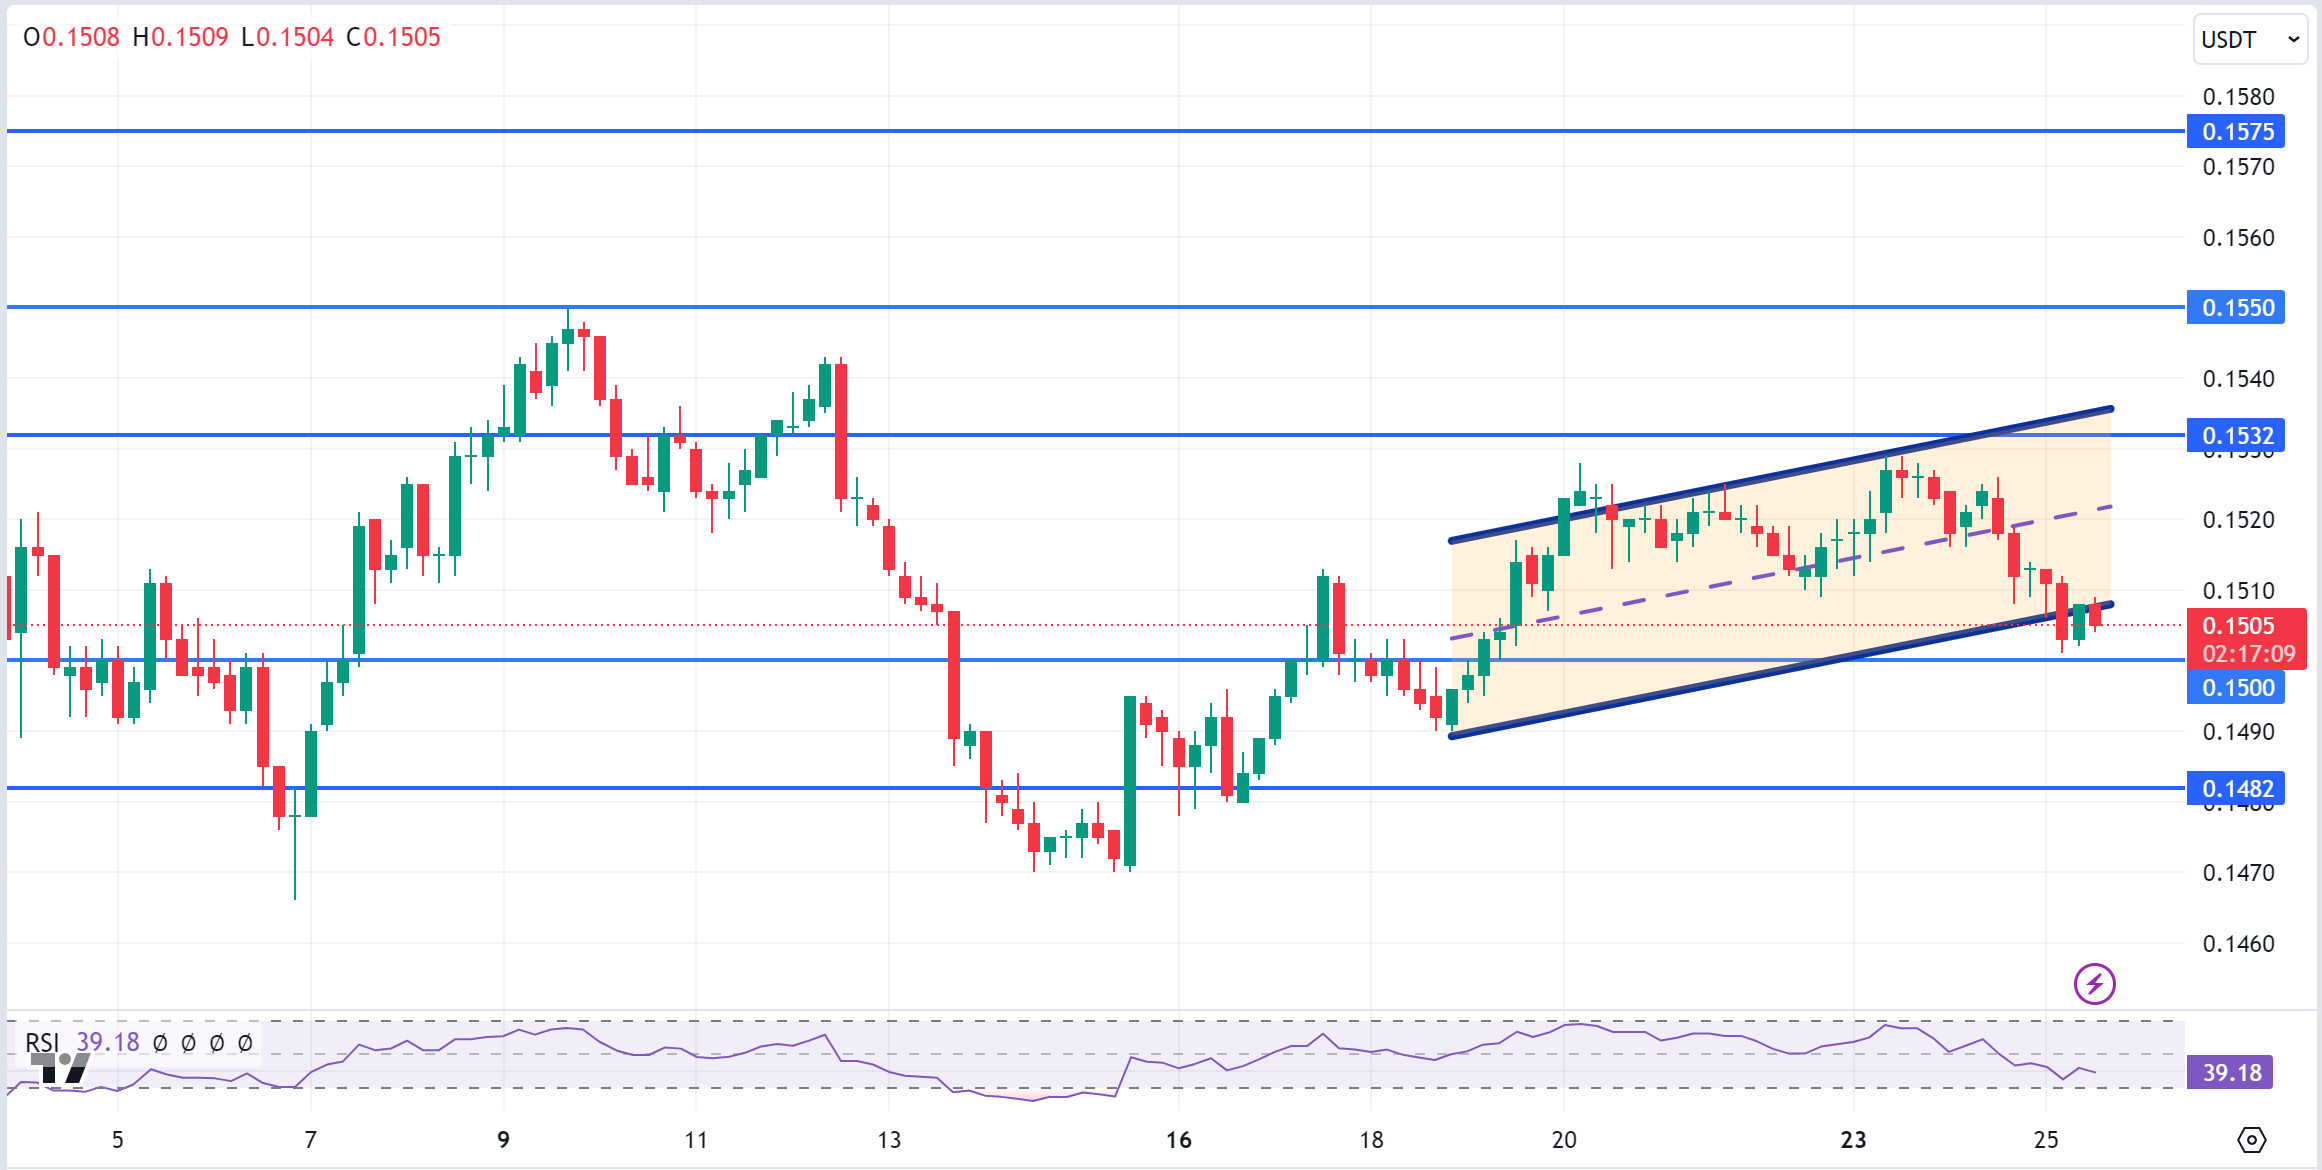
TRX, which started the day at 0.1513, fell slightly during the day and is trading at 0.1505. It is currently moving in an ascending channel on the 4-hour chart. The RSI 39 value has approached the oversold zone and is in the lower band of the rising channel and a rise can be expected from here. In such a case, it may move to the middle and upper band of the channel and test the 0.1532 support. However, it is currently trying to break the lower band of the channel and may break the channel downwards with the possible selling pressure. In such a case, it may test the 0.1500 support. Unless it breaks the 0.1500 support, it may want to return to the rising channel. TRX may continue to be bullish as long as it stays above 0.1482 support. If this support is broken downwards, sales can be expected to increase.
Supports 0.1500 – 0.1482 – 0.1429
Resistances 0.1532 – 0.1575 – 0.1603
XRP/USDT
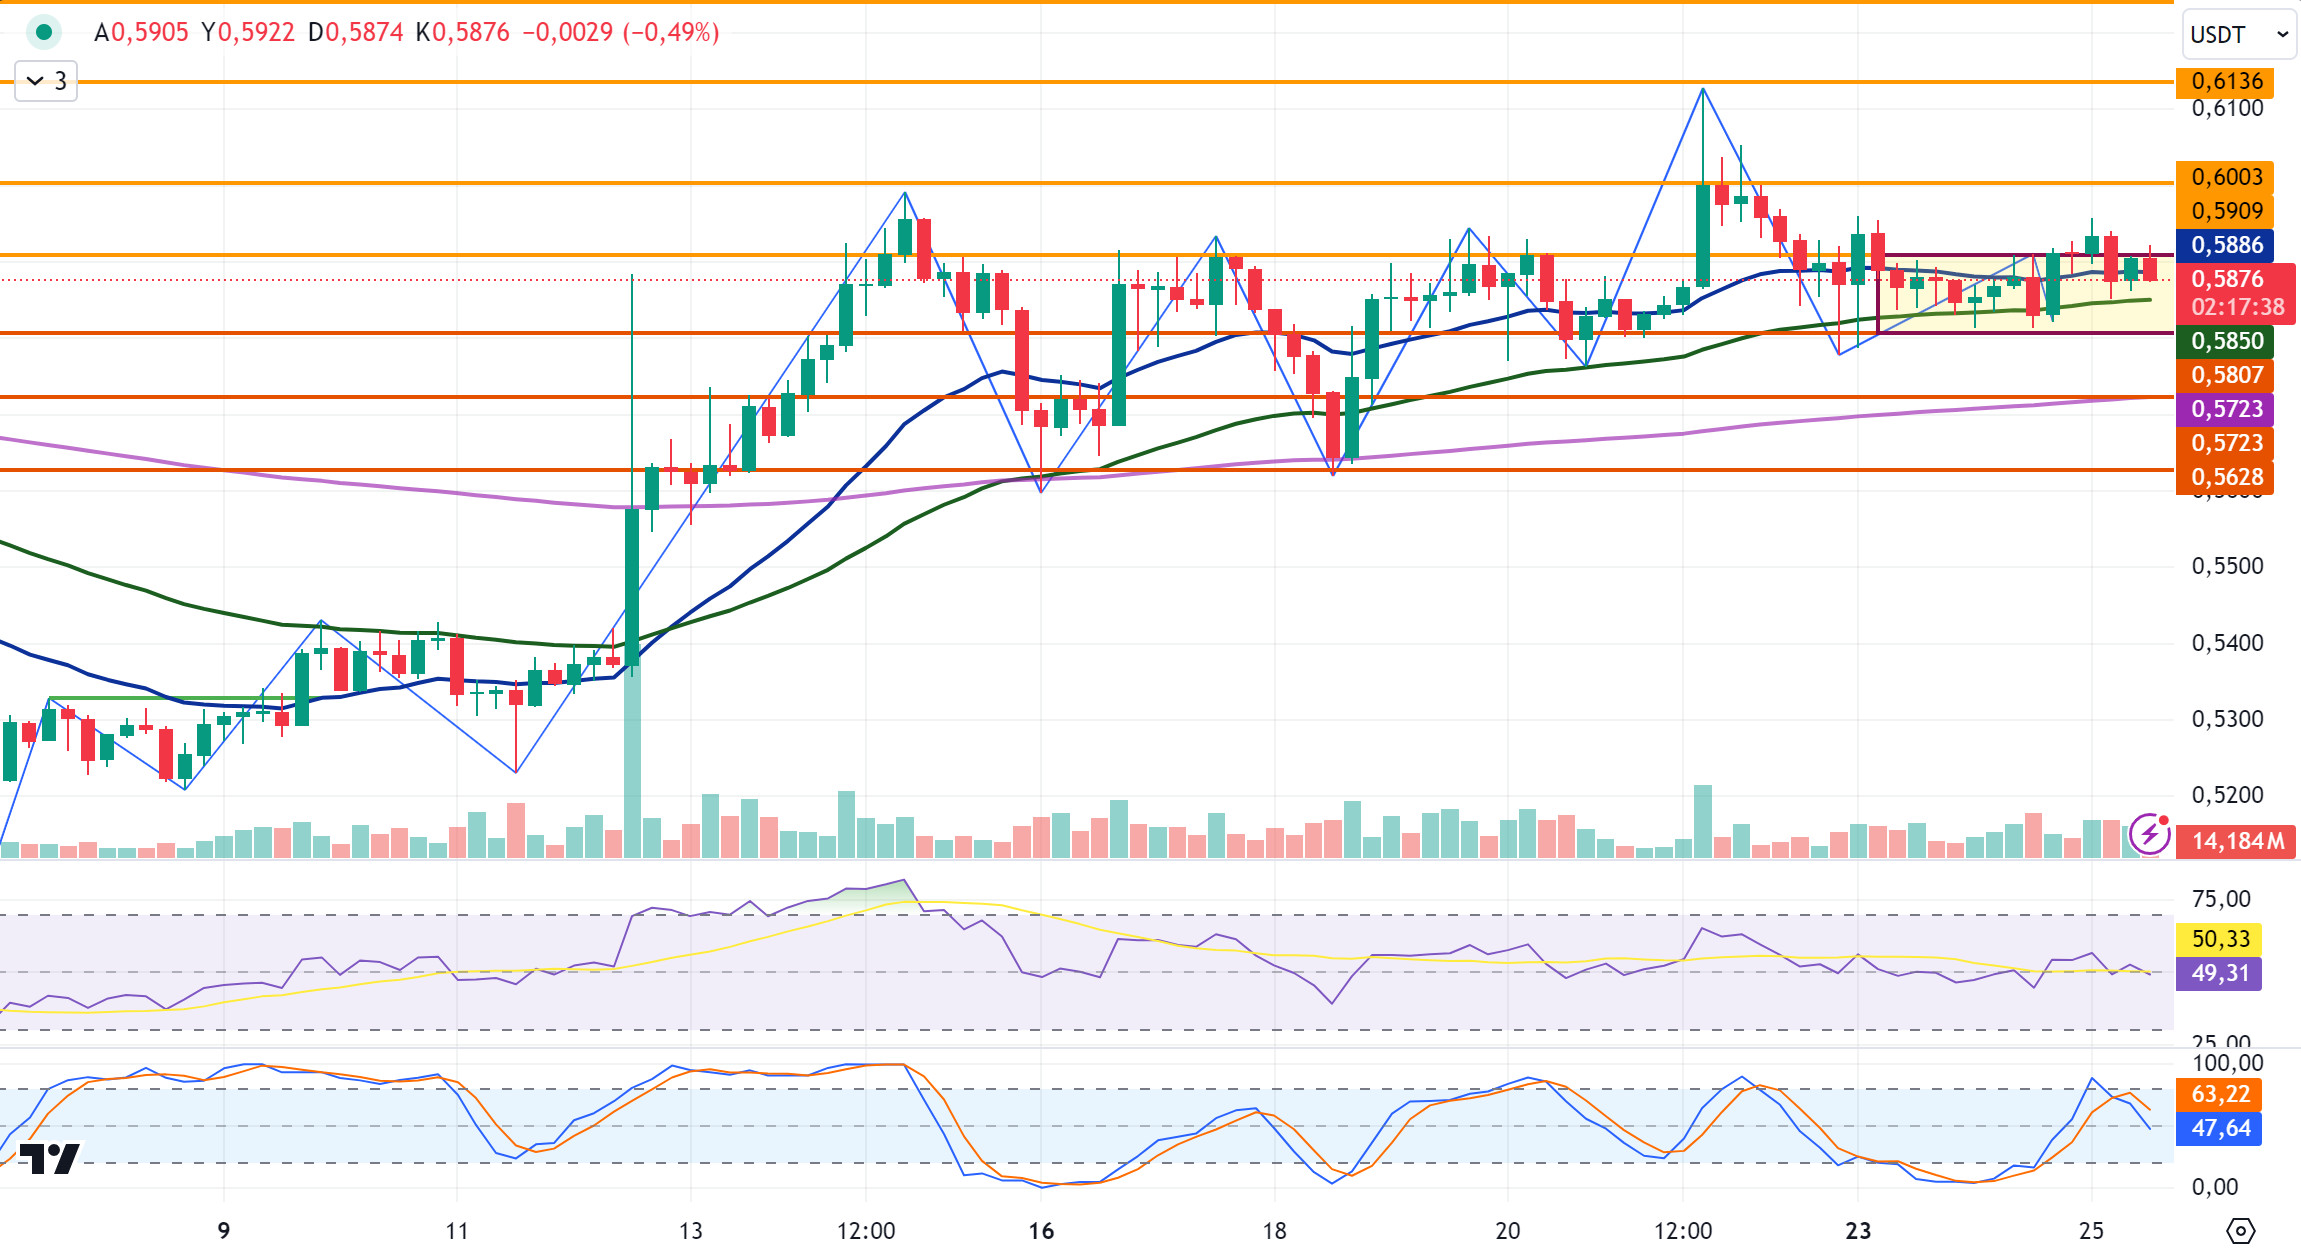
XRP continues to trade at 0.5898 today, up about 1%. In the 4-hour analysis, after testing the 0.5909 resistance level with its rise, it fell with the incoming sales and after falling below the EMA20 level, it is retesting the 0.5909 level in the last candle with its rise again and if it breaks it, it may test the resistance levels of 0.6003-0.6136 in the continuation of the rise. If the 0.5909 resistance level cannot be broken and a decline occurs, XRP may continue its movement in a horizontal band between the EMA20 and EMA50 levels. If it falls below the EMA50 level after the decline, it may test the support levels of 0.5807-0.5723-0.5628 with the deepening of the decline.
XRP may rise with possible purchases at the 0.5723 support level on the decline and may offer a long trading opportunity. On the rise, it may fall with possible sales at 0.6003 and may offer a short trading opportunity.
EMA20 (Blue Line) – EMA50 (Green Line) – EMA200 (Purple Line)
Supports 0. 5807 – 0.5 723 – 0.5628
Resistances 0.5909 – 0.6 003 – 0.6136
DOGE/USDT
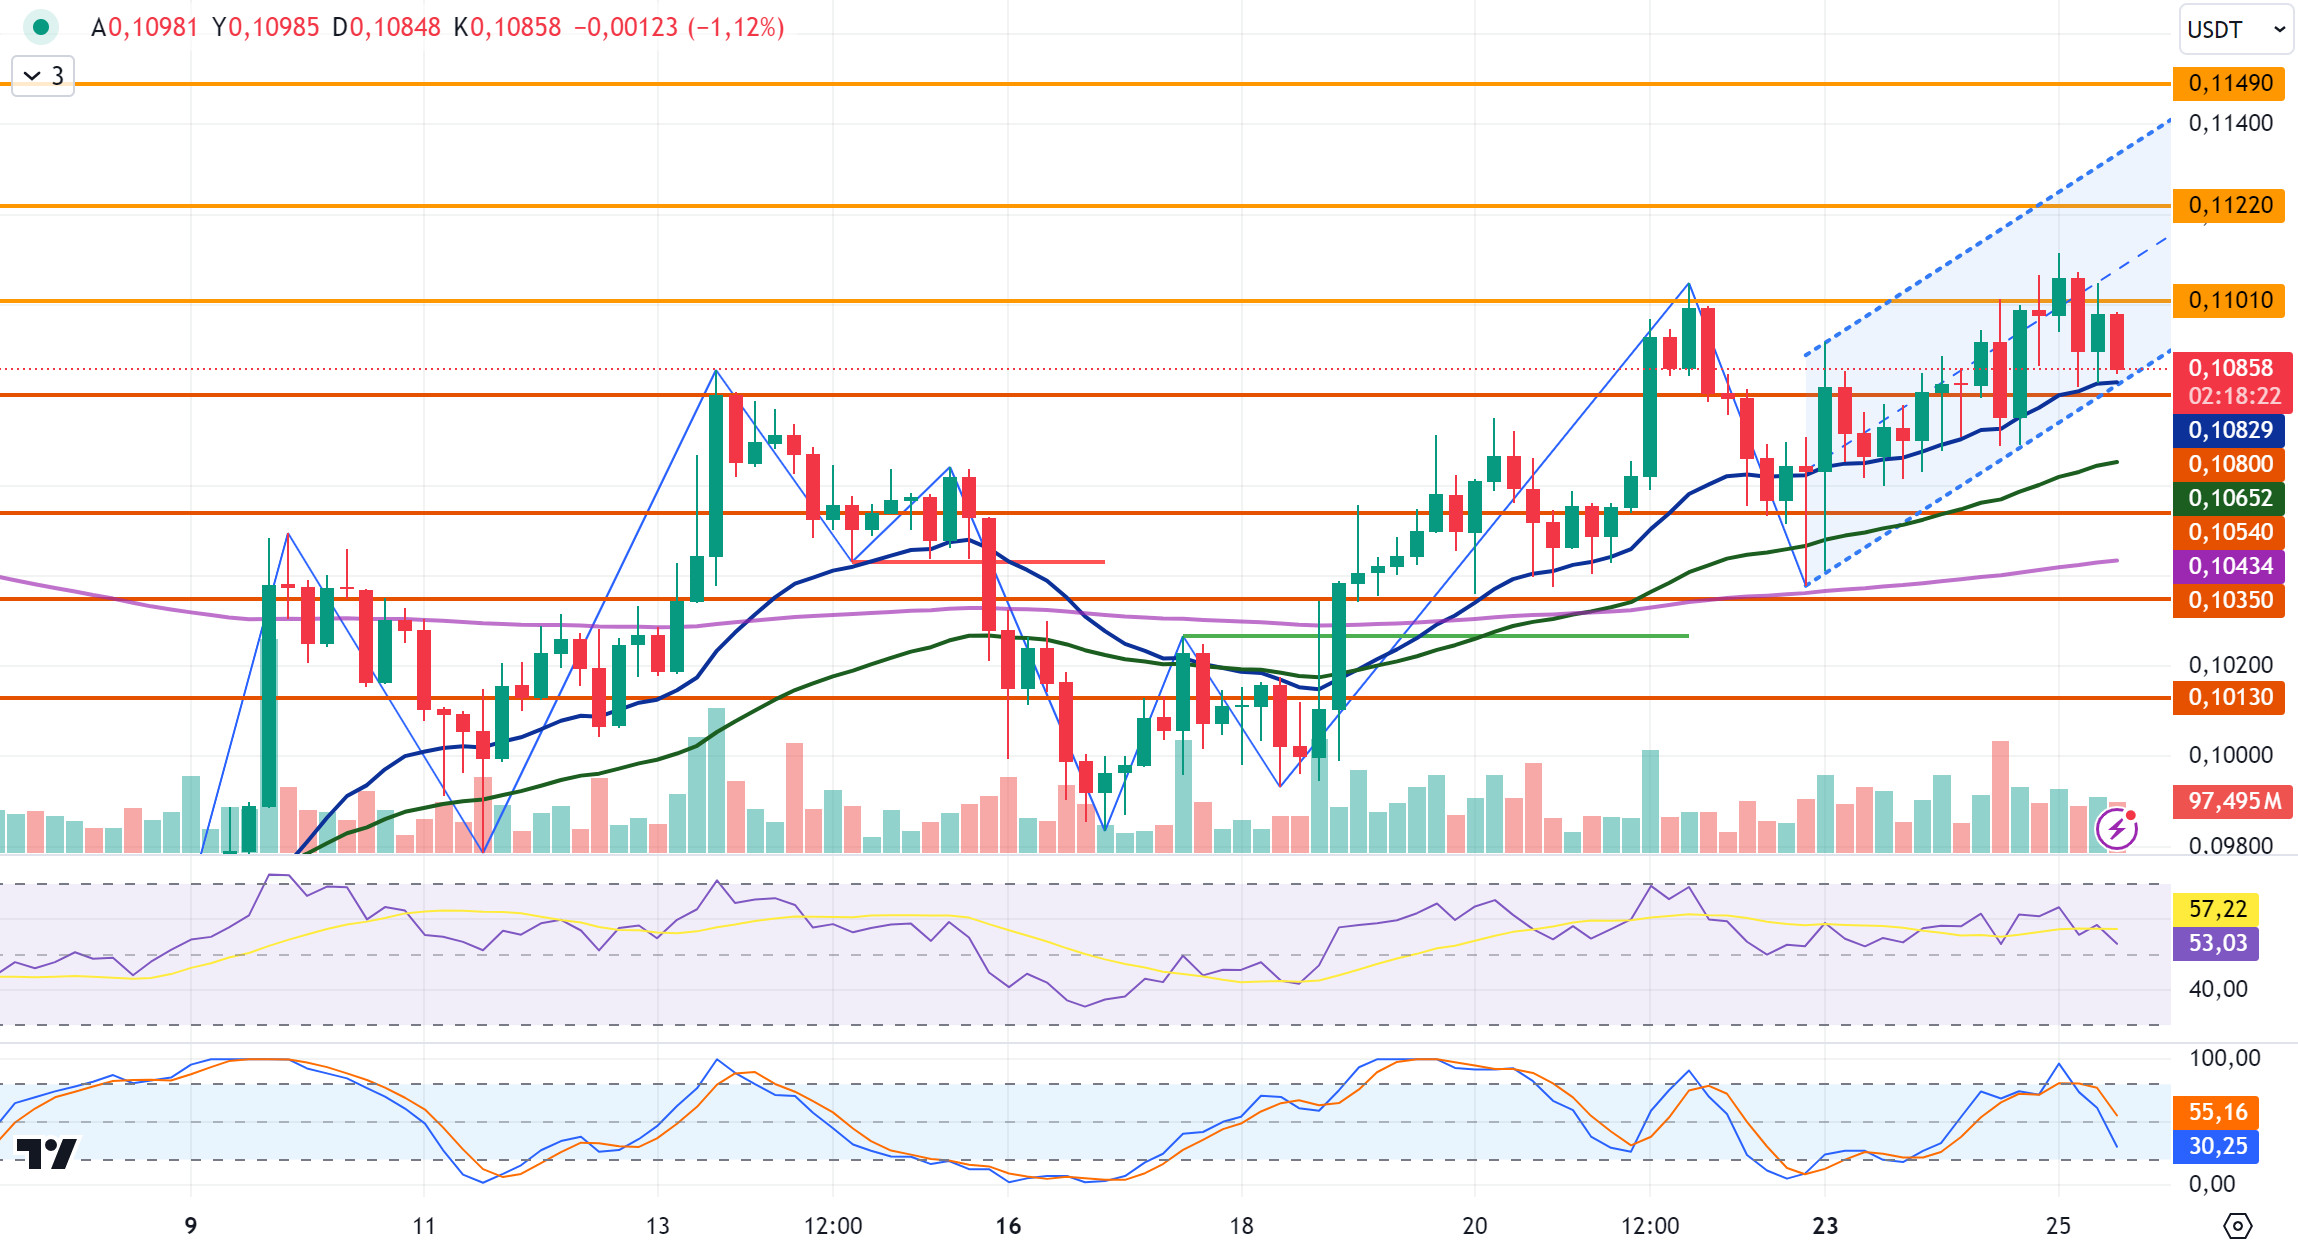
After starting today at 0.1080, DOGE tested the EMA20 level in the 4-hour analysis with the decline it experienced after starting today at 0.1080 and failed to break it and started to rise with the incoming purchases. DOGE, which continued its rise by breaking the 0.1080 level after its rise with incoming purchases, tested the 0.1101 resistance level in the last candle. It is currently trading at 0.1089 with a decline as a result of sales at the resistance level in question. If the decline continues, it may test the 0.1080 support level and if it breaks, it may test the 0.1054-0.1035 support levels with the deepening of the decline. In case it starts to rise again, it may retest the 0.1101 resistance level and if it breaks it, it may test the 0.1122-0.1149 resistance levels in the continuation of the rise.
DOGE may rise with possible purchases at EMA20 and EMA50 levels in its decline and may offer a long trading opportunity. In its rise, the 0.11 resistance zone comes to the fore and it may decline with the sales that may come at this level and may offer a short trading opportunity.
EMA20 (Blue Line) – EMA50 (Green Line) – EMA200 (Purple Line)
Supports 0.1080 – 0.1054 – 0.1035
Resistances 0.1 101- 0.1122 – 0.1149
DOT/USDT
Polkadot spent around $387,000 to take part in the Token2049 event in Singapore, but this had a limited impact on the DOT token price. The project has been criticized for its high marketing budget, with the community questioning why such a large amount was spent despite the platform’s limited number of active users. While the Polkadot treasury remains strong, the community remains concerned about unnecessary marketing spending.
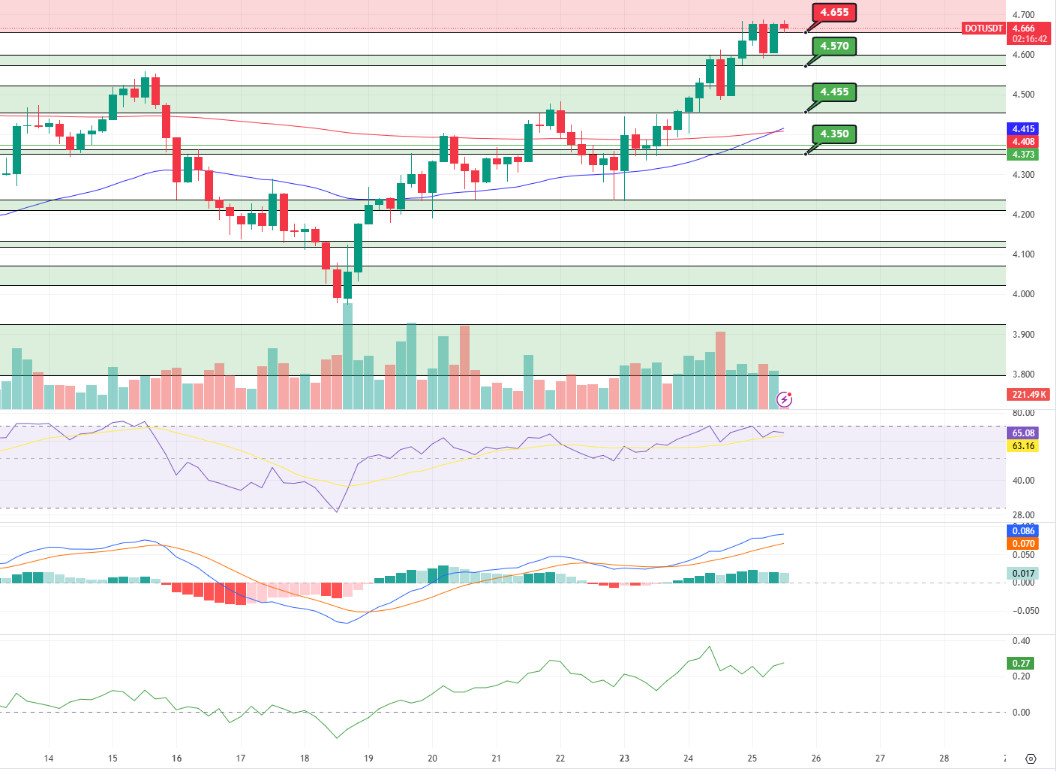
When we examine the Polkadot chart, the price appears at 4.655 resistance. When we examine the CMF oscillator, we see that the buyer pressure is strong. In this context, if the price persists above the 4.655 resistance, its next target may be the 4.785 resistance. On the other hand, if the price cannot break the selling pressure at 4.655 resistance, it may retreat to the first support level of 4.570 band.
(Blue line: EMA50, Red line: EMA200)
Supports 4,570 – 4,455 – 4,350
Resistances 4.655 – 4.785 – 4.910
SHIB/USDT
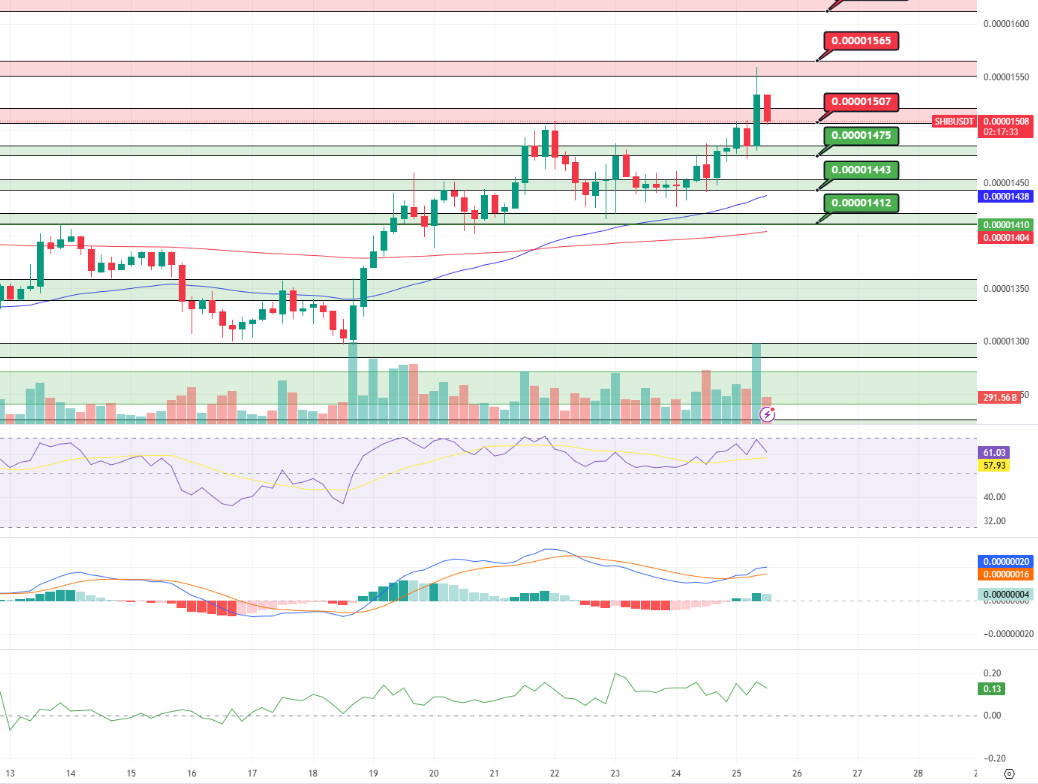
When we examine the chart of Shiba Inu (SHIB), the price seems to have sold from the 0.00001565 resistance level. When we examine the MACD and CMF oscillators, we see that the buyer pressure is strong. If the price maintains above the 0.00001507 resistance, its next target may be 0.00001565 levels. On the other hand, if the price cannot persist above the 0.00001507 resistance, it may retreat to the support level of 0.00001475.
(Blue line: EMA50, Red line: EMA200)
Supports 0.00001475 – 0.00001443 – 0.00001412
Resistances 0.00001507 – 0.00001565 – 0.00001612
LEGAL NOTICE
The investment information, comments and recommendations contained herein do not constitute investment advice. Investment advisory services are provided individually by authorized institutions taking into account the risk and return preferences of individuals. The comments and recommendations contained herein are of a general nature. These recommendations may not be suitable for your financial situation and risk and return preferences. Therefore, making an investment decision based solely on the information contained herein may not produce results in line with your expectations.
