MARKET SUMMARY
Latest Situation in Crypto Assets
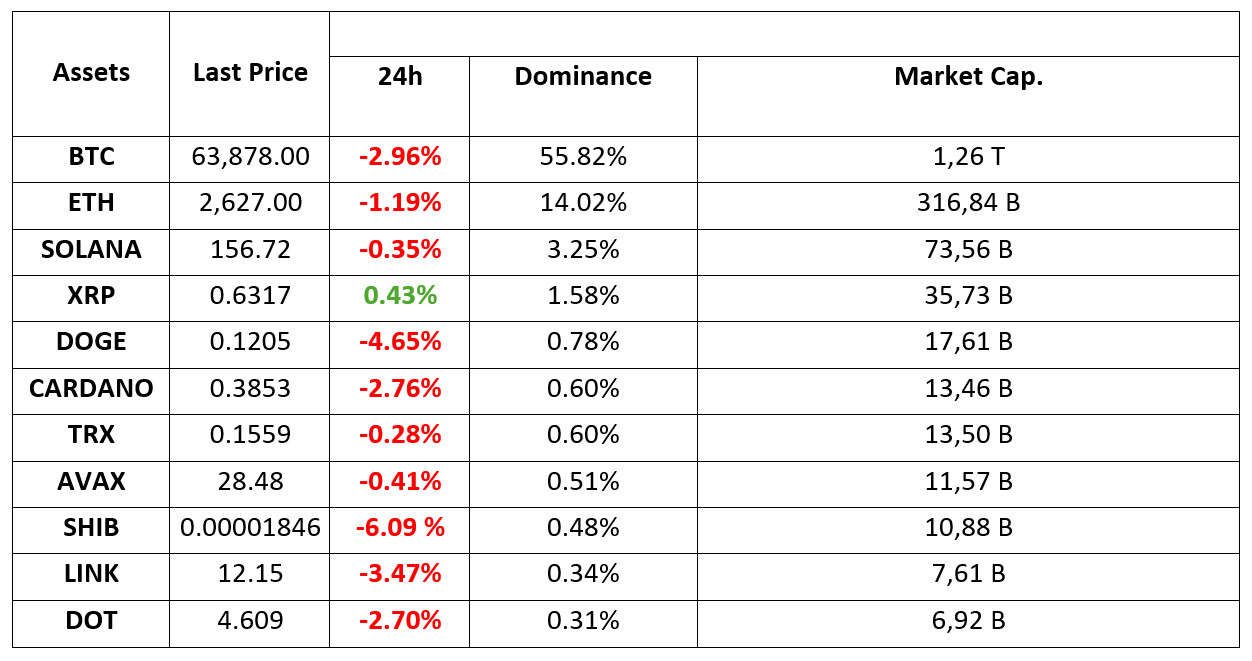
*Prepared on 30.09.2024 at 14:00 (UTC)
WHAT’S LEFT BEHIND
What’s Happening in the Cryptocurrency Market?
The price of Bitcoin fell over 3 percent due to macroeconomic data and geopolitical tensions in the Middle East. This decline triggered panic selling, leading to a liquidation of $200 million in the market. Leading altcoins remained more resilient to this decline.
Bitcoin Focused on Powell’s Speech
Bitcoin and Ethereum fell ahead of Jerome Powell’s speech and non-farm payrolls data. Powell’s messages on inflation and interest rates are expected to affect the markets. Strong employment data may have a positive impact on cryptocurrencies.
Corporates are on a roll!
Crypto asset investment products have seen inflows of 1.2 billion dollars in the last three weeks. While Ethereum is on the rise with inflows of $87 million, altcoins have been mixed. Strong inflows in the US and Switzerland were accompanied by outflows in Germany and Brazil.
HIGHLIGHTS OF THE DAY

INFORMATION:
*The calendar is based on UTC (Coordinated Universal Time) time zone.
The economic calendar content on the relevant page is obtained from reliable news and data providers. The news in the economic calendar content, the date and time of the announcement of the news, possible changes in the previous, expectations and announced figures are made by the data provider institutions. Darkex cannot be held responsible for possible changes that may arise from similar situations.
MARKET COMPASS
Ishiba’s victory in the leadership election of the Liberal Democratic Party in Japan and China’s announcement of new measures that could alleviate the problems in the real estate market were the headlines that dominated the markets in the Asian session. While Europe took over this agenda, it also took into consideration the negative sentiment that came with pessimistic expectations for automaker companies. In line with this, indices on the old continent are negative. US markets also started the day with a slight decline ahead of a series of important macro indicators to be released this week and FED Chair Powell’s speech today.
The positive atmosphere created in recent weeks with the steps taken by central banks to support economies had brought a rise in instrument groups considered to be relatively riskier, such as stocks and digital assets. The new week started more cautiously outside China. After its recent rise, Bitcoin extended its retreat in Asia this morning with European investors and then sought balance. FED Chairman Powell’s statements may be influential on the direction of short-term price changes later in the day.
Ahead of the November 7th rate decision, markets are changing their minds really fast on the size of the Federal Open Market Committee (FOMC) rate cut. Last week, a 50 bps rate cut was seen as more likely, while at the time of writing, according to the CME FedWatch Tool, the markets have a 39% chance of a 50 bps rate cut. A 25 basis point cut is 61% and the balance shifts frequently. This again suggests that markets are not completely unanimous on the FOMC’s next move.
Powell’s Speech
Later in the day, markets will focus on Powell. Although the chairman is not expected to say anything clear about the size of the next rate cut, investors will try to catch clues on this issue. Powell, who will also evaluate the health of the US economy and the latest data, is expected to answer questions from the participants. So it is a development that should be closely monitored for the markets.
We do not expect Powell to clarify the next step for the markets. However, we should not ignore the phrase “the Fed Chairman’s speech is always important”. Any message about the next interest rate change step or the next course could shape pricing behavior. The most favorable scenario would be that the US economy avoids a recession, and interest rates will continue to be cut at a rapid pace. Statements that could create a similar perception could be bullish for digital assets. A similar tone could also be set if the President only sheds light on a new “Jumbo” rate cut for the November 7 meeting. We think that any other outcome (on the positive side) will not cause a re-pricing in the markets. Considering the Chairman’s recent statements and stance, we anticipate that he will try to avoid a statement that will be perceived negatively. Nevertheless, it would be useful to consider the potential negative impact of any new catalyst from Powell.
TECHNICAL ANALYSIS
BTC/USDT
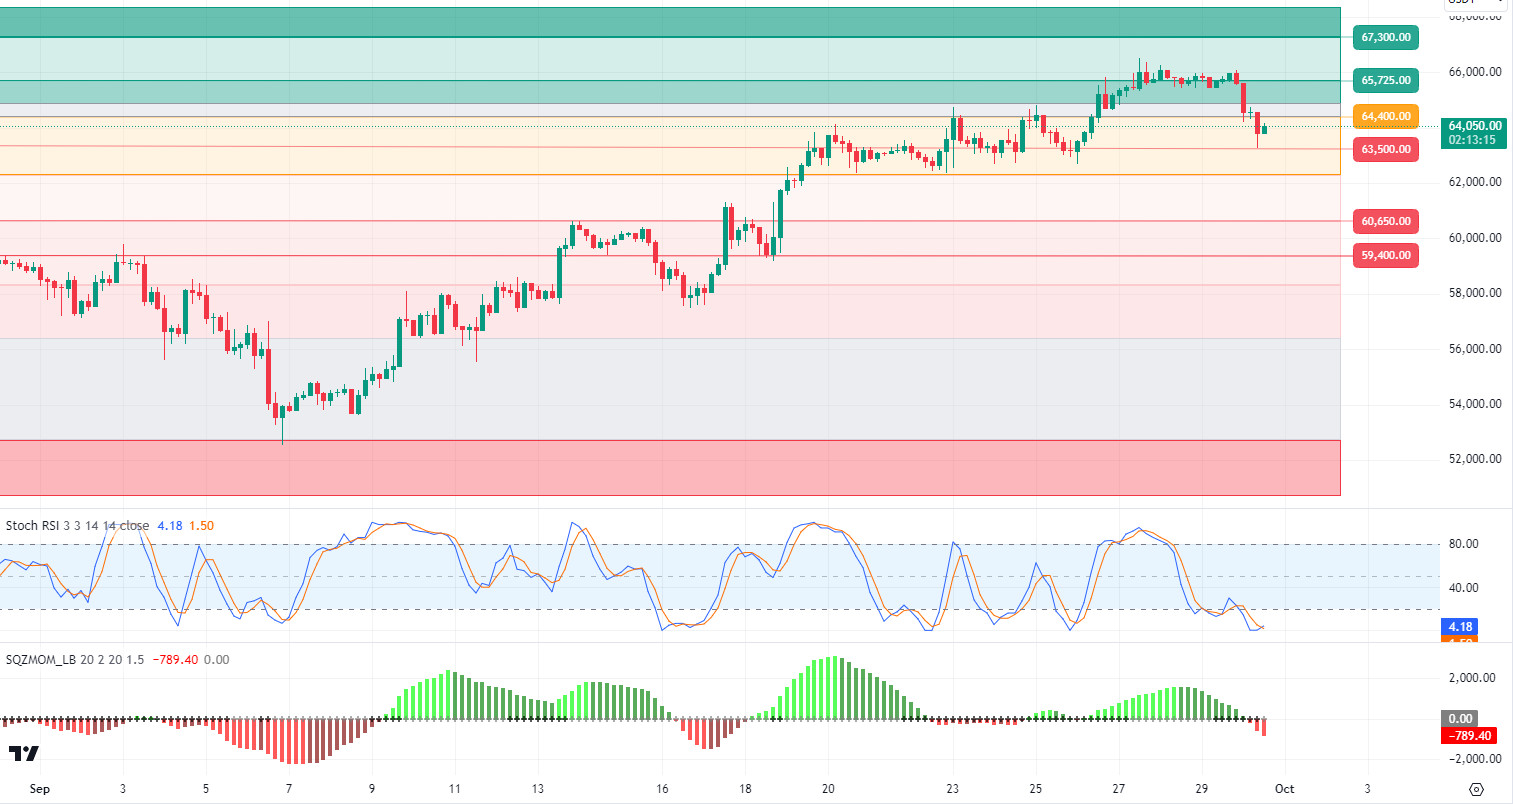
Crypto market is waiting for Powell! Bitcoin Last week, the US personal consumption expenditure (PCE) data, which fell below expectations, and China’s strong stimulus measures to stimulate its economy pushed Bitcoin up to 66,000. Bitcoin, which moved in a horizontal course over the weekend, gave way to a decline on the first day of the week and fell to 63,500 levels. Today, we should pay attention to Powell’s messages on inflation and interest rates, as well as the unemployment rates to be announced on Friday. We can expect these developments to increase volatility on the crypto market and Bitcoin, and if unemployment rates come in strong, it could have a positive impact on the market. In the 4-hour technical analysis of BTC, the price has turned down from the 64,400 level. In case the pullback deepens, the first minor support point that could be encountered is 63,500. The 64,400 resistance level could be retested as the RSI, our technical indicator, reverses its direction upwards after hitting the oversold zone.
Supports 64,400 – 62,300 – 60,650
Resistances 65,725 – 67,300 – 68,350
ETH/USDT
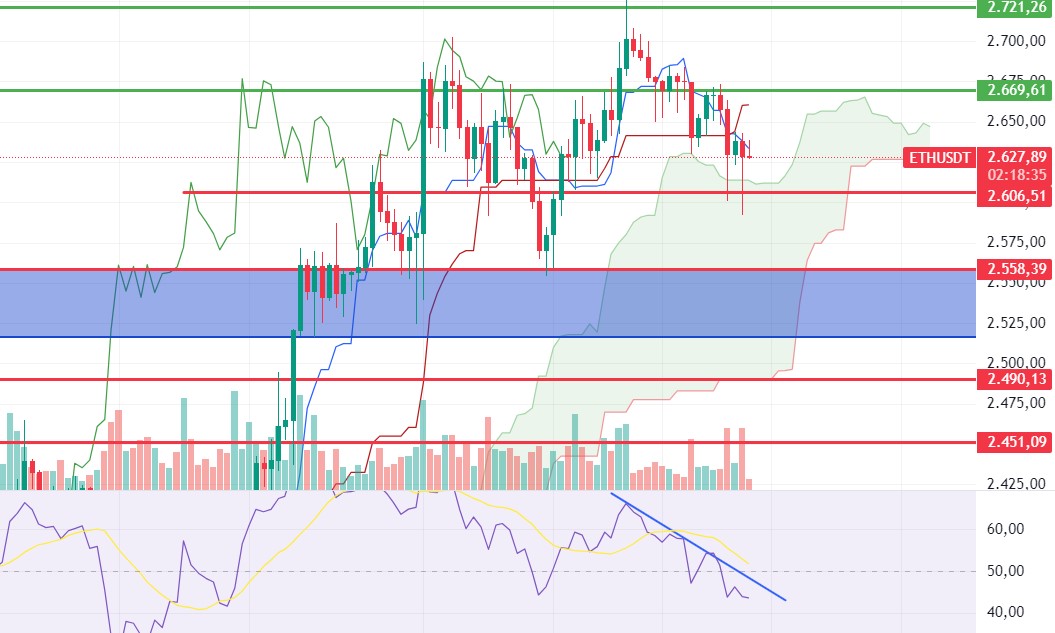
As expected in the morning, Ethereum, which continued the correction and fell to 2.606 and below, continues to price above the kumo cloud level again with the reaction it received from this region. However, it is seen that the sell signal in ichimoku and the negative structure in RSI continue. In this context, it can be expected to make its 3rd attempt below 2.606 during the day. With the break of 2,606, declines may come down to 2,558. The 2,669 level maintains its main resistance position.
Supports 2,606 – 2,558 – 2,490
Resistances 2,669 – 2,721 – 2,815
LINK/USDT
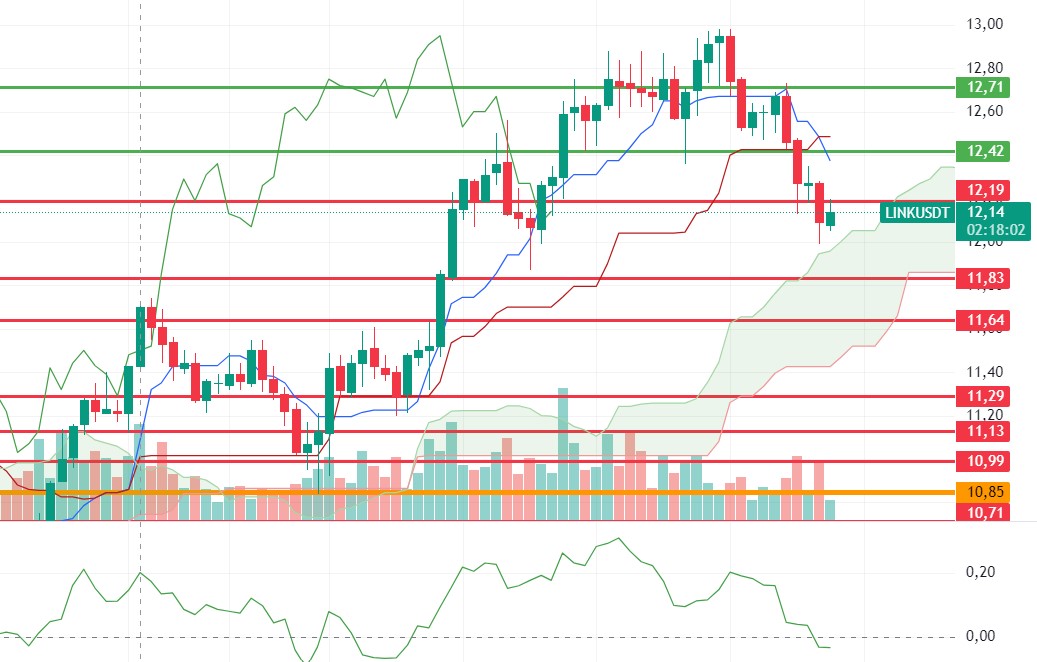
LINK, which fell below 12.19, is trying to regain this level as the market generally reacts. Seeing the decline in CMF and the decrease in volume can be interpreted as continuing the search for the bottom. In a possible correction, the 11.83 region can be targeted. Re-permanence above the 12.19 level may bring rises towards 12.42 and 12.71 levels respectively.
Supports 11.83 – 11.64 – 11.29
Resistances 12.19 – 12.42 – 12.71
SOL/USDT
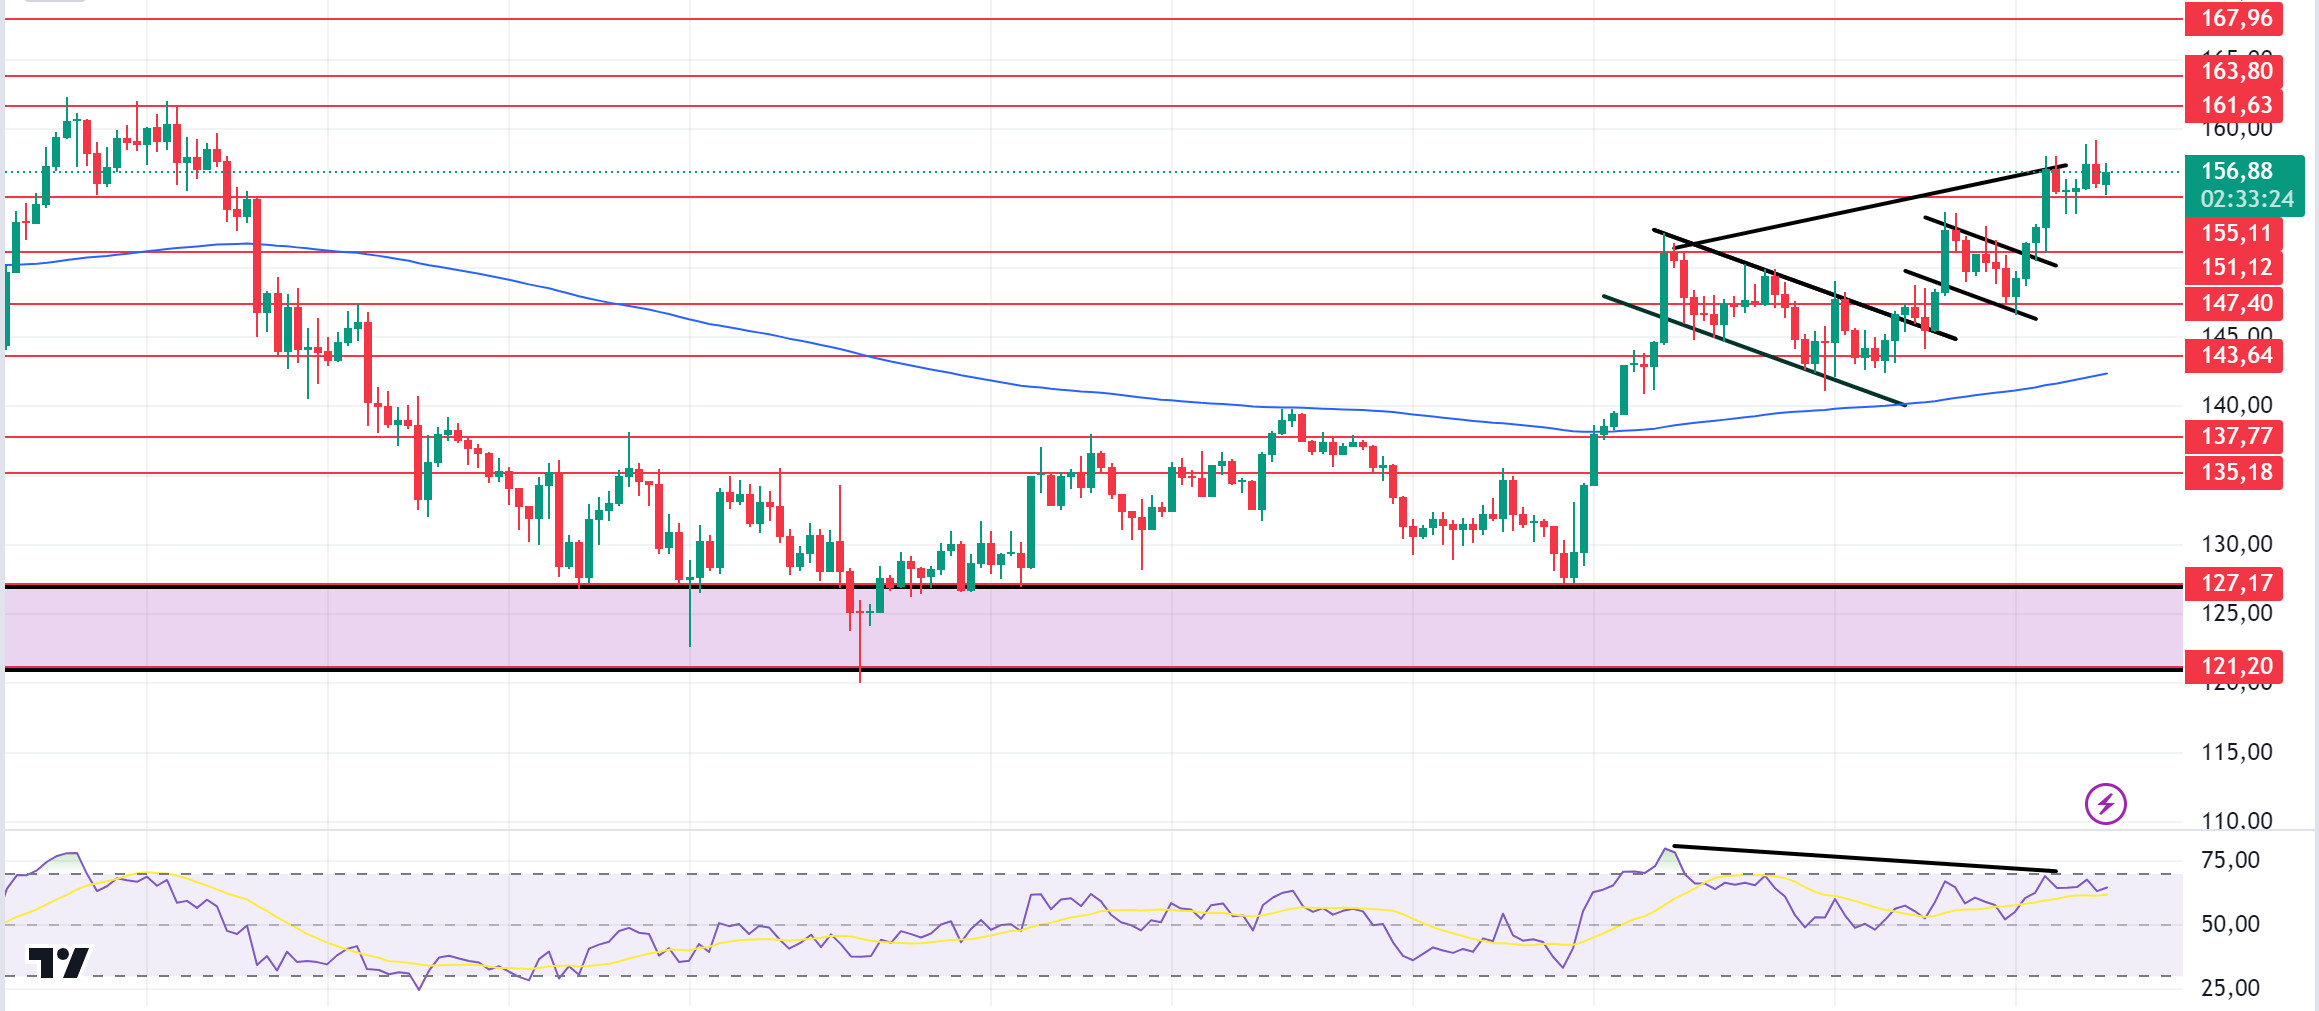
FED Chairman Powell’s meeting should be followed today. He is expected to declare that the interest rate cut may continue. This may also cause volume in cryptocurrencies . The price, which has been flat since our analysis in the morning, could not break the support level of 155.11. When we look at the 4-hour rsi (14) indicator, there is a mismatch. This may mean that the pullbacks will deepen. In the rises driven by both macroeconomic conditions and innovations in the Solana ecosystem, 161.63 – 163.80 levels appear as resistance. If it rises above these levels, the rise may continue. If investors continue profit sales, support levels of 155.11 – 151.12 should be followed in the retracements. If it comes to these support levels, it may create a potential bullish opportunity.
Supports 155.11 – 151.12 – 147.40
Resistances 161.63 – 163.80 – 167.96
ADA/USDT
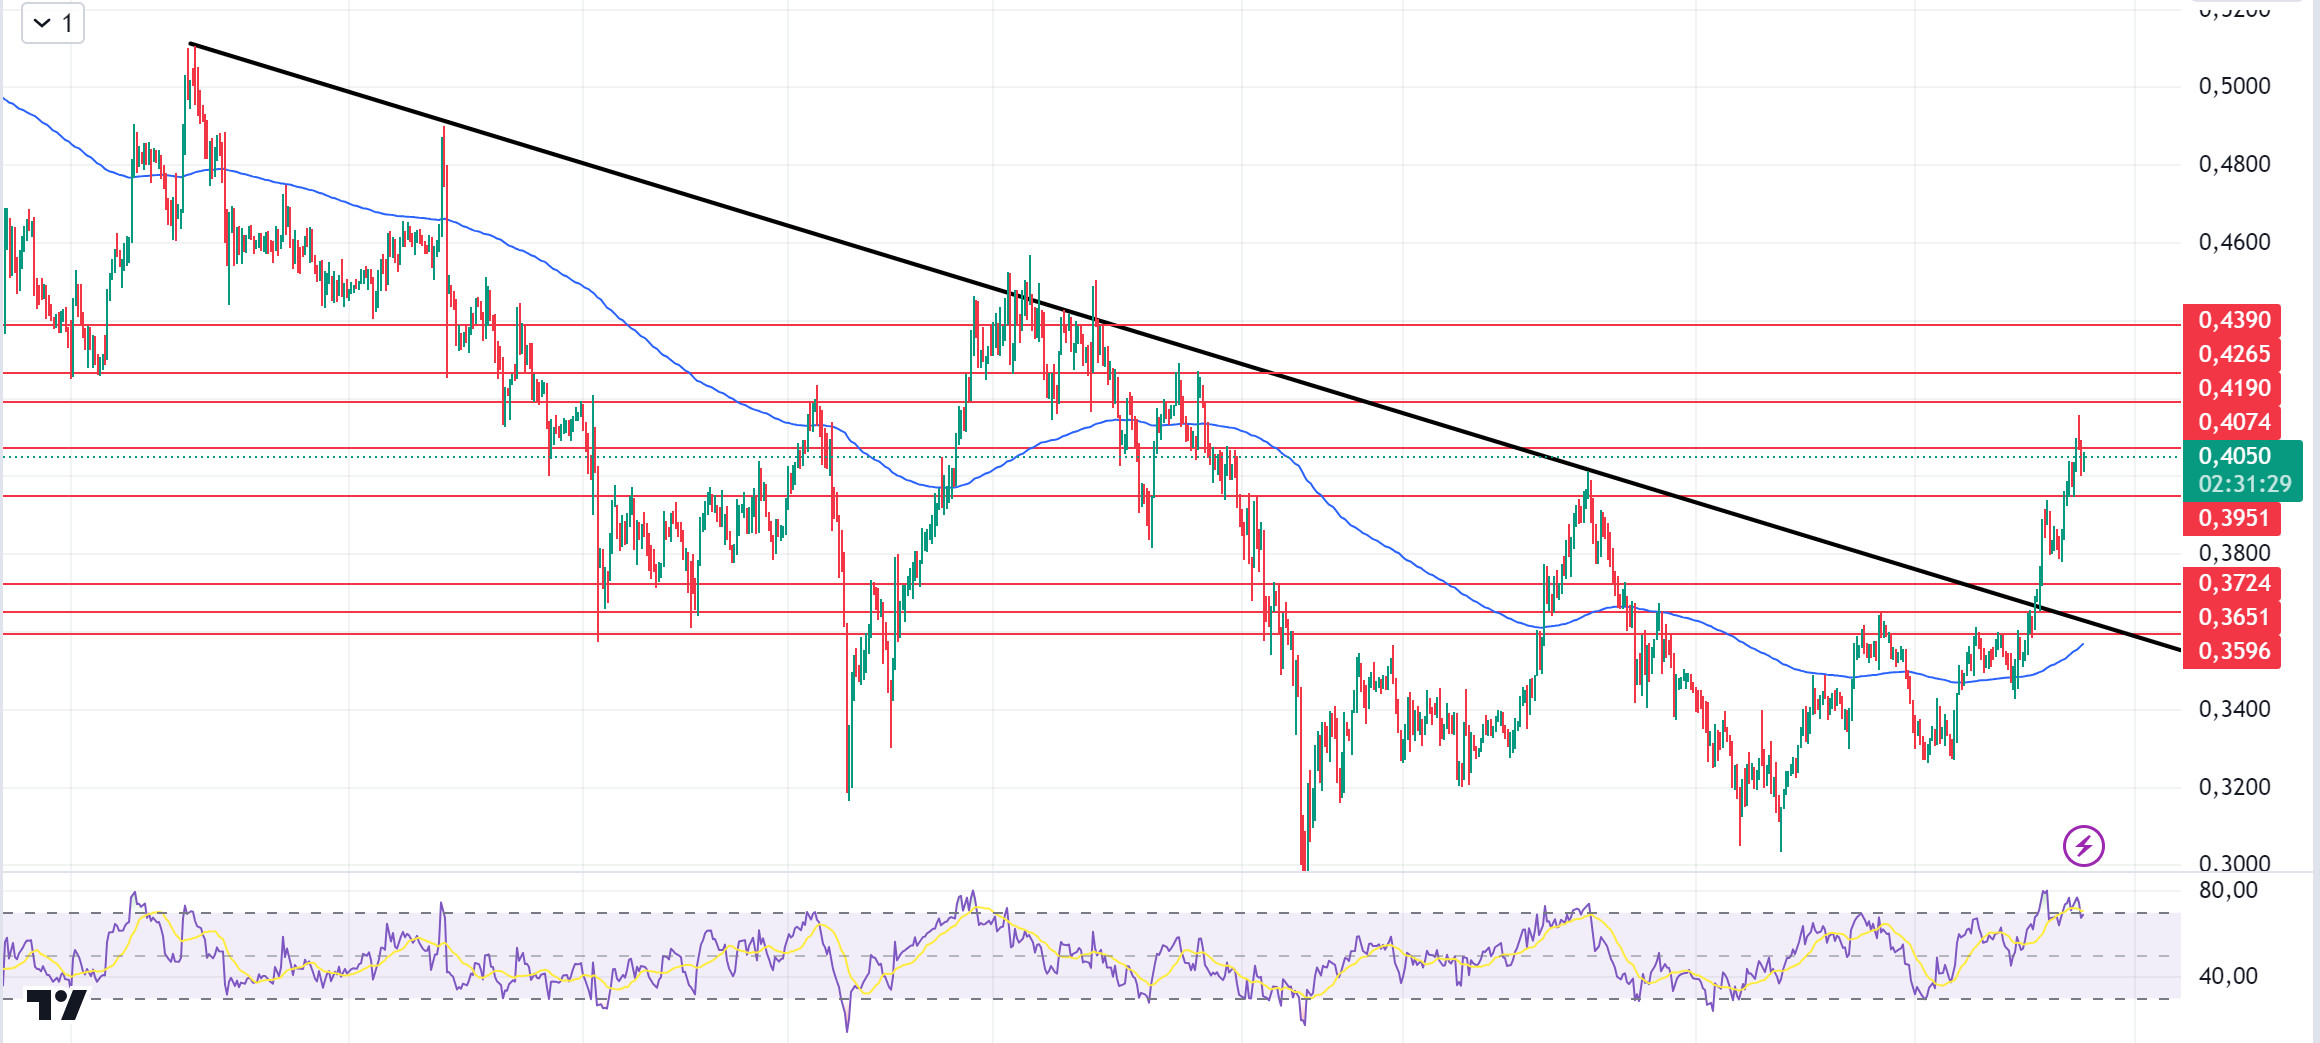
FED Chairman Powell’s meeting should be followed today. He is expected to declare that the interest rate cut may continue. This may also cause volume in cryptocurrencies. In the Cardano ecosystem, developer Vladimir Kalnitsky, who played an important role, announced that he left the project. Kalnitsky stated that Cardano has gained experience in the PureScript ecosystem, but has now lost interest in functional programming, especially Haskell. From a technical point of view, it is priced at 0.3834 support, accompanying the slight retreat of the general market since our morning analysis. On the other hand, breaking the resistance of the downtrend that has been going on since April 22nd signaled a potential uptrend. It tested the resistance place of the downtrend it broke as support and fell below the resistance place again. This could deepen the decline. ADA, which last saw these levels on July 29, 0.3834 – 0.3724 levels appear as a strong support in retracements due to possible profit sales. In the rises that will take place with the continuation of macro-economic data or the positive atmosphere in the ecosystem, the level of 0.3951 can be followed as resistance.
Supports 0.3834 – 0.3724 – 0.3651
Resistances 0.3951 – 0.4074 – 0.4190
AVAX/USDT
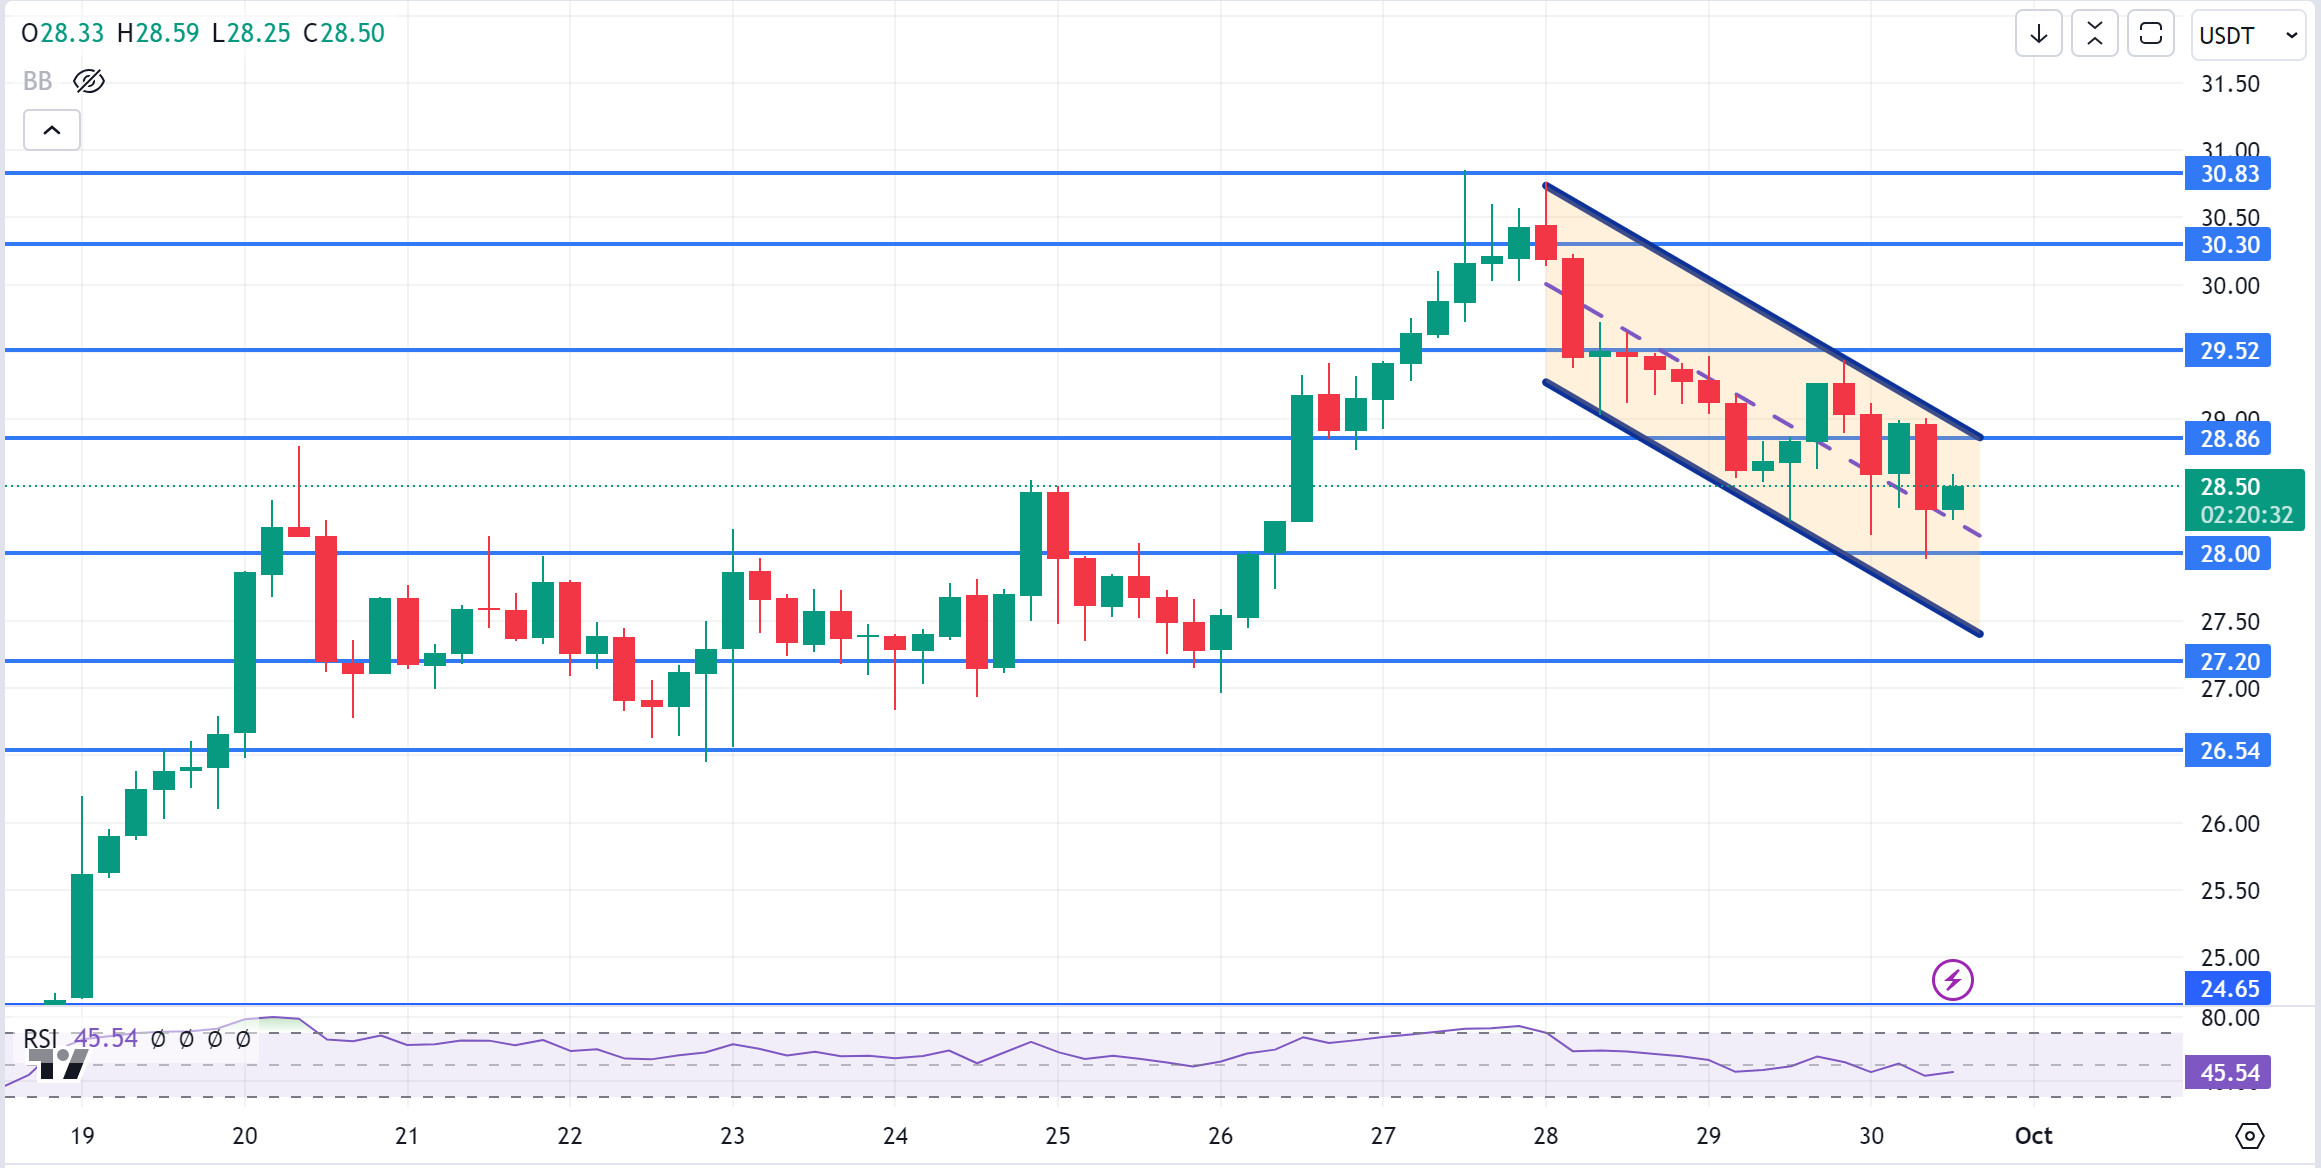
AVAX, which opened today at 29.04, is trading at 28.50, down about 2% before FED chair Powell’s speech.
On the 4-hour chart, it moves within the falling channel. The RSI is in the middle band of the falling channel with a value of 45 and may want to go to the upper band by making some rise from these levels. In such a case, it can be expected to test the 28.86 resistance. Above 28.86 resistance, it cannot close the candle and if selling pressure comes, it may move to the lower band of the channel. In such a case, it may test 28.00 support. As long as it stays above 24.65 support during the day, the desire to rise may continue. With the break of 24.65 support, sales may increase.
Supports 28.00 – 27.20 – 26.54
Resistances 28.86 – 29.52 – 30.30
TRX/USDT
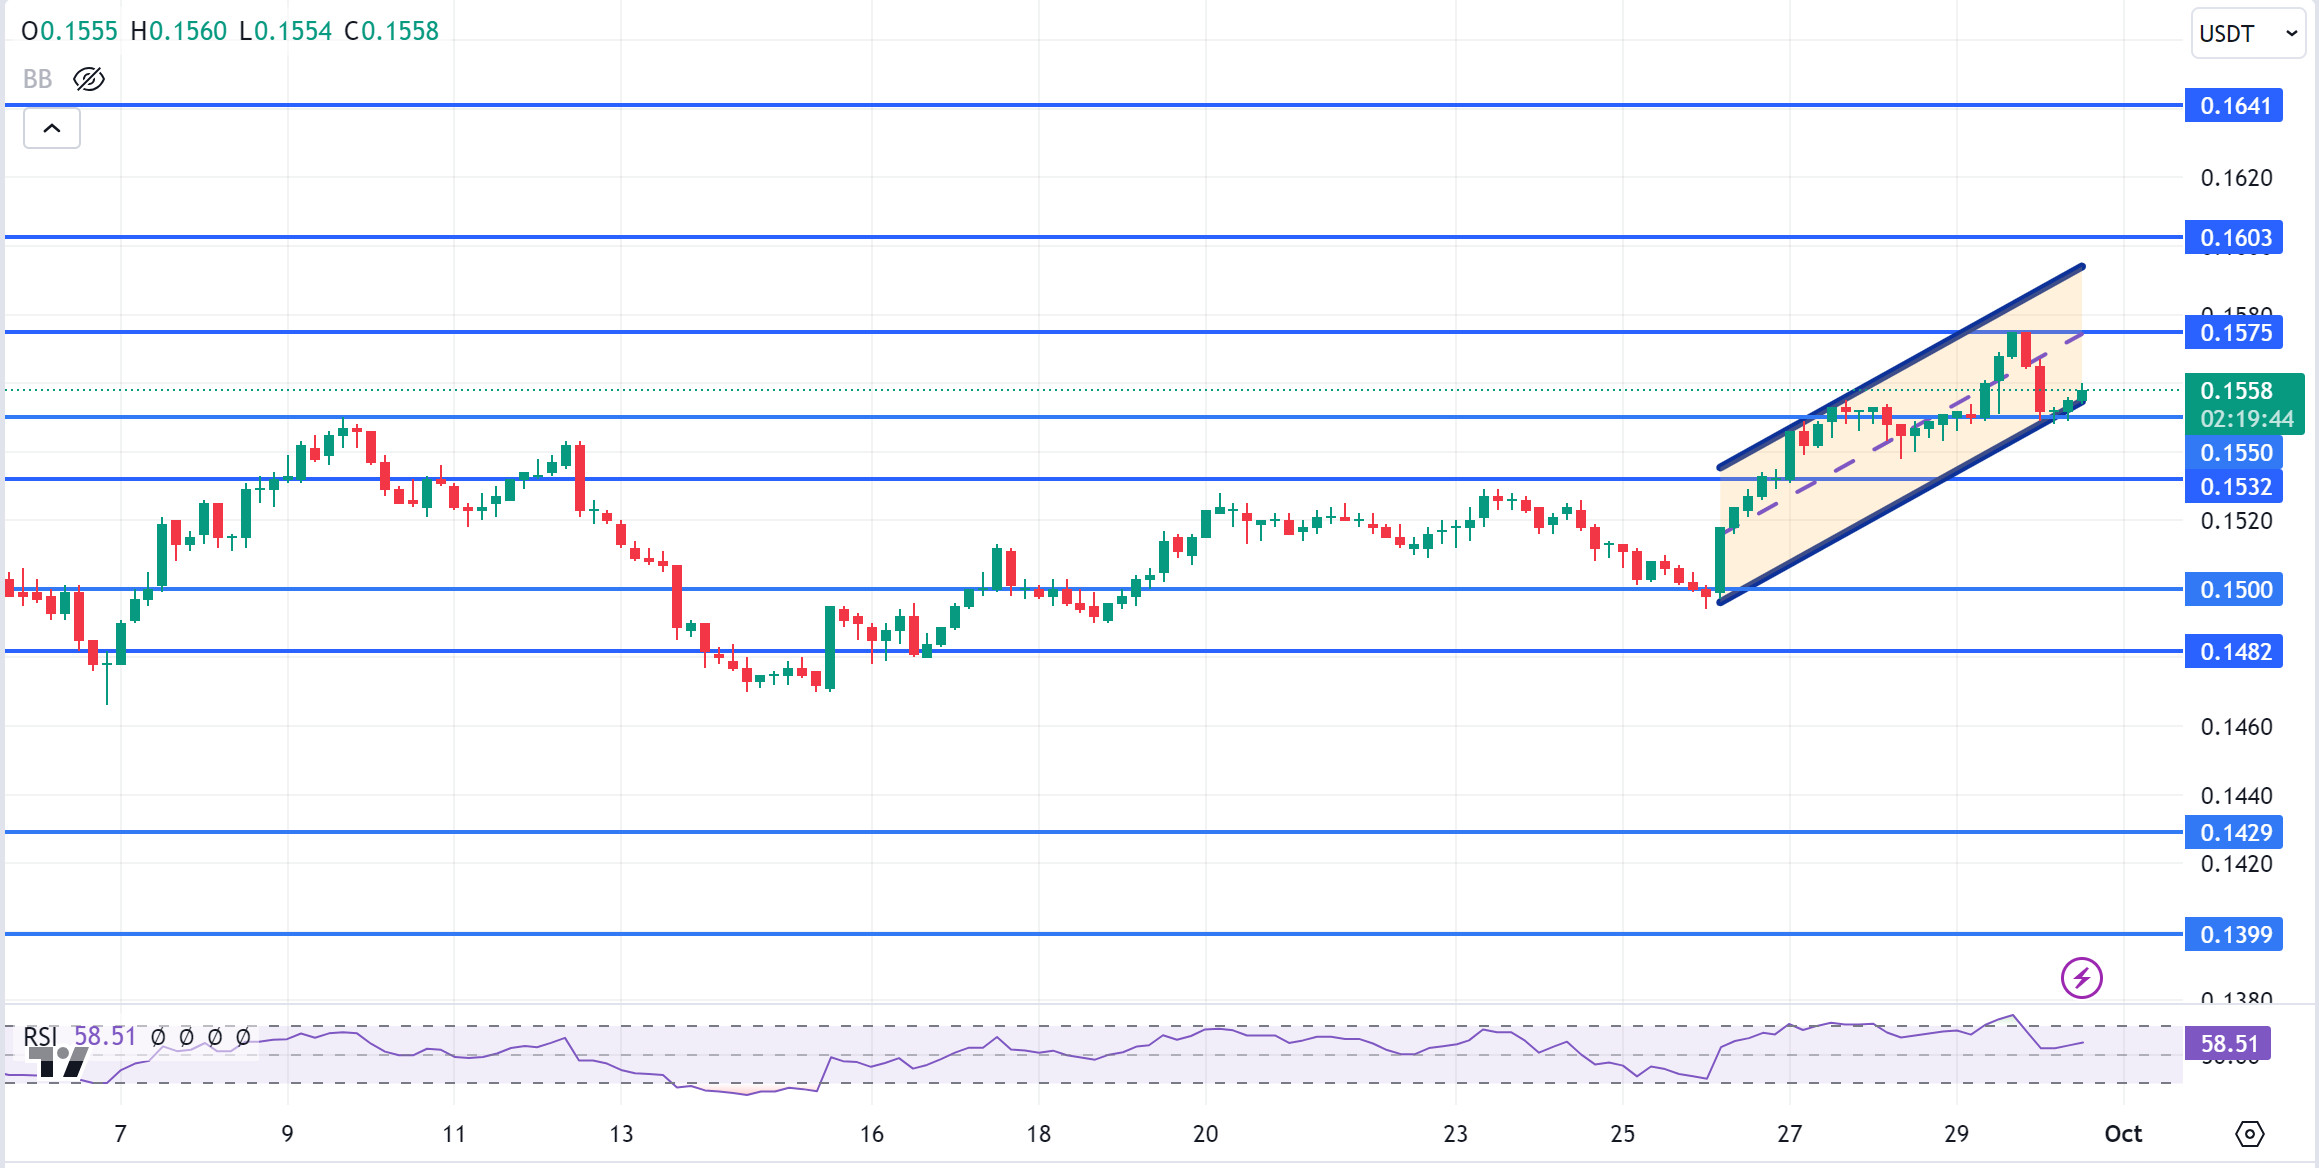
TRX, which started yesterday at 0.1550, rose 1% during the day and is trading at 0.1558. We may continue to see low volume and limited movements until FED chair Powell’s speech today.
On the 4-hour chart, it tries to break the rising channel downwards. With the RSI 58 value, it can be expected to move to the middle band of the channel with the buying reaction from the lower band of the channel. In such a case, it may test 0.1575 resistance. If it breaks the channel lower band downwards and closes the candle under 0.1550 support, it may test 0.1532 support. TRX may continue to be bullish as long as it stays above 0.1482 support. If this support is broken downwards, sales can be expected to increase.
Supports 0.1559 – 0.1532 – 0.1500
Resistances 0.1575 – 0.1603 – 0.1641
XRP/USDT
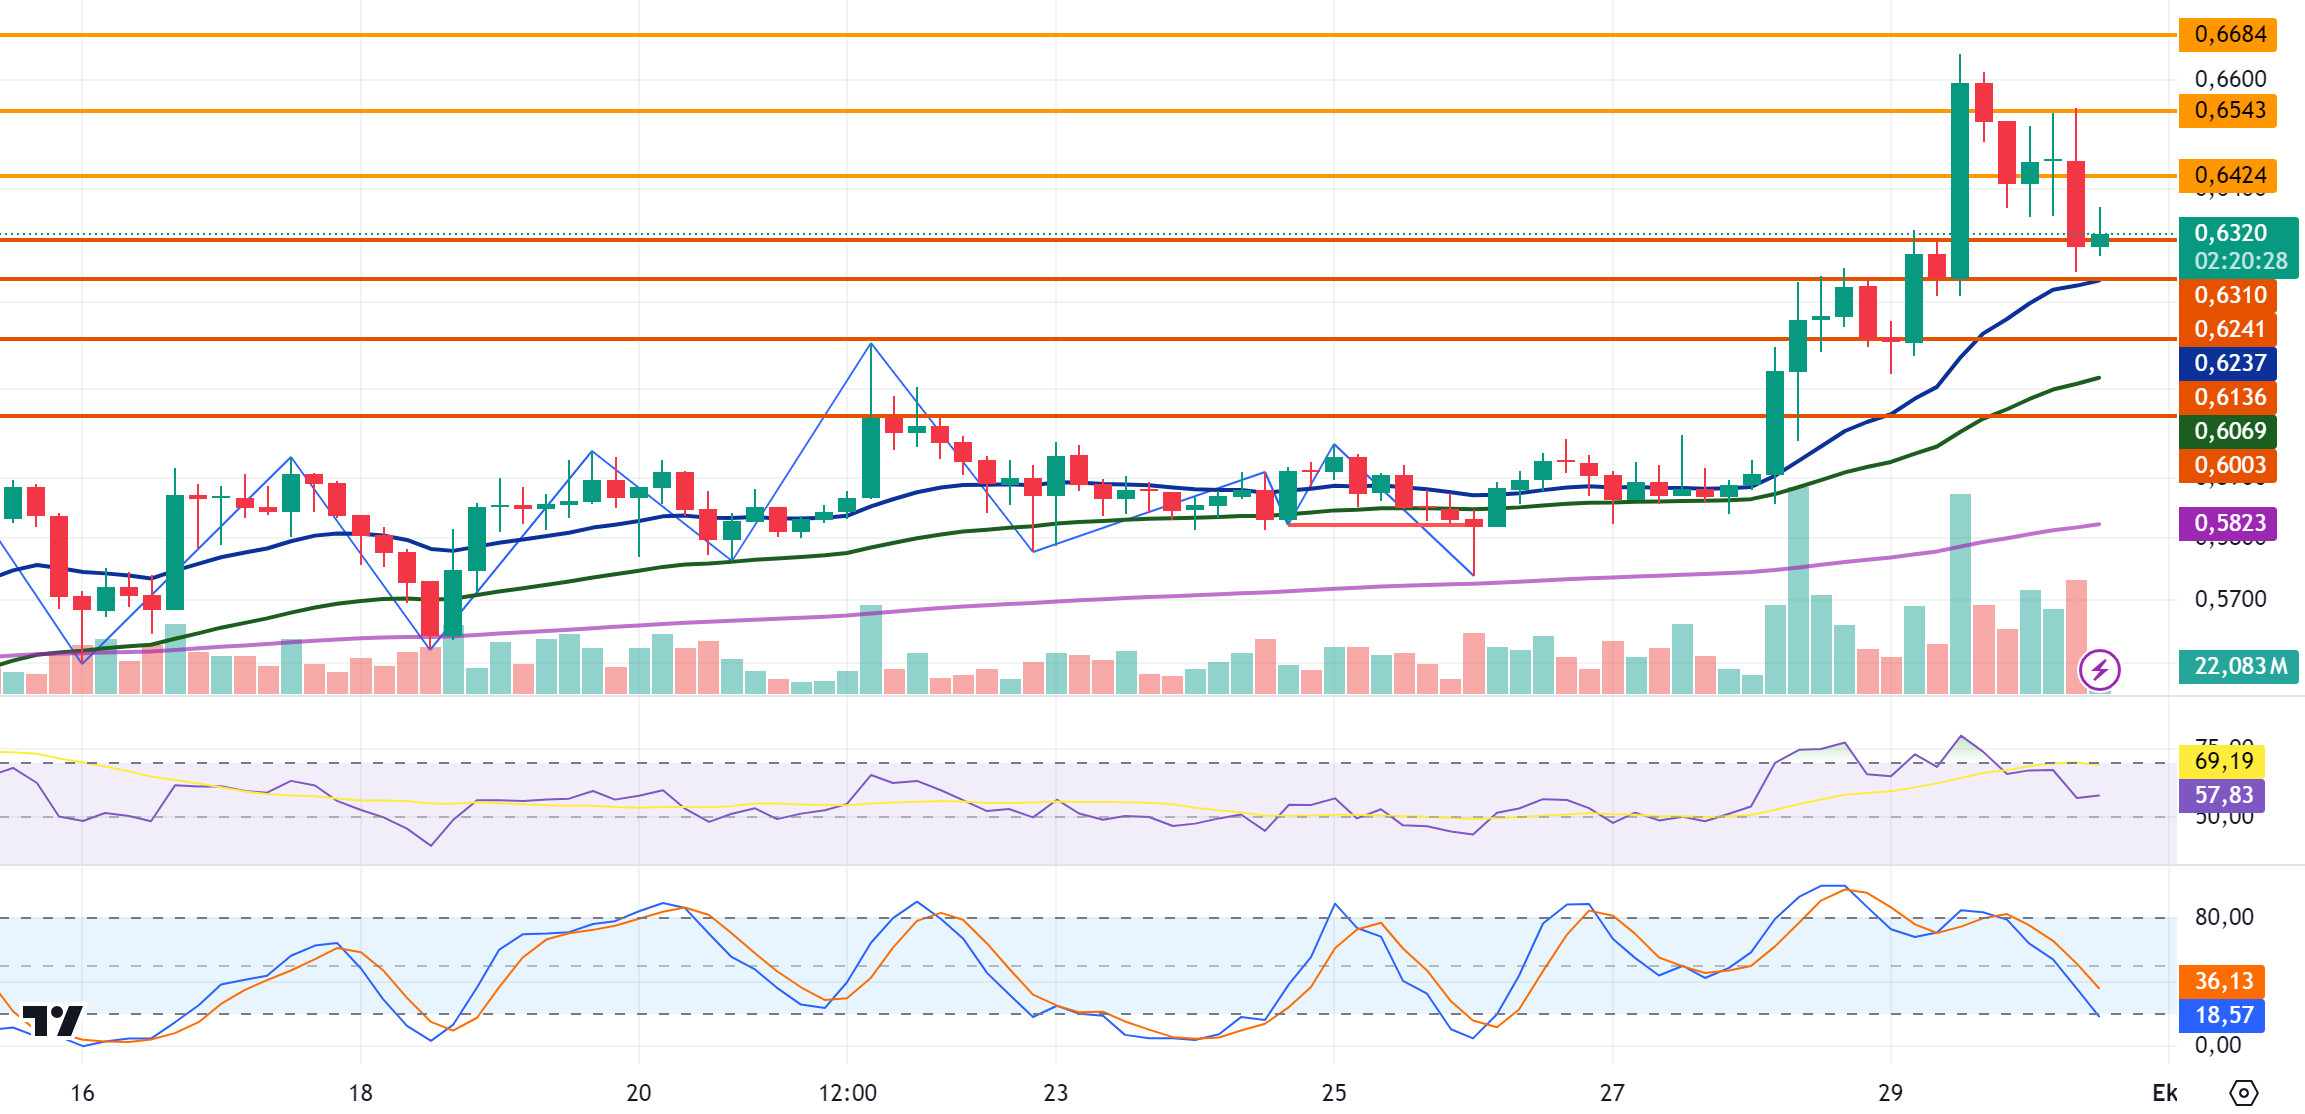
After starting today at 0.6412, XRP fell again after rising on the opening candle in the 4-hour analysis and is currently trading at 0.6320. XRP has risen on the last candle with purchases at the EMA20 and 0.6241 support level in today’s decline. If the rise continues, it may test the resistance levels of 0.6424-0.6543-0.6684. If the decline experienced today continues, it may test the support levels of 0.6310-0.6241-0.6136.
Until October 7, before the SEC’s decision, XRP may rise and fall sharply due to the high volatility. If the decline in XRP continues today, it may offer a long trading opportunity with purchases that may come at the EMA20 level. In case of a close below the EMA20 level in the 4-hour analysis, the decline may deepen and offer a short trading opportunity.
EMA20 (Blue Line) – EMA50 (Green Line) – EMA200 (Purple Line)
Supports 0. 6310 – 0. 6241 – 0.6136
Resistances 0.6424 – 0.6 543 – 0.6684
DOGE/USDT
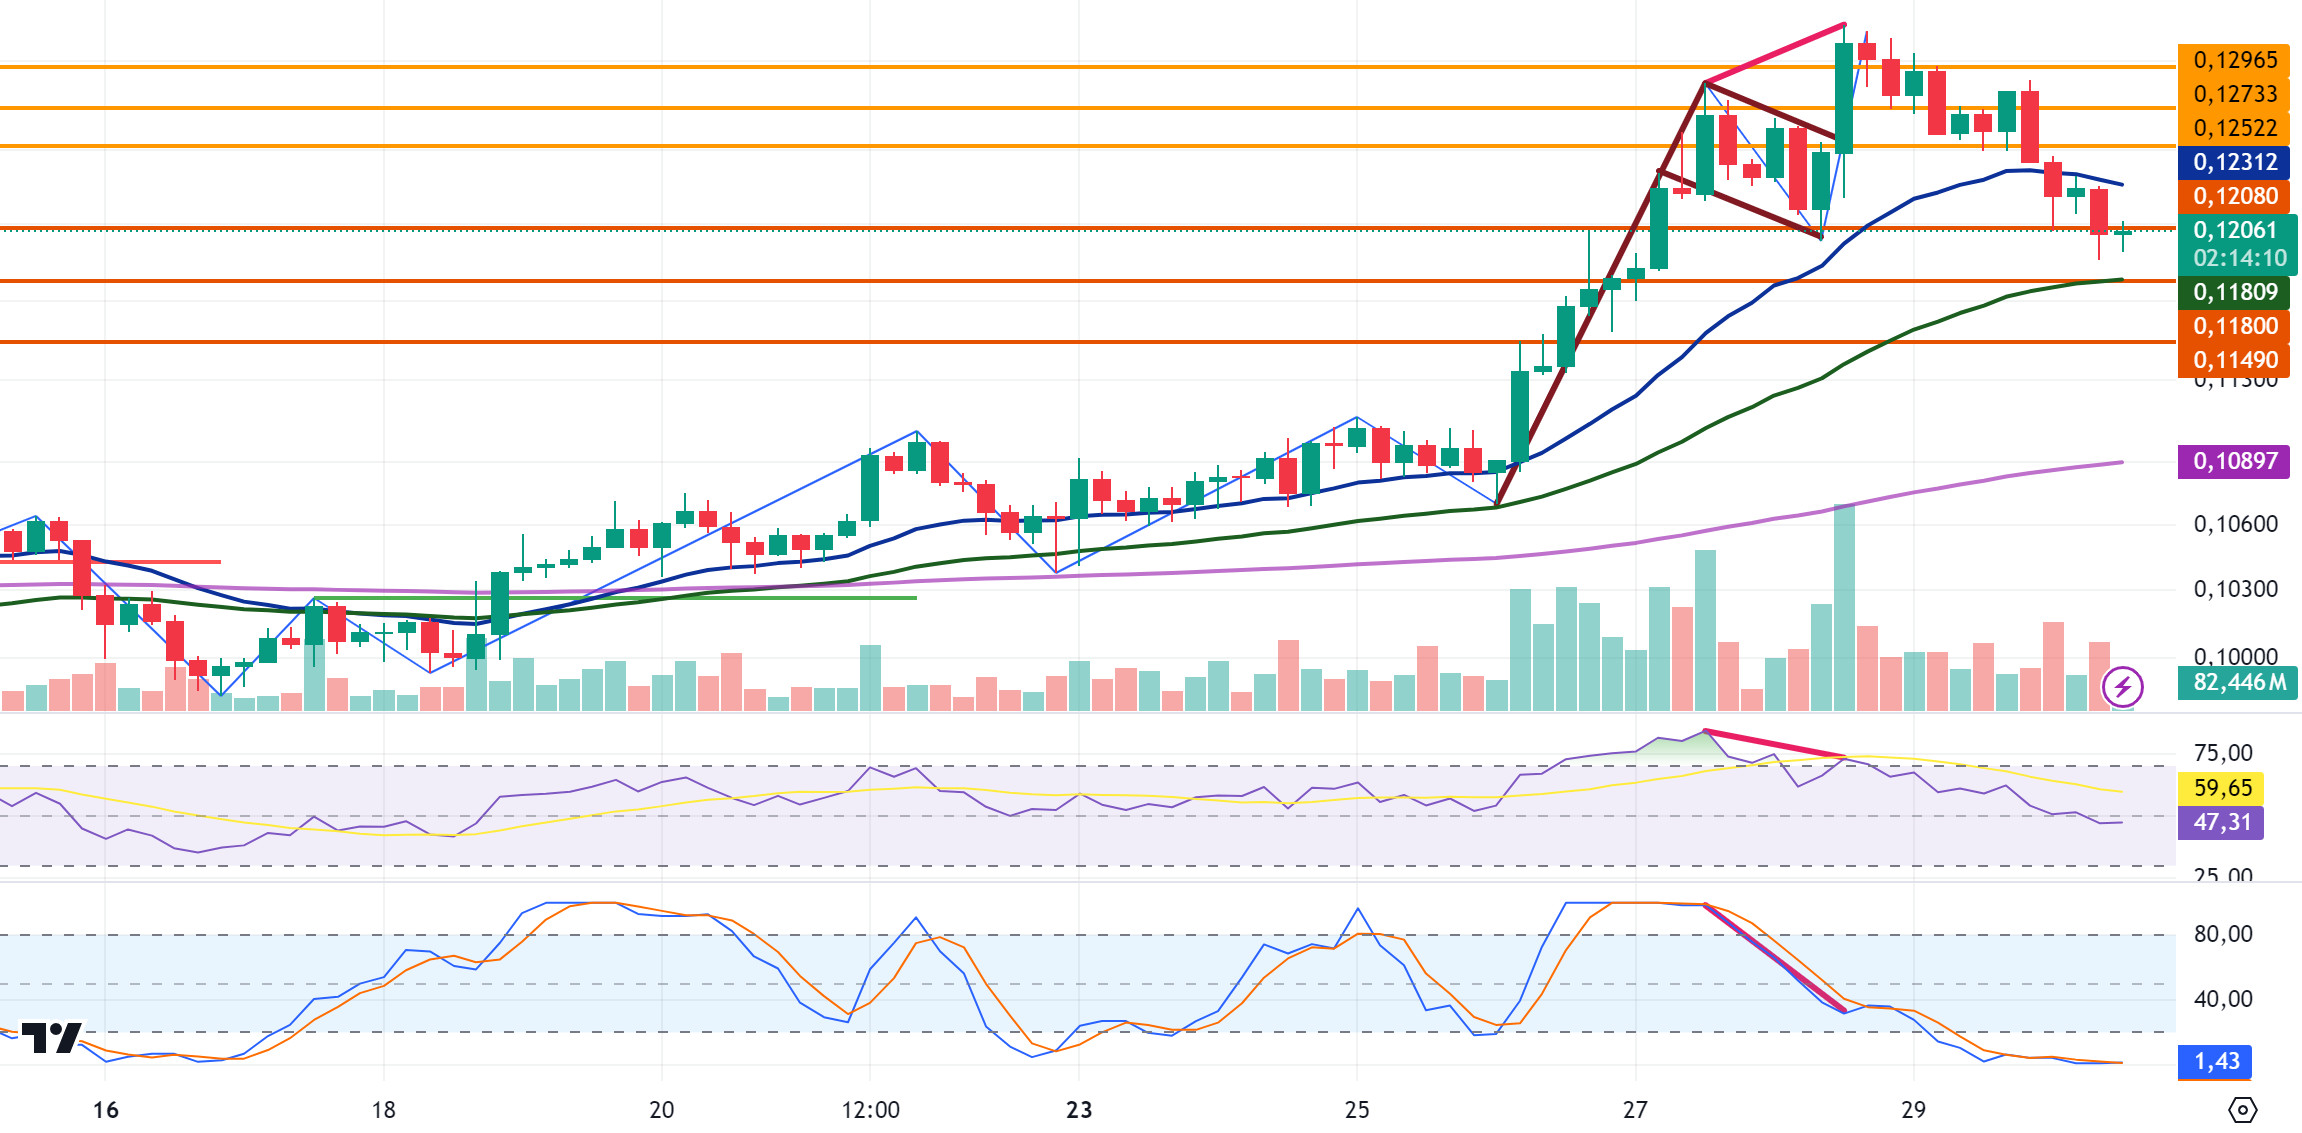
In the 4-hour analysis, after starting today at 0.1243 with a 3% depreciation in the last candle yesterday, the decline continued and is currently trading at 0.1206. If the decline in DOGE continues, the EMA50 and 0.1180 support levels come to the fore. If these support levels are broken, it may test the 0.1149 support level with the continuation of the decline. If the decline is replaced by an uptrend, it may test the EMA20 and 0.1252 resistance levels in its rise, and if these resistance levels are broken, it may test the 0.1275-0.1296 resistance levels in the continuation of the rise.
DOGE may rise with the purchases that may come from the EMA50 level in its decline and may offer a long trading opportunity. In case of a candle close below the EMA50 level, the decline may deepen and offer a short trading opportunity.
EMA20 (Blue Line) – EMA50 (Green Line) – EMA200 (Purple Line)
Supports 0.1208 – 0.1180 – 0.1149
Resistances 0.1 252- 0.1275 – 0.1296
DOT/USDT
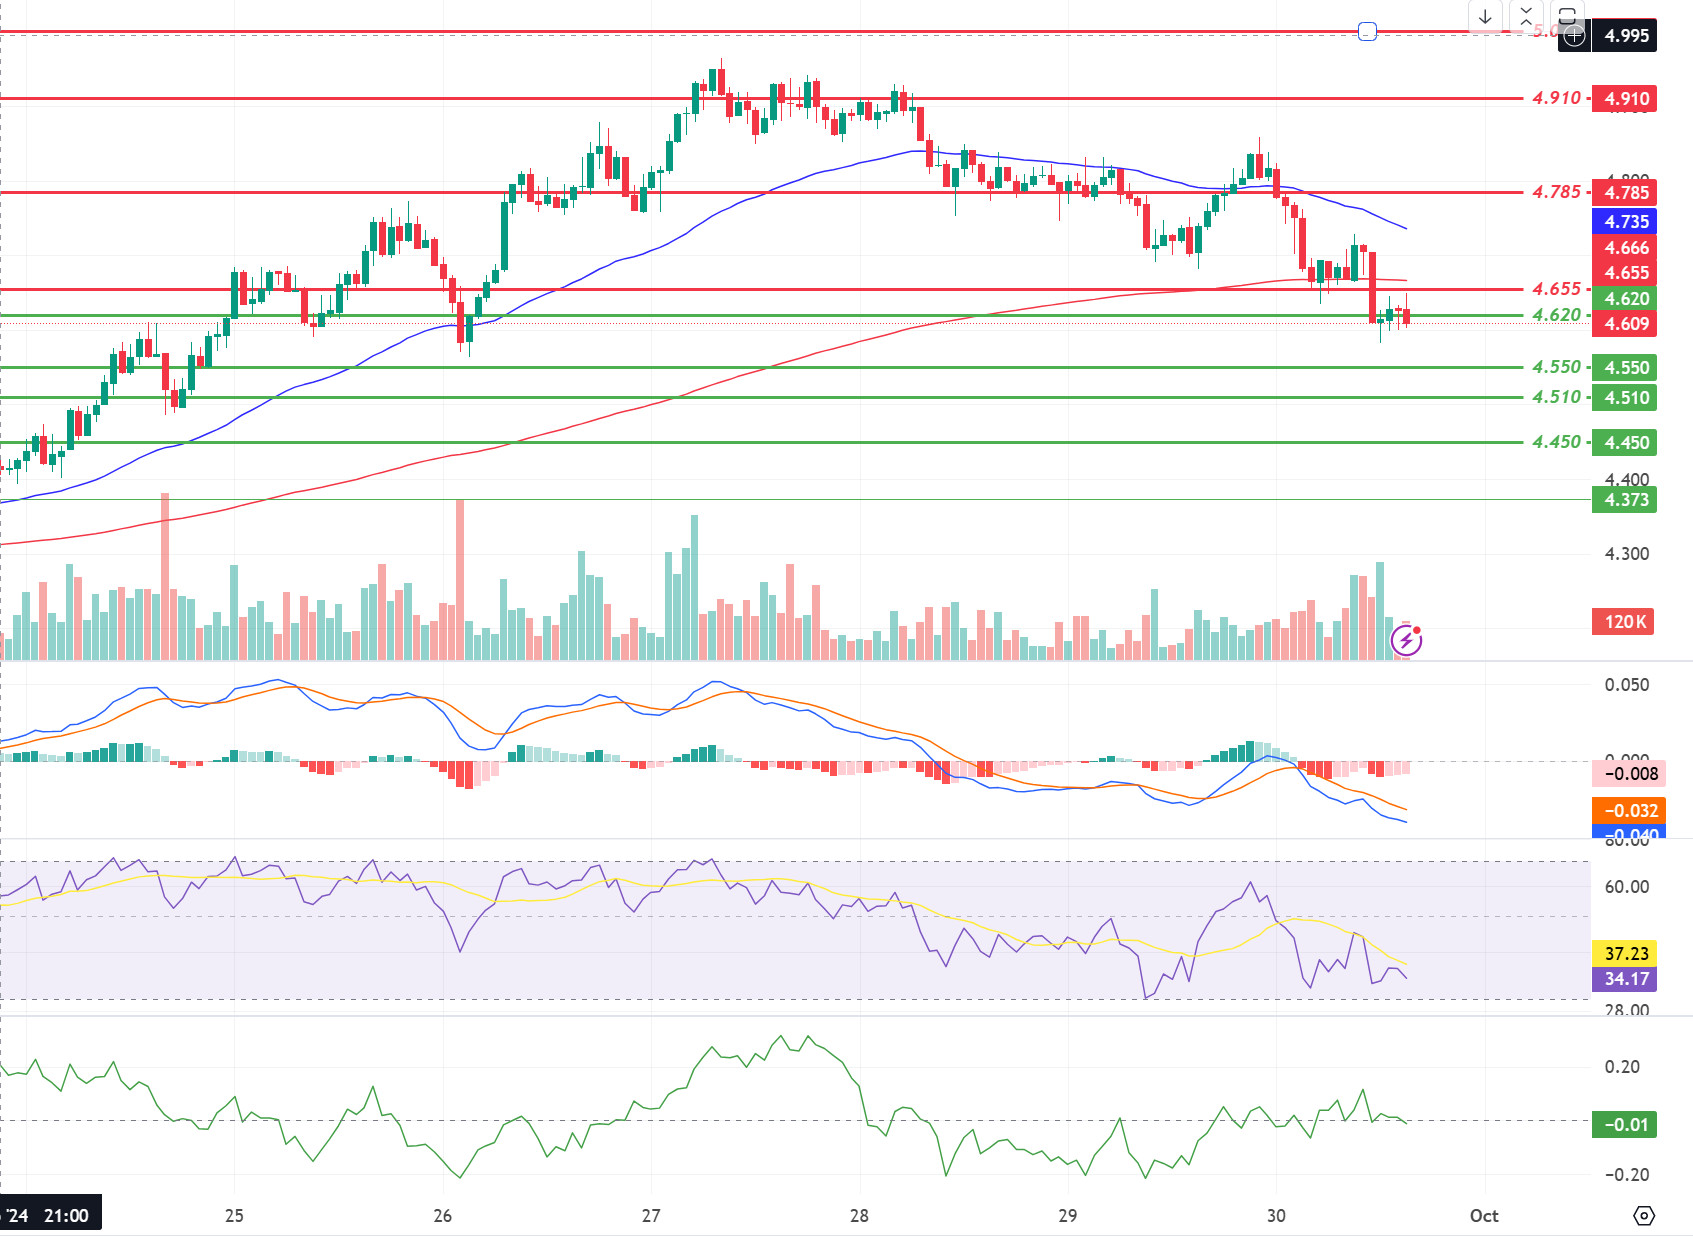
On the Polkadot (DOT) chart, the price fell to 4,620 levels after losing the EMA200 level down. If the price does not get a reaction from 4,620 levels, it may fall to the next support level of 4,550 levels. When we examine the MACD oscillator, we see that the selling pressure decreased compared to the previous hour. Accordingly, if the price rises above the EMA200 level again with the decrease in selling pressure, its next target may be 4,785 levels.
(Blue line: EMA50, Red line: EMA200)
Supports 4,620 – 4,555 – 4,510
Resistances 4.655 – 4.785 – 4.910
SHIB/USDT
Shiba Inu’s layer-2 solution Shibarium reached a significant milestone, surpassing 7 million blocks on the mainnet. The total number of transactions increased to 418 million, while wallet addresses surpassed 1.8 million. However, the number of daily transactions decreased from 11,230 to 3,190. While the Shiba Inu team continues to announce new projects, future growth projections remain uncertain.
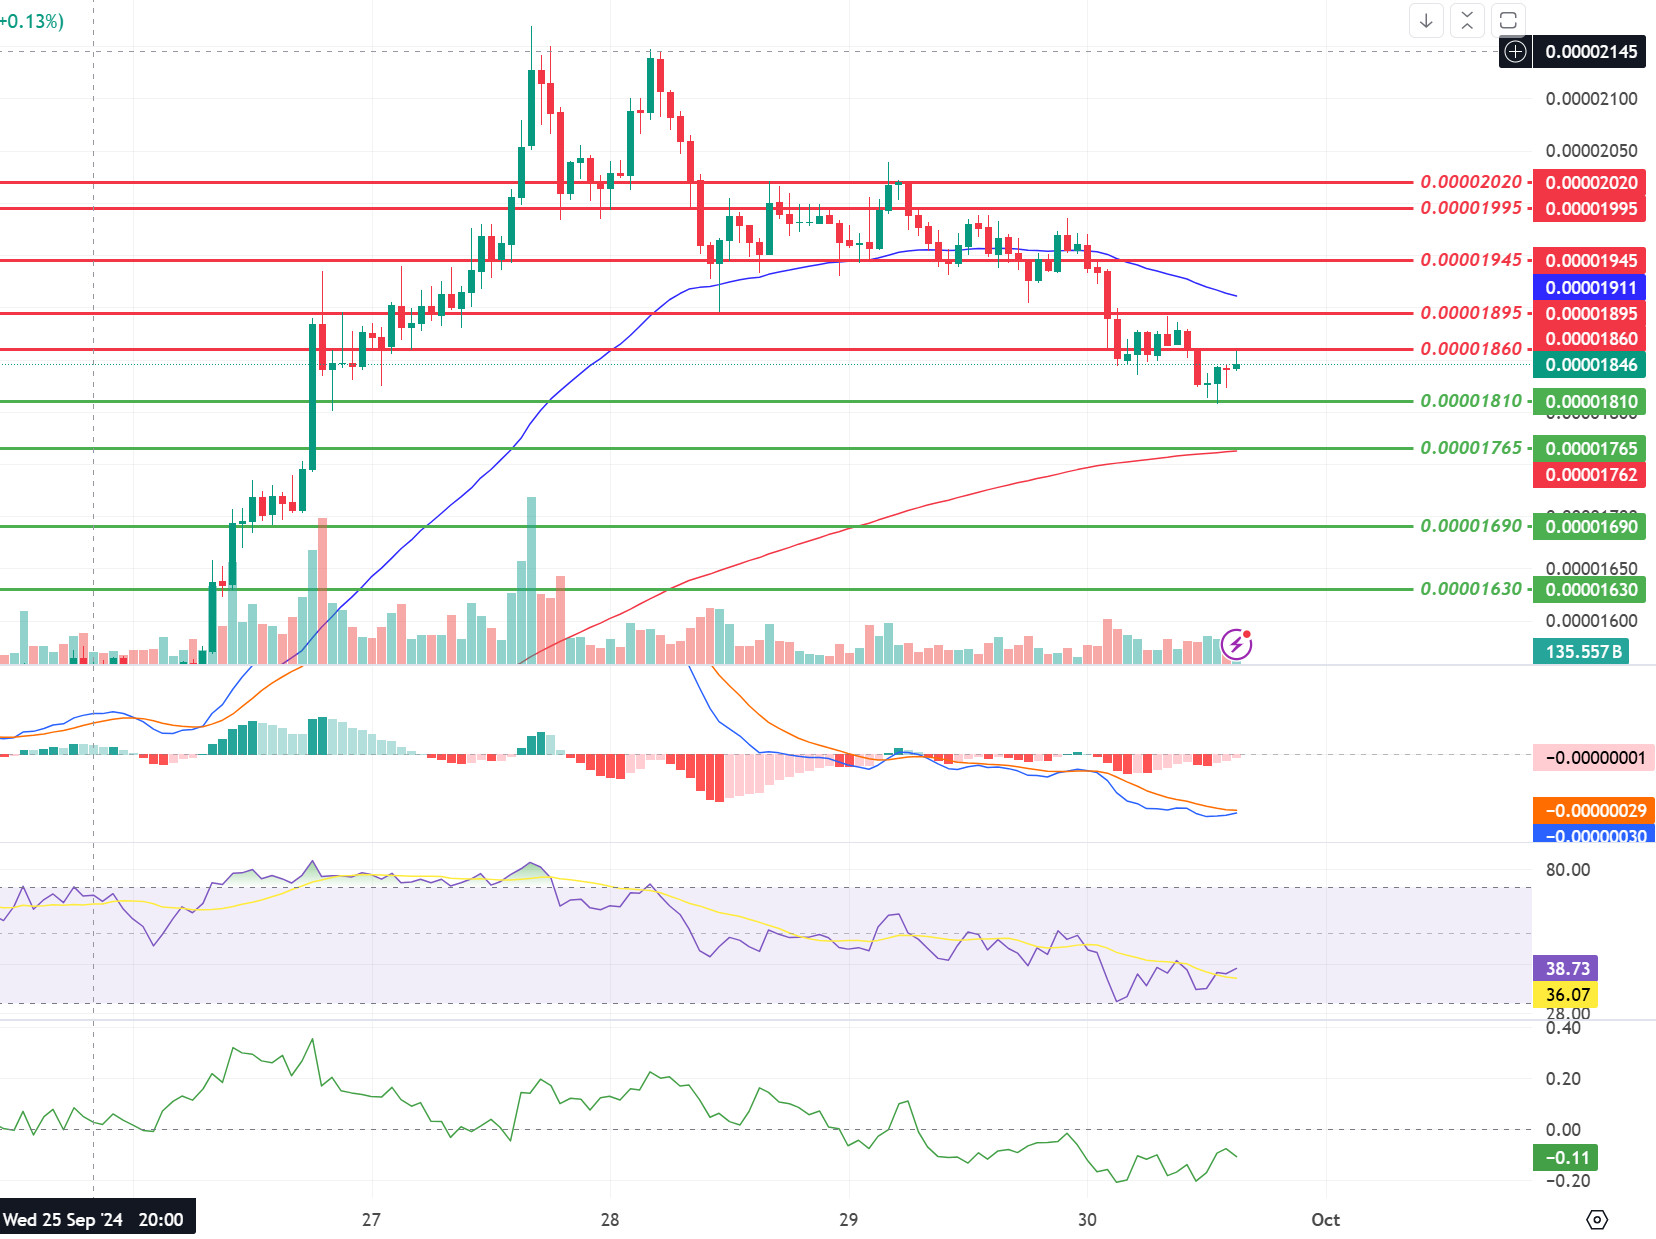
On the chart of Shiba Inu (SHIB), the price seems to have taken support at 0.00001810 after falling below 0.00001860. On the MACD, we see that the selling pressure is decreasing. On the RSI, there seems to be a positive mismatch between it and the price. In the positive scenario, if the price maintains above the 0.00001860 level, a move towards the EMA50 may be seen. In the negative scenario, it is seen that sellers are strong on the CMF oscillator. If the 0.00001860 level cannot be broken, the price may move towards the 0.00001810 and 0.00001765 support levels.
(Blue line: EMA50, Red line: EMA200)
Supports 0.00001810 – 0.00001765 – 0.00001690
Resistances 0.00001860 – 0.00001895 – 0.00001945
LEGAL NOTICE
The investment information, comments and recommendations contained herein do not constitute investment advice. Investment advisory services are provided individually by authorized institutions taking into account the risk and return preferences of individuals. The comments and recommendations contained herein are of a general nature. These recommendations may not be suitable for your financial situation and risk and return preferences. Therefore, making an investment decision based solely on the information contained herein may not produce results in line with your expectations.


