MARKET SUMMARY
Latest Situation in Crypto Assets
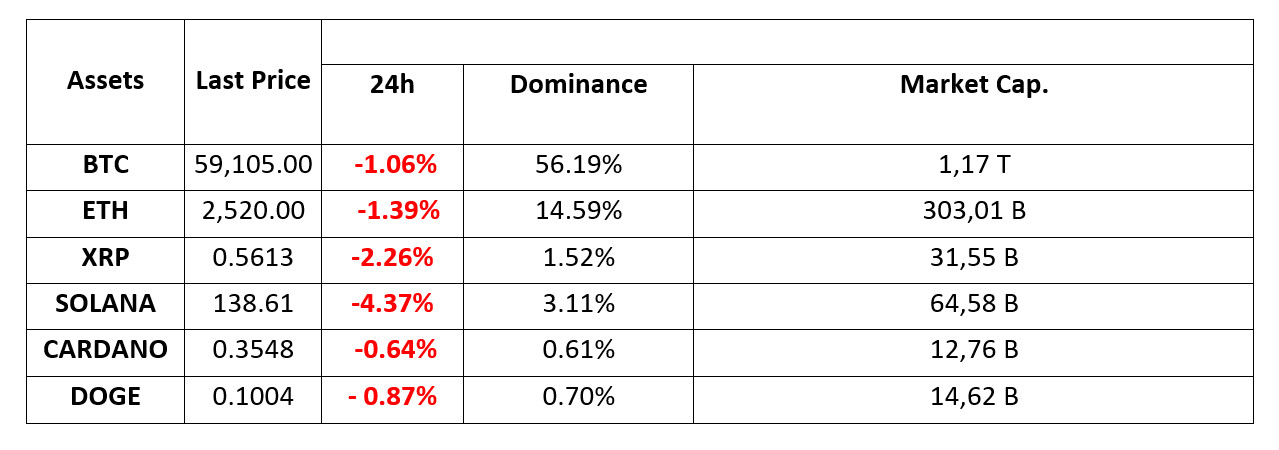
*Prepared on 30.08.2024 at 09:00 (UTC)
WHAT’S LEFT BEHIND
Attention Today! Donald Trump Will Announce His Big Plan to Make the USA The Cryptocurrency Capital
Donald Trump, who attracted attention with his pro-Bitcoin and cryptocurrency statements and projects, said at the Bitcoin Conference at the end of July that he would ‘create a strategic national Bitcoin reserve for the US if elected’. After the big BTC plan, Trump announced today that he will announce a plan to make the US the ‘cryptocurrency capital of the planet’.
Buffett’s $278 Billion Cash Position: Harbinger of Crisis, Tax Evasion?
Warren Buffet’s recent large Bank of America stock sales have caused various speculations in the traditional media. While much of the media tends to associate Buffet’s sales with a possible economic crisis, Buffet’s past strategies may lead us to question such an interpretation. If Buffet was really expecting a financial collapse, he could have sold a wider portfolio, not just a few stocks.
Elon Musk Acquitted in Dogecoin Case
Elon Musk, the famous businessman and Tesla CEO, secured the dismissal of a lawsuit filed in relation to Dogecoin. In the lawsuit, Musk was allegedly accused of manipulating Dogecoin and insider trading. The court finalised the case, allowing Musk to be cleared of these charges. This development resonated in the cryptocurrency world and created a great relief among Dogecoin investors.
El Salvador President Bukele announced that he could not find what he hoped for in Bitcoin (BTC)!
El Salvador’s Bitcoin (BTC) supporter President Nayib Bukele said that the plan to make the country the centre of the largest cryptocurrency is ‘clearly positive’ but that its adoption has generally lagged behind his expectations.
HIGHLIGHTS OF THE DAY

INFORMATION
*The calendar is based on UTC (Coordinated Universal Time) time zone. The economic calendar content on the relevant page is obtained from reliable news and data providers. The news in the economic calendar content, the date and time of the announcement of the news, possible changes in the previous, expectations and announced figures are made by the data provider institutions. Darkex cannot be held responsible for possible changes that may arise from similar situations.
MARKET COMPASS
Yesterday’s data showing that the US economy grew at a faster pace in the second quarter of the year compared to the previous data seems to have made the recession concerns that shook the markets in early August a little more forgotten. Asian stock markets are on the rise this morning. On the other hand, macroeconomic data measuring inflation will continue to be announced for the world’s major economies later in the day.
Inflation Day in the Markets
European stock markets, which are expected to start the day with a mixed course, will focus on the inflation data to be announced for the countries with large economies of the continent today. This data set, which may affect market perception before the critical PCE Price Index figures of the USA, may also be decisive in digital asset prices.
FED’s Rate Cut Dosage
The Core PCE Price Index, which is known to be preferred by the US Federal Reserve (FED) to monitor inflation, will be announced today at 12:30 UTC. The index, which signalled a 0.2% increase in June, is expected to point to the same rate of increase in the general level of prices in July. According to the CME FedWatch Tool, the FED is expected to cut the policy rate by 25 basis points on 18 September with a probability of 67%. While the markets are wondering whether the Bank will make one ‘Jumbo’ rate cut of 50 basis points in the remaining meetings of the year, today’s data may provide information about the dose of rate cuts.
If the PCE index is realised below 0.2%, which is the weighted expectation, we can state that the expectation that the interest rate cut route will be passed with faster steps may strengthen, causing losses in the dollar and increases in crypto assets in parallel. A data above the forecasts may cause pressure on digital assets.
TECHNICAL ANALYSIS
BTC/USDT
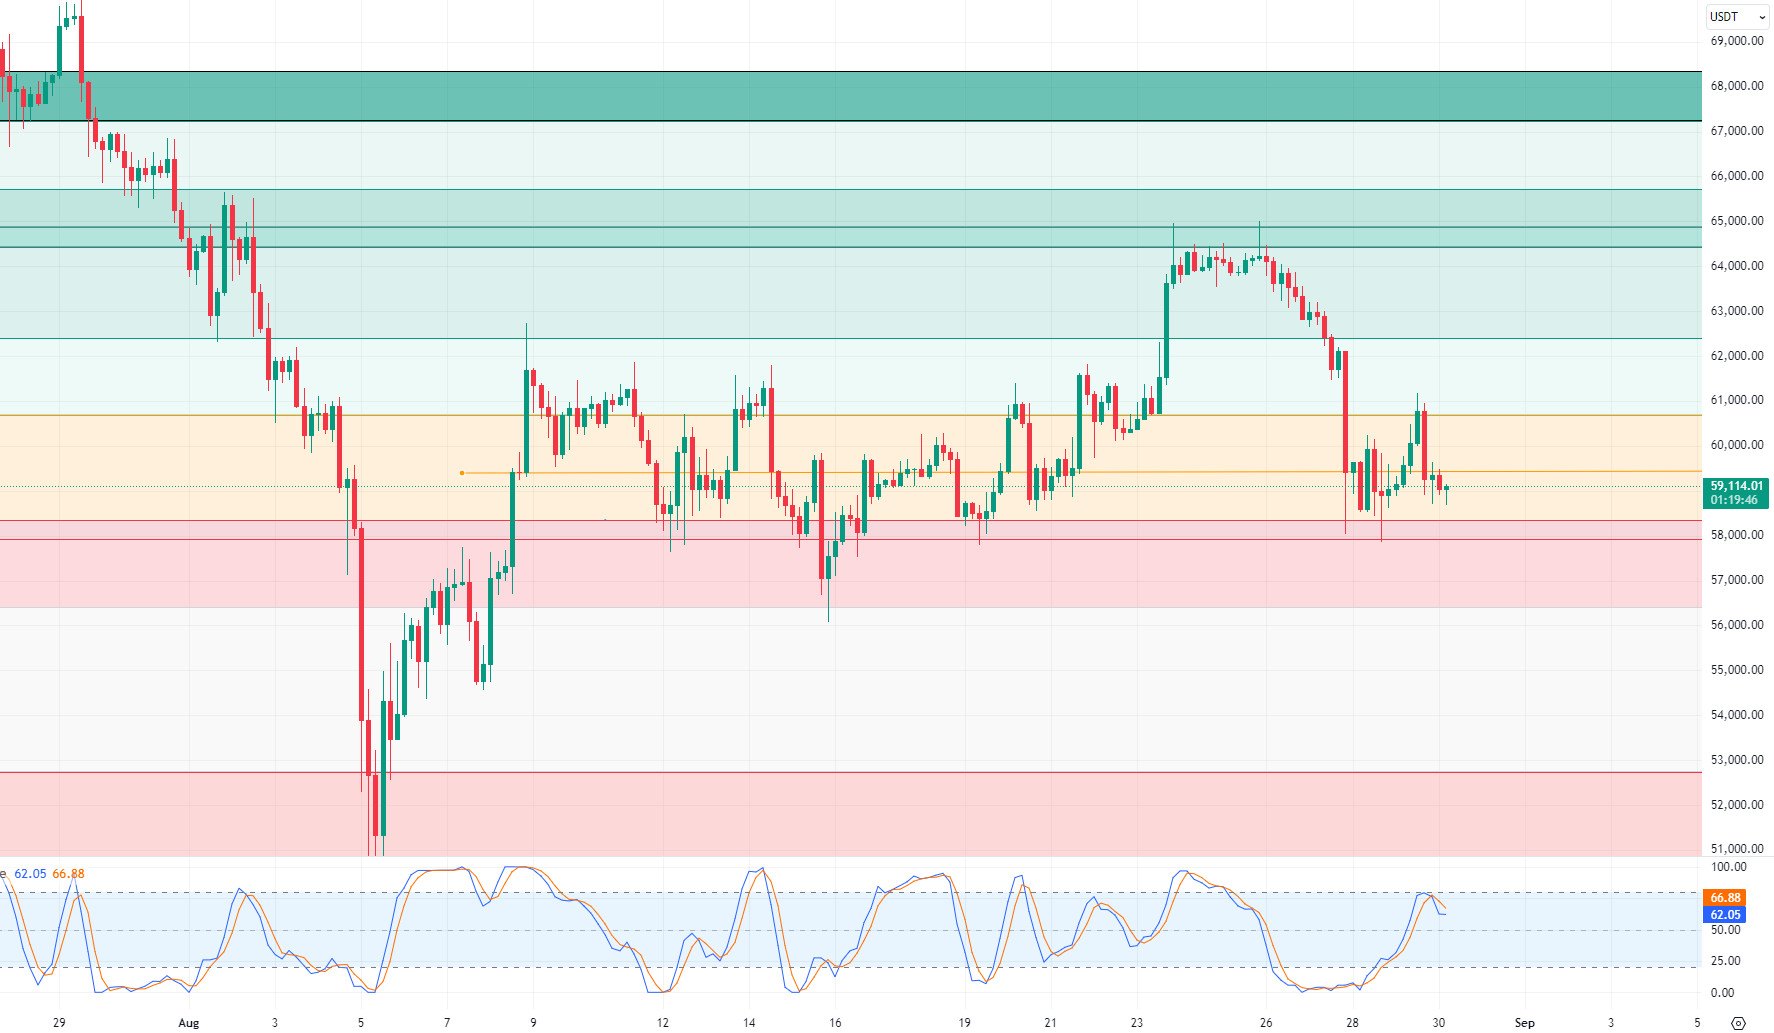
In search of direction in Bitcoin! After the macroeconomic data released by the US yesterday, Bitcoin experienced mobility and retreated again after testing 61,100 levels. The reason behind the retreat has started to be wondered by crypto investors. The intensification of transaction activity among Bitcoin whales seems to have a significant impact on short-term price movements. This situation may cause Bitcoin to display an unstable image in search of direction. In addition, reporting outflows totalling $71.73 million from Bitcoin ETFs is another factor behind the decline. Among the events that will affect the price in Bitcoin today, presidential candidate D. Trump, known as pro-crypto, will announce his plan to make the US a cryptocurrency capital, which may create volatility again. In the BTC 4-hour technical analysis, it broke the 59,400 support point downwards and reached the 59,100 level as of now. Pricing below the psychological resistance zone of 60,000 levels may be among the factors that increase sales pressure. With the deepening of the retreat, our next support point is the 58,300 level, and if it breaks, it may bring a journey towards the 56,400 level. In order to see the price recover from the current level of 59,100, we may need to wait for it to consolidate above the 59,400 point.
Supports 59,400 – 58,300 – 56,400
Resistances 60,650 – 61,700 – 62,400
ETH/USDT
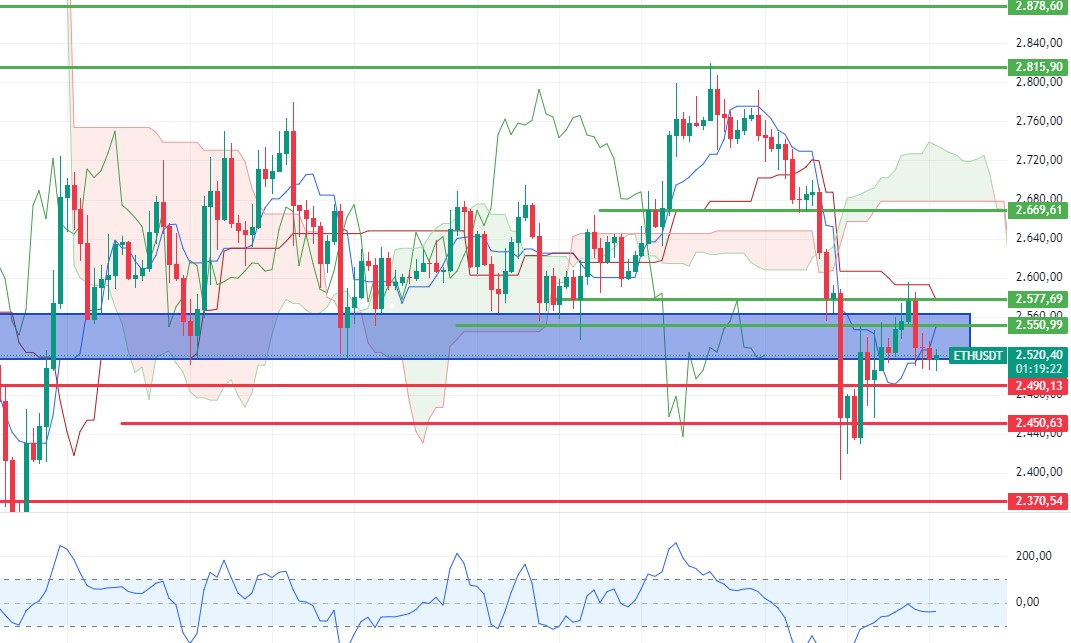
Ethereum declined as expected, rejecting the 2,592 level. This decline, where the negative mismatch in the RSI is resolved, may continue until 2,490. The Tenkan level is drawn to 2,577. For the continuation of the positive structure, it is critical to regain 2,550 and then 2,577 levels. The buy signal formed in the hourly CCI points to the 2,550 level when Bitcoin allows. The cleaning of liquidation blocks accumulated at 58,300 levels in Bitcoin can lower the price to 2,450 levels. Especially the positive value of the funding rate strengthens the possibility of this liquidation.
Supports 2,490 – 2,450 – 2,366
Resistances 2,550 – 2,577 – 2,669
LINK/USDT
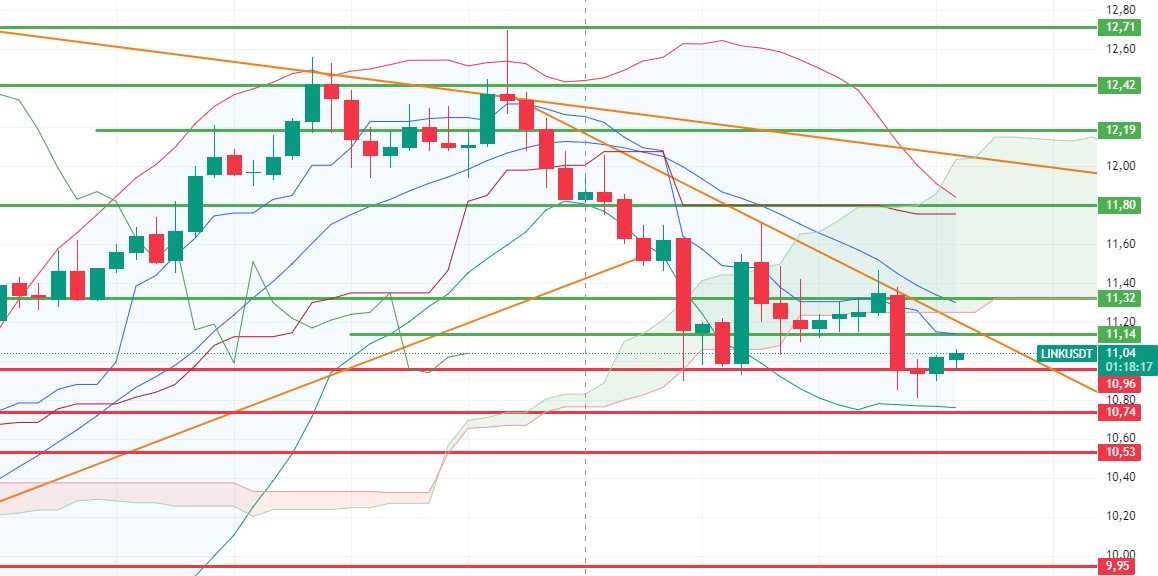
LINK was affected by the decline in the market and retreated to the main support levels and was able to hold above 11 levels again. The 11.14 level, which is both kijun and trend resistance, stands out as the most critical level. Closures above this level can bring an increase up to 11.32, which is the bollinger middle band and kumo cloud resistance. Gaining these levels seems necessary to regain the positive structure in LINK. As of this morning, breaking the main support of 10.96 may bring a decline to 10.74 levels.
Supports 10.96- 10.74 – 10.53
Resistances 11.14 – 11.32 – 11.80
SOL/USDT
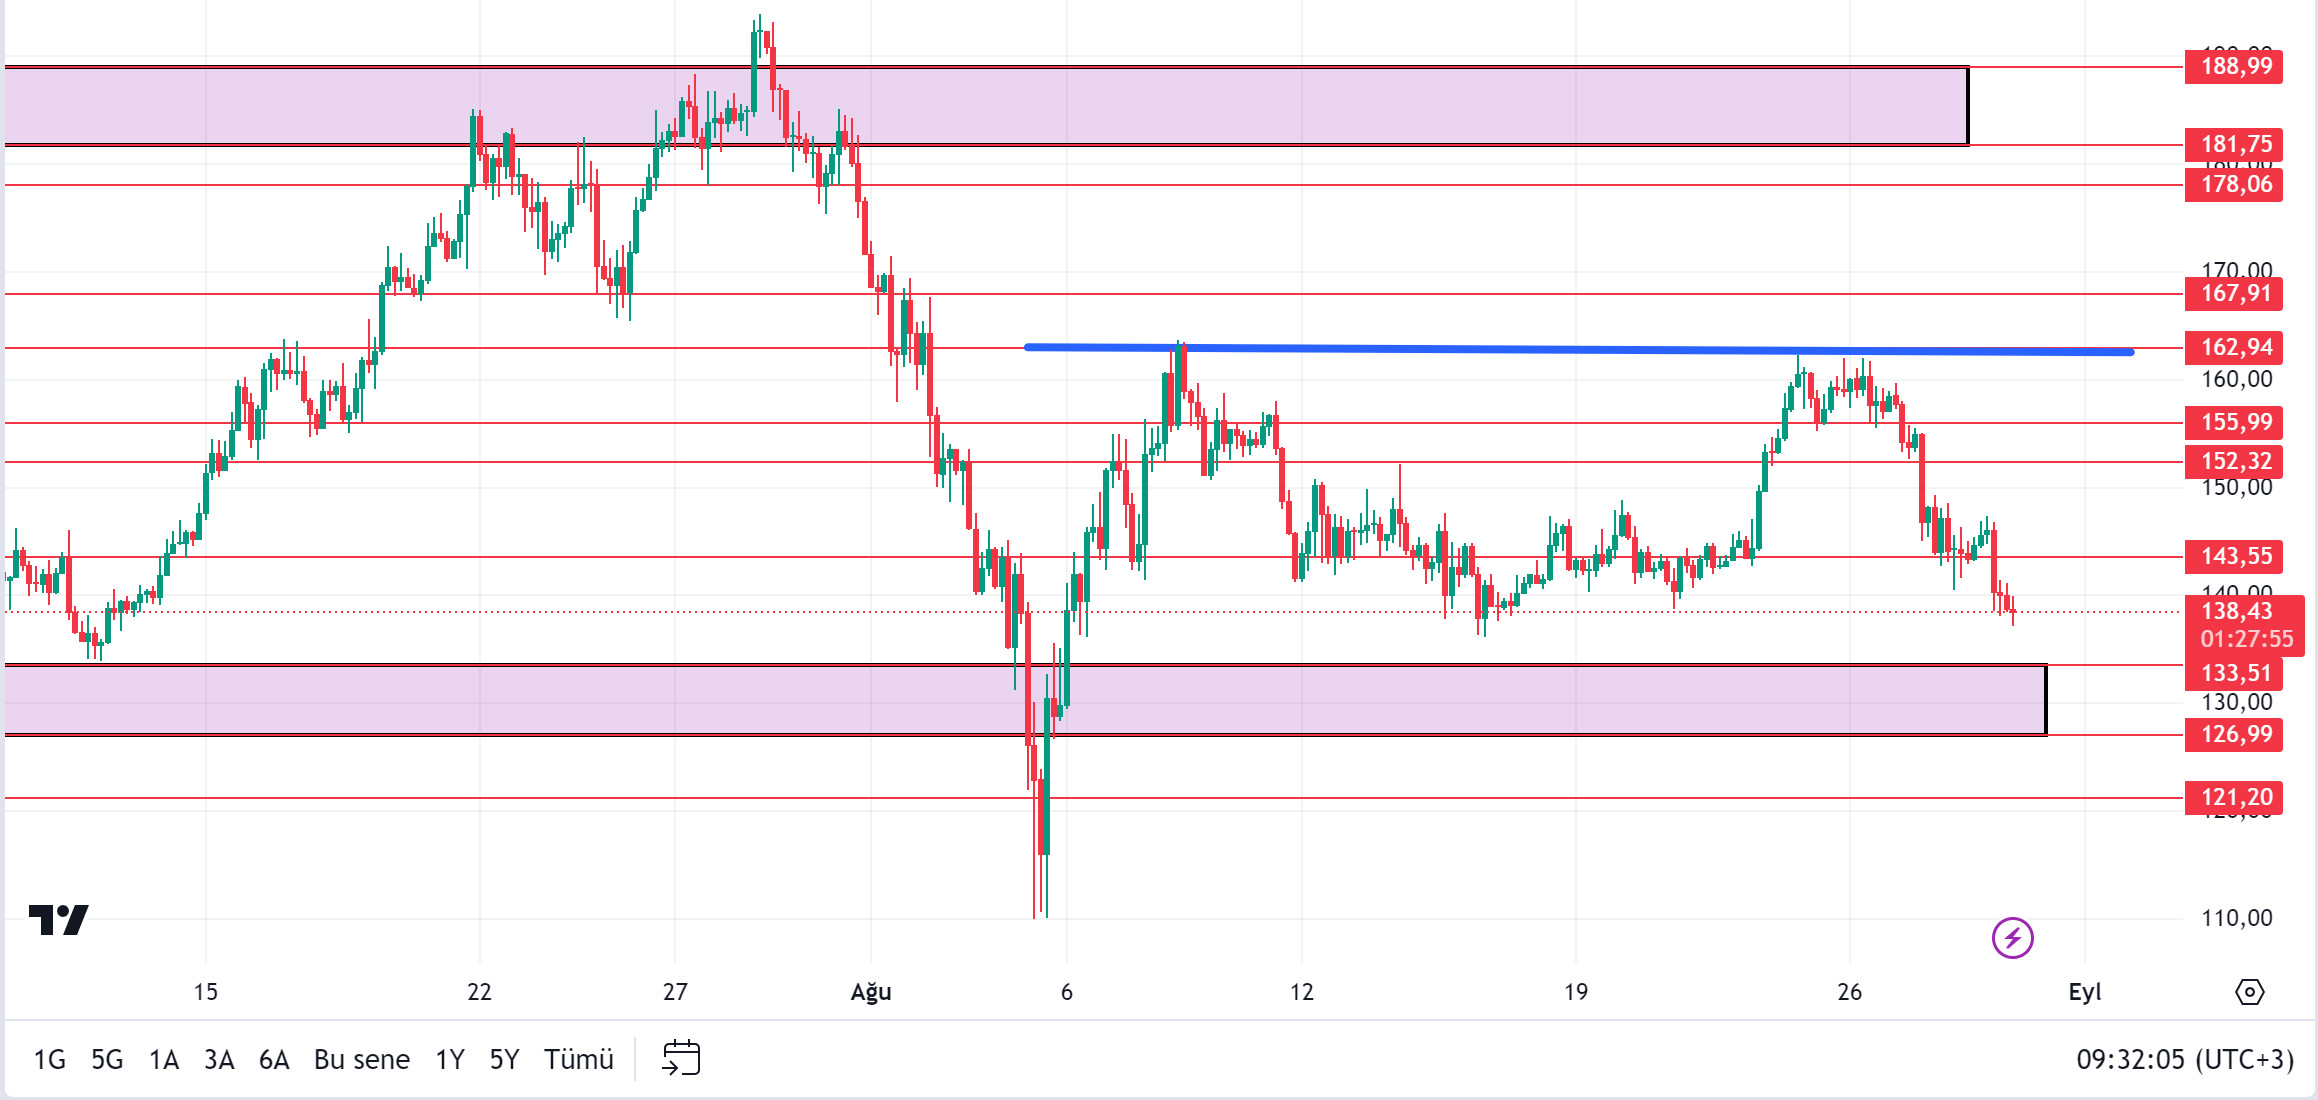
The Core Personal Consumption Expenditure Price Index from the USA is among the data to be followed. An unexpected value may increase the volume in the market. In the Solana ecosystem, a central exchange is planning to launch a token in Solana, emphasising the importance of liquid staking in the DeFi economy. This will allow users to stake SOL without losing the liquidity of their tokens. This initiative could attract more users to the DeFi ecosystem by increasing the total locked value (TVL) on Solana. Compared to ETH, it has more native tokens but lacks liquid staking. While almost 65% of Ethereum’s staked ETH is liquid, Solana’s liquid staked tokens are about 6%. However, despite the ongoing bear market conditions in the crypto market, Solana achieved an important milestone by reaching the highest level of the year with 2.3 million daily active users on August 28, according to data from Token Terminal. Looking at the chart, SOL broke the bottom point of the rising triangle formation downwards. SOL, which has been accumulating in a certain band since April, may test support levels of 133.51 – 126.99 if declines continue. If purchases increase in the market, 143.55 – 152.32 resistances should be followed.
Supports 133.51 – 126.99 – 121.20
Resistances 143.55 – 152.32 – 155.92
ADA/USDT
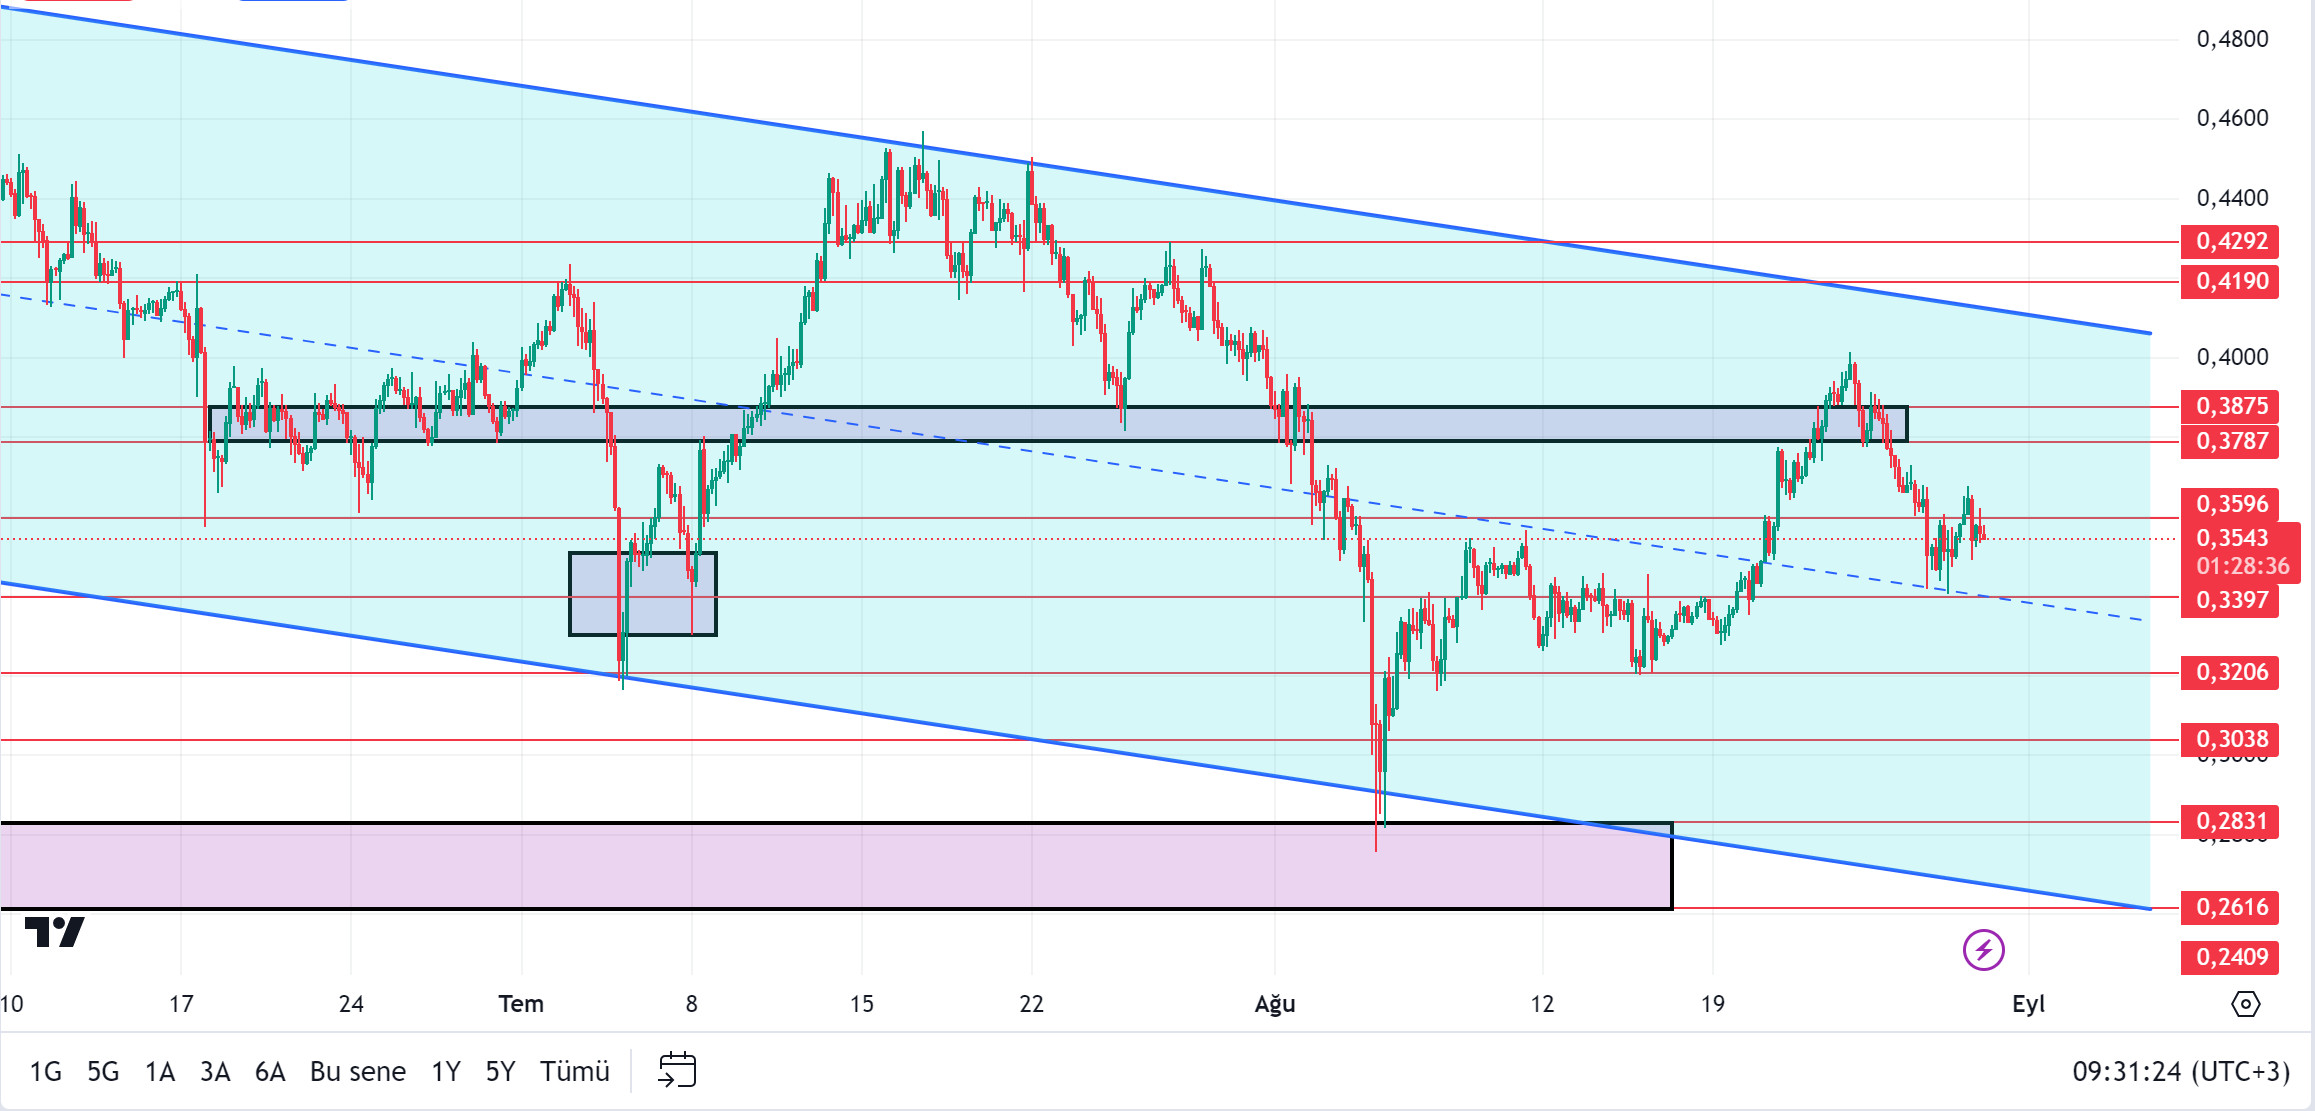
The Core Personal Consumption Expenditure Price Index from the USA is among the data to be followed. A value outside the expectation may increase the volume in the market. In Cardano, all eyes are turned to 1 September. Will the hard fork be successful? Intersect underlined that the Chang hard fork is a revolutionary step for the ecosystem and points to Voltaire, the final stage of the network’s decentralisation process. On the other hand, about three months later, Cardano will enter the 2nd Chang upgrade with the approval of the Interim Constitutional Committee (ICC) and Pay Pool Operators (SPOs). This phase will transition the network from technical bootstrapping to active participation. When we look at the chart of ADA, it is priced at 0.3543, supported by the middle level of the descending channel. With the continued rise of ADA, which does not decline much despite the market, 0.3596 – 0.3787 levels can be followed as resistance levels. In the scenario where investors anticipate BTC’s selling pressure to continue, 0.3397 – 0.3206 levels can be followed as support if it continues to be priced in the descending channel.
Supports 0.3397 – 0.3206 – 0.3038
Resistances 0.3596 – 0.3787 – 0.3875
AVAX/USDT
AVAX, which opened yesterday at 23.44, fell approximately 2.5% during the day and closed the day at 22.89.
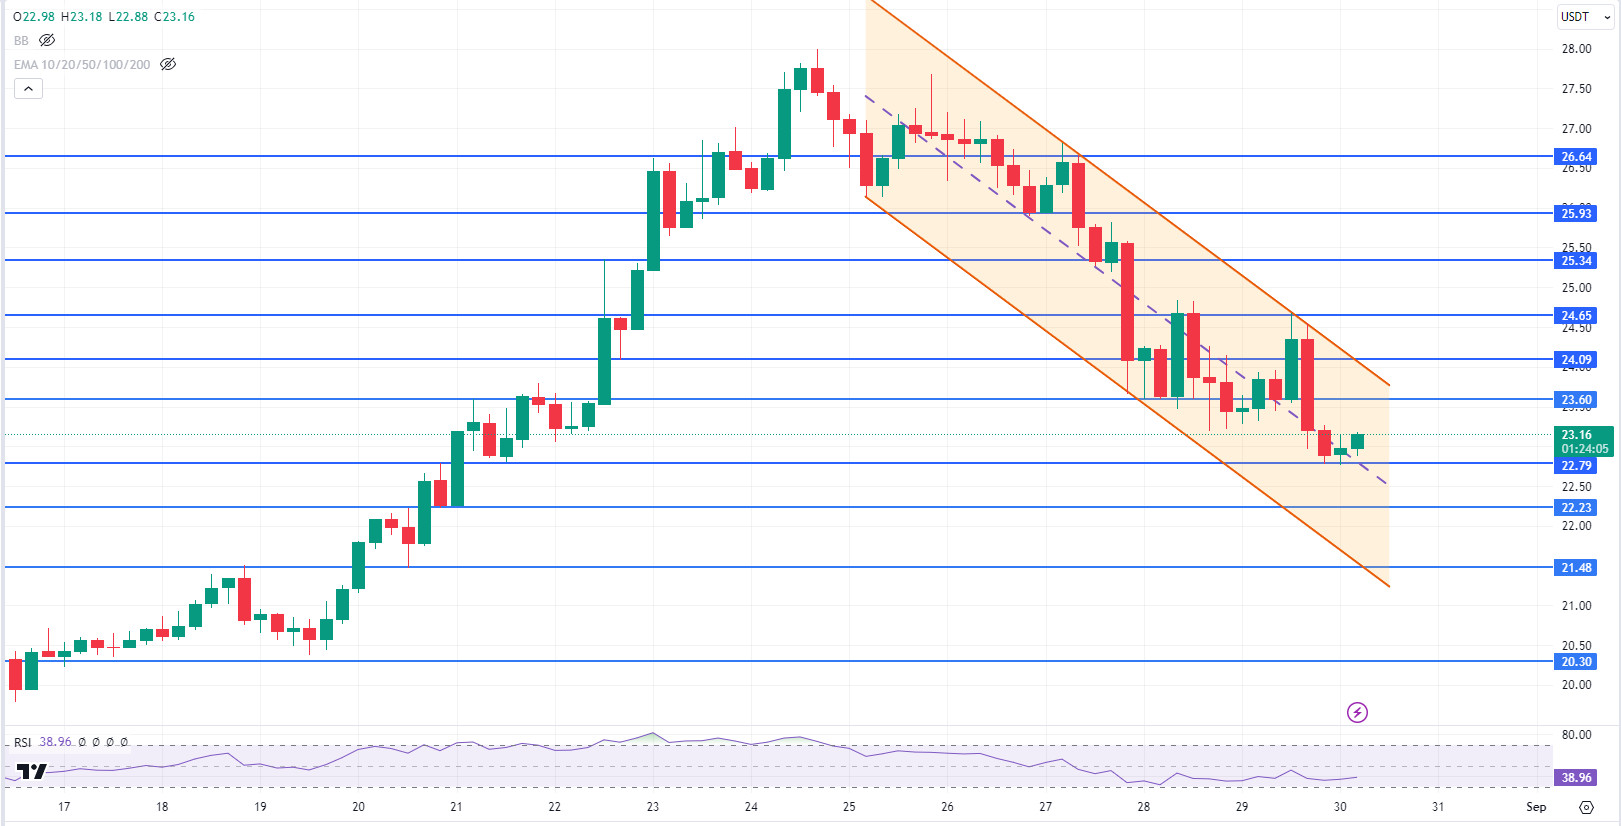
Today, core personal consumption expenditures price index data will be announced by the US. This data is one of the important data that the FED takes into account in the interest rate cut decision. AVAX, priced at 23.16 before the release of the data, continues to move in a falling channel. On the 4-hour chart, it is trying to move from the middle band of the channel to the upper band and may accelerate its upward movement if the data to be announced is announced slightly below the expectation or expectation. Thus, it can test 23.60 and 24.09 resistances. If it cannot break the 23.60 resistance and sales pressure comes from here, the movement to the lower band of the channel may begin. In this case, it can test 22.79 and 22.23 supports. As long as it stays above 21.48 support during the day, the upward appetite may continue. With the break of 21.48 support, deepening of sales can be expected.
Supports 22.79 – 22.23 – 21.48
Resistances 23.60 – 24.09 – 24.65
TRX/USDT
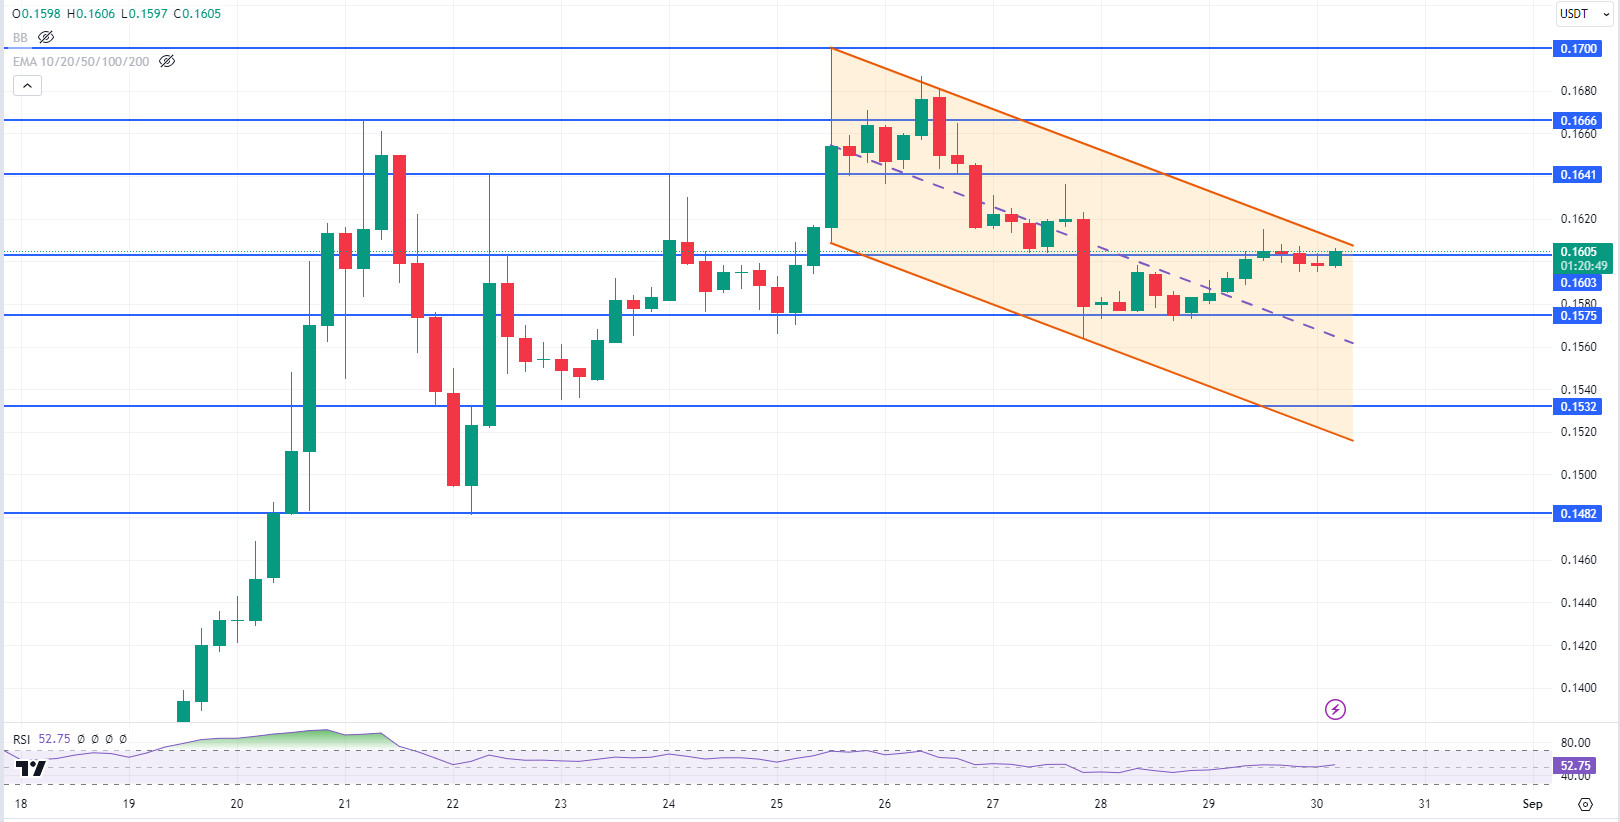
TRX, which started yesterday at 0.1582, rose slightly and closed the day at 0.1599. TRX, which we expect an increase in its volatility in line with the US core personal consumption expenditures price index data to be announced today, is currently trading at 0.1605. TRX, which moves in a falling channel, is in the upper band of the channel on the 4-hour chart. Its rise may accelerate as it breaks the upper band of the channel. In such a case, it can test 0.1641 and 0.1666 resistances. If it fails to break the upper band, it may decline to the middle band. In this case, it may test the support of 0.1575. If it cannot hold here, it may go down to the lower band of the channel and test the 0.1532 support. TRX can be expected to continue its desire to rise as long as it stays above 0.1482 support. If it breaks this support downwards, sales may deepen.
Supports 0.1575 – 0.1532 – 0.1482
Resistances 0.1603 – 0.1641 – 0.1666
XRP/USDT
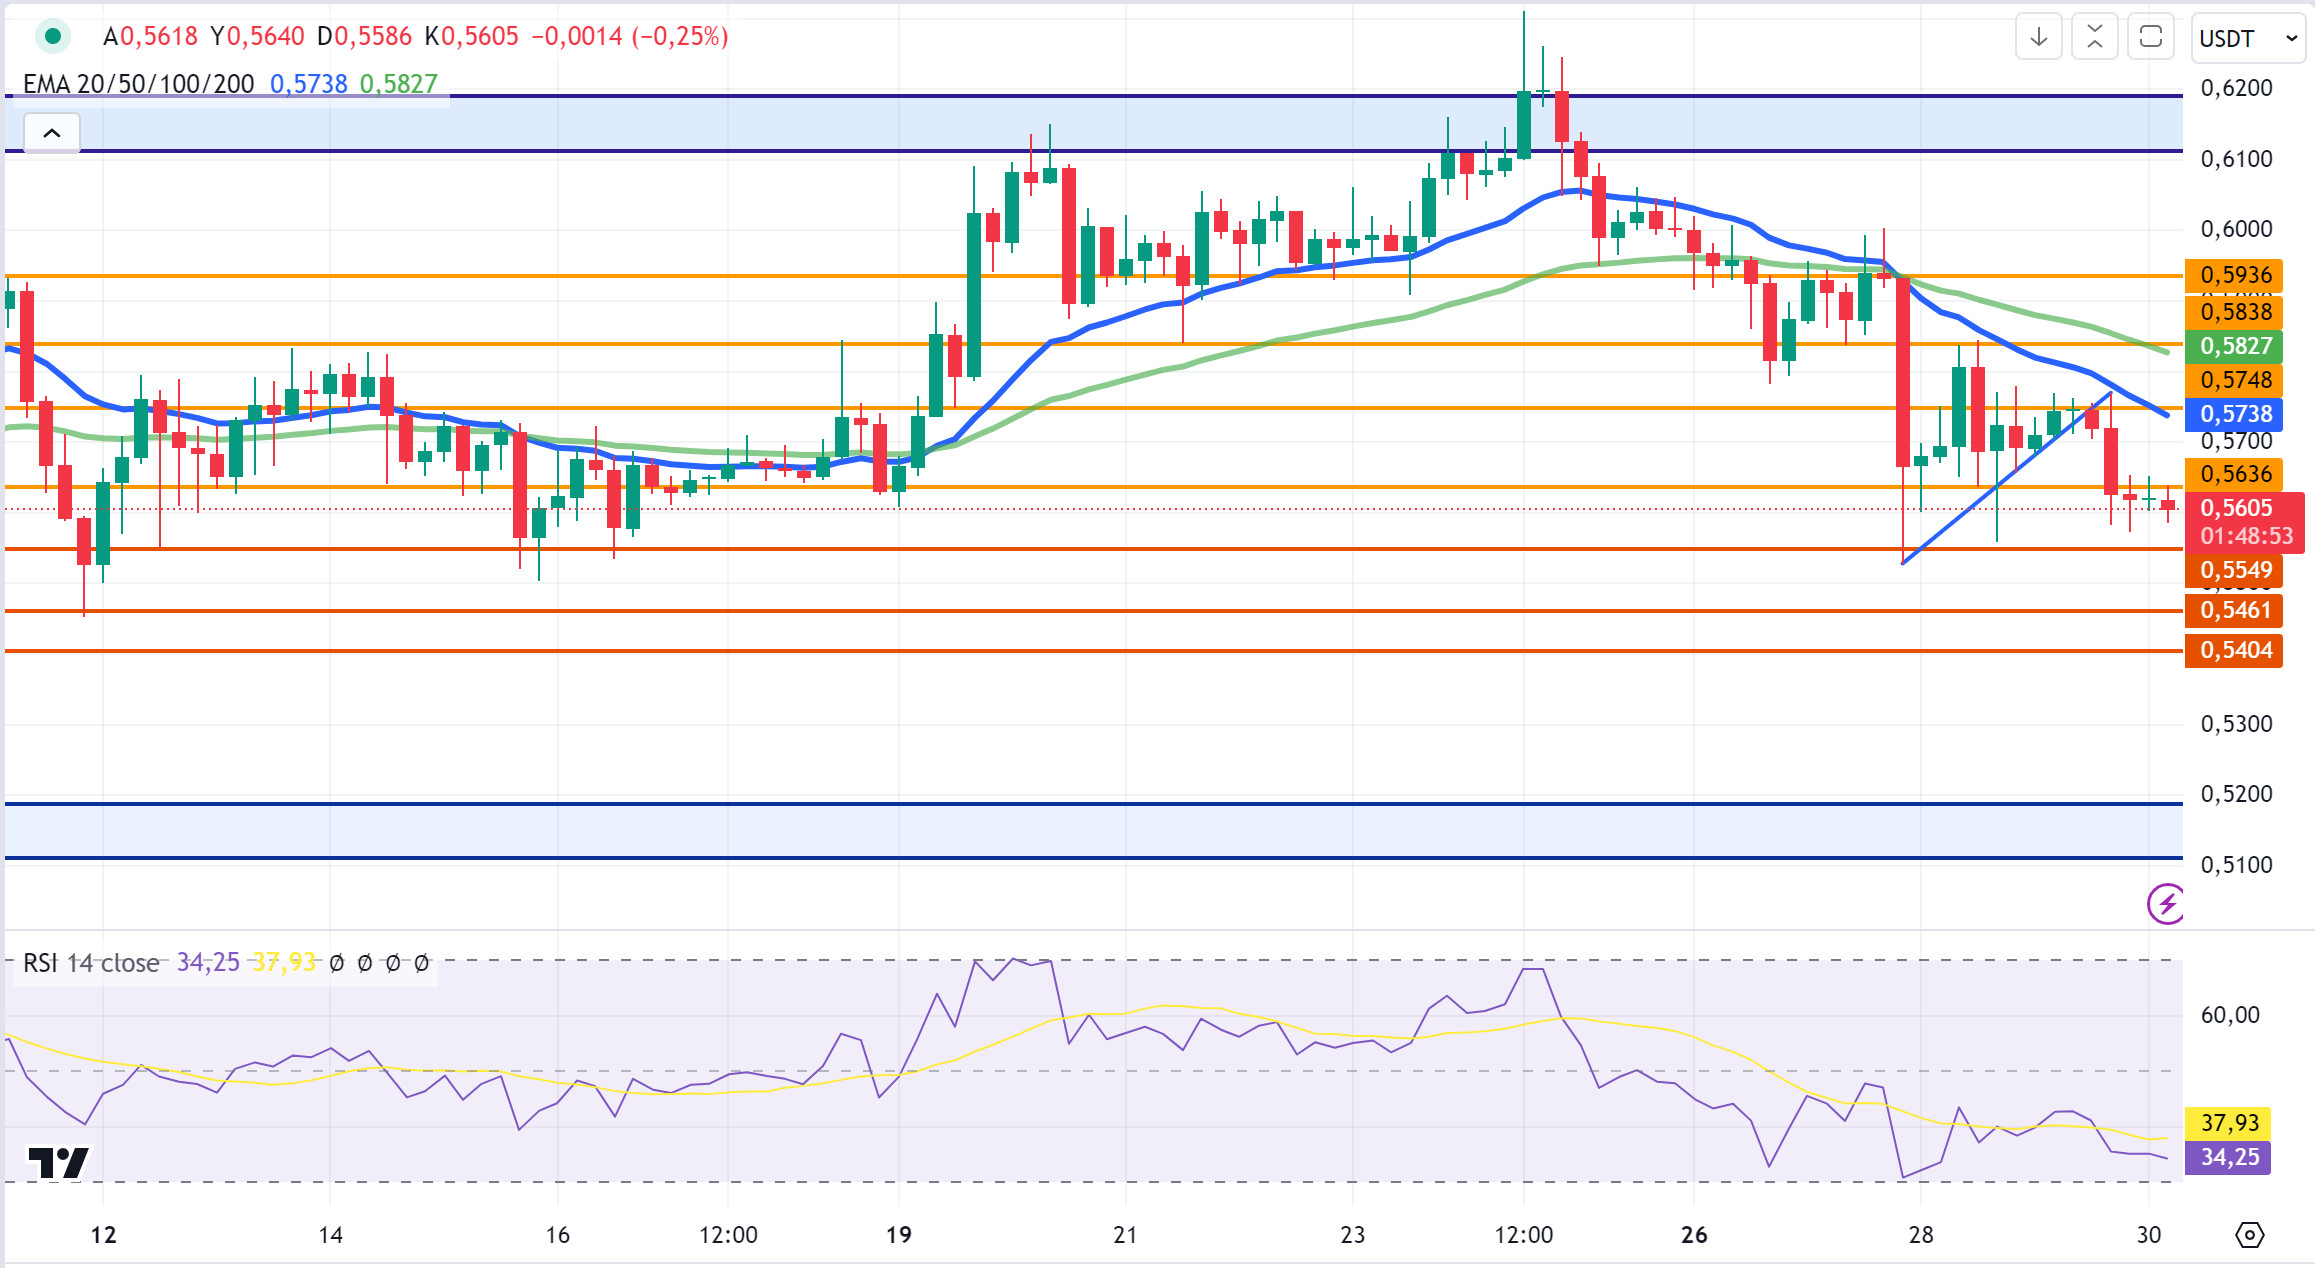
XRP closed the day at 0.5615 with a 1.32% decline yesterday. As seen in the 4-hour analysis, XRP could not continue its uptrend and fell to 0.56.
As XRP continues to move in a horizontal band between 0.55-0.58, it may test the support levels of 0.5461 – 0.5404 if the decline continues and the support level of 0.5549 is broken after being tested. In case it recovers and starts to rise again, XRP can test the resistance levels of 0.5636 – 0.5748 – 0.5838.
In this process, if the decline continues and declines to the level of 0.55, it may rise with the reactions that may come from here and may offer opportunities for long transactions. In case of a decline below the level of 0.55 and a deepening of the decline, it may offer opportunities in short transactions.
Supports 0.5549 – 0.5461 – 0.5404
Resistances 0.5636 – 0.5748 – 0.5838
DOGE/USDT
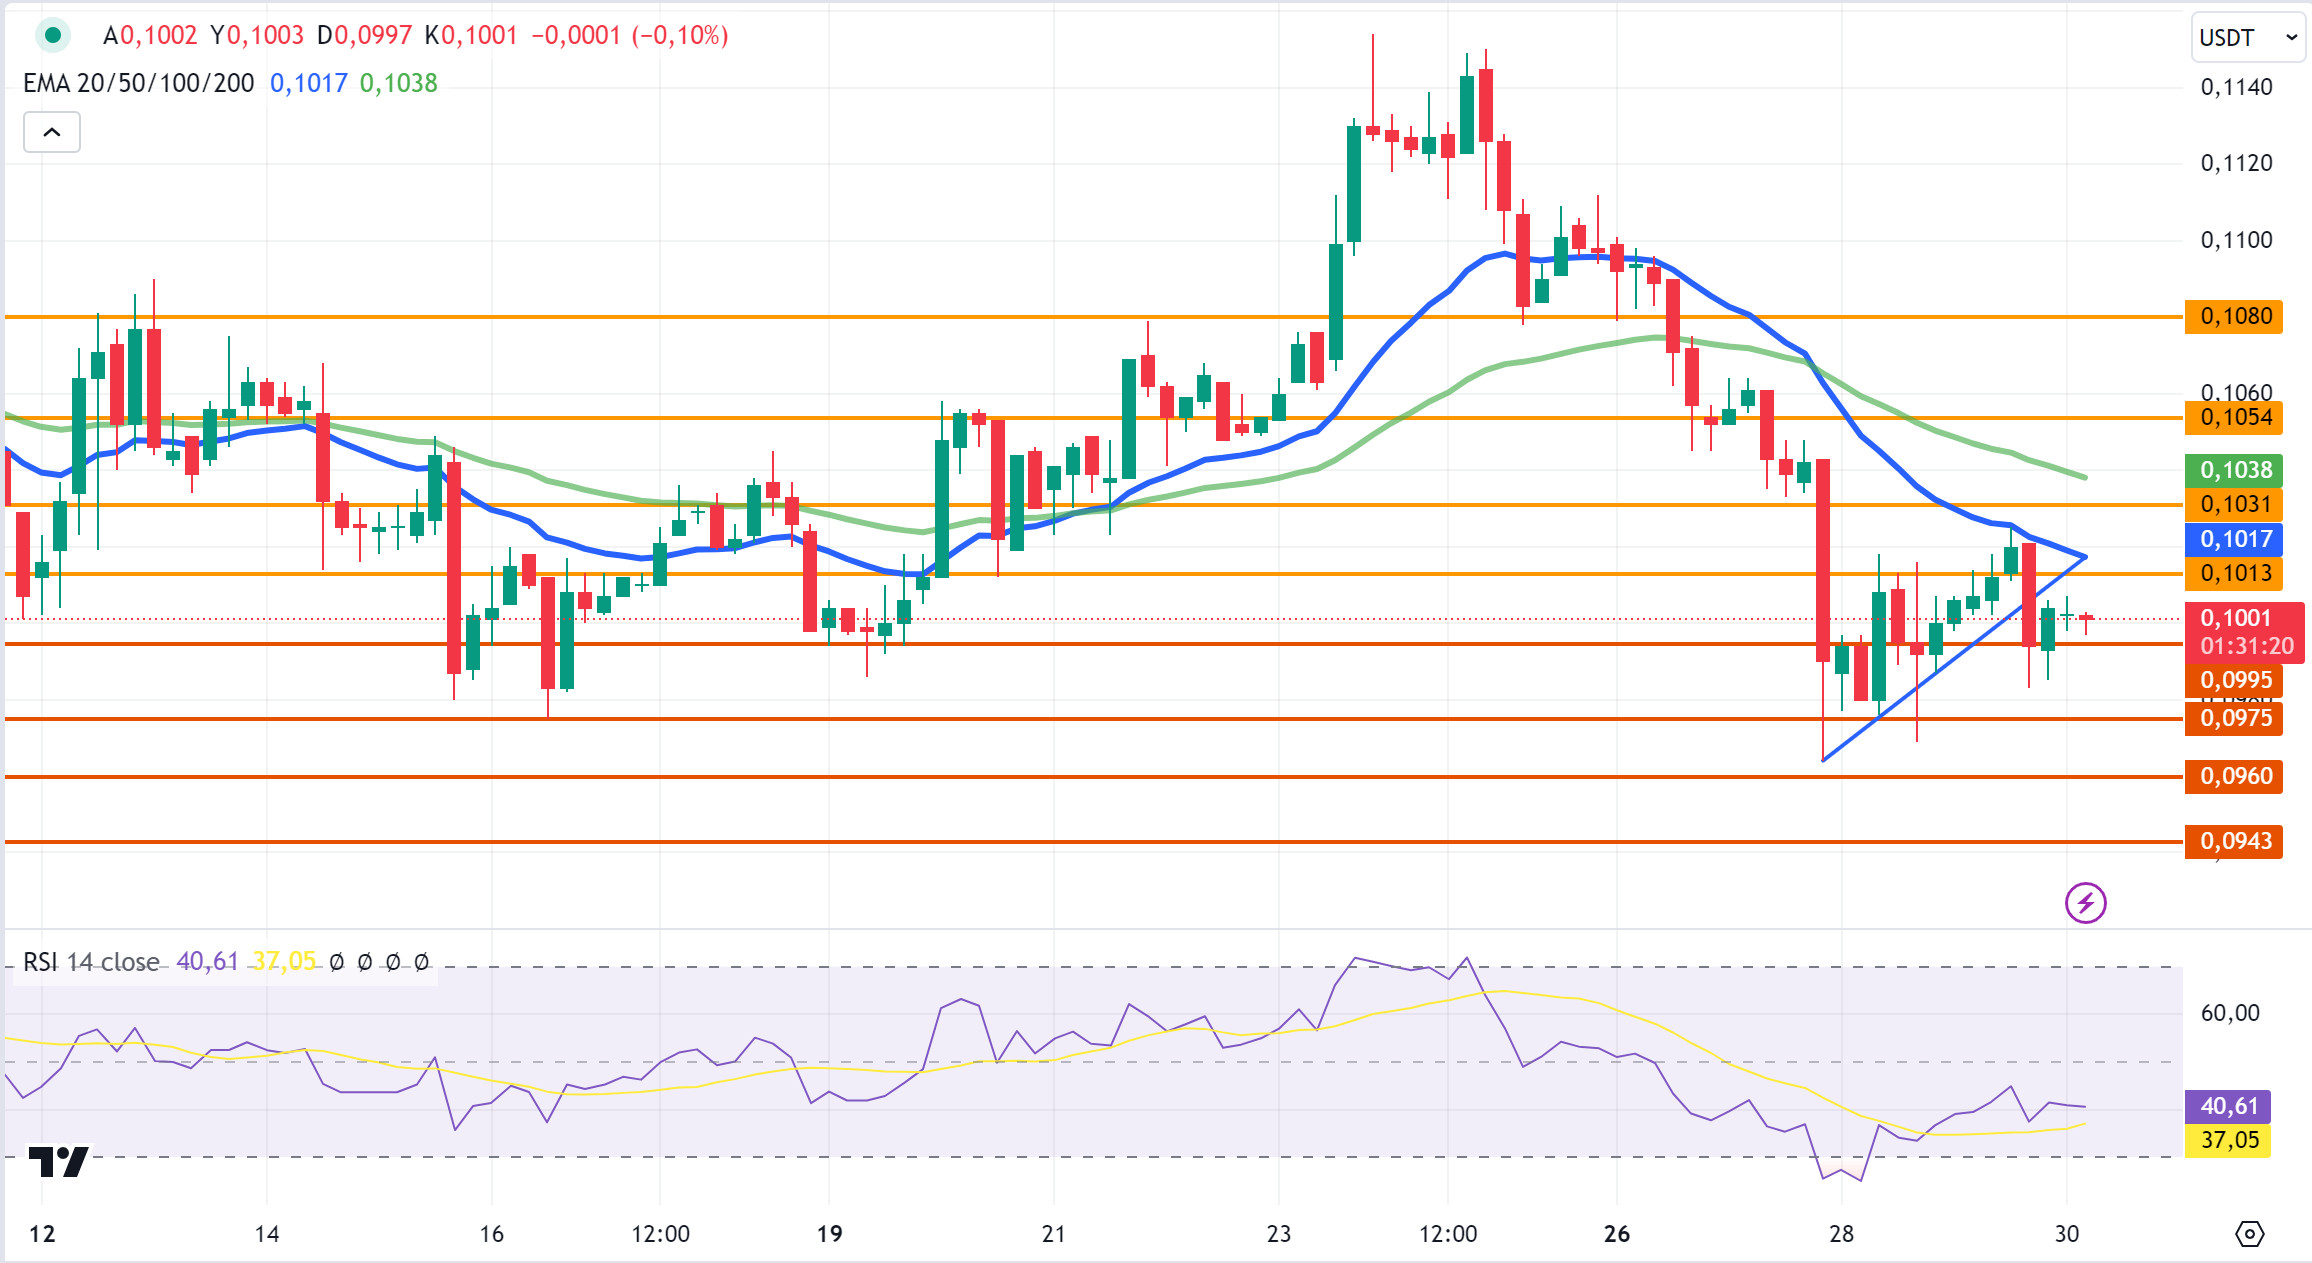
DOGE, which rose to 0.1025 yesterday with an uptrend, could not continue its rise with a 3% decline before the closing candle in the 4-hour analysis. DOGE, which closed yesterday with a 0.75% increase in value on a daily basis, started the new day at 0.1003.
In the 4-hour analysis, DOGE, which remained below the uptrend, started with a horizontal movement today. If the decline in the crypto market continues, it may test the support levels of 0.0995 – 0.0975 – 0.0960 with a decline in DOGE. In case of a rise, it can test the resistance levels of 0.1031 – 0.1054 – 0.1080.
As it continues its horizontal movement, it may offer opportunities in short-term transactions in downward and upward movements between 0.0975 support and 0.1054 resistance levels.
Supports 0.0995 – 0.0975 – 0.0960
Resistances 0.1031 – 0.1054 – 0.1080
DOT/USDT
Inter Miami has formed an important partnership with Polkadot and Polkadot has become the club’s Global Training Partner. Inter Miami’s first team training kits will feature the Polkadot logo in the foreground. The partnership includes initiatives such as various digital campaigns to increase engagement with Inter Miami’s fan base and prominent brand visibility in the stadium.
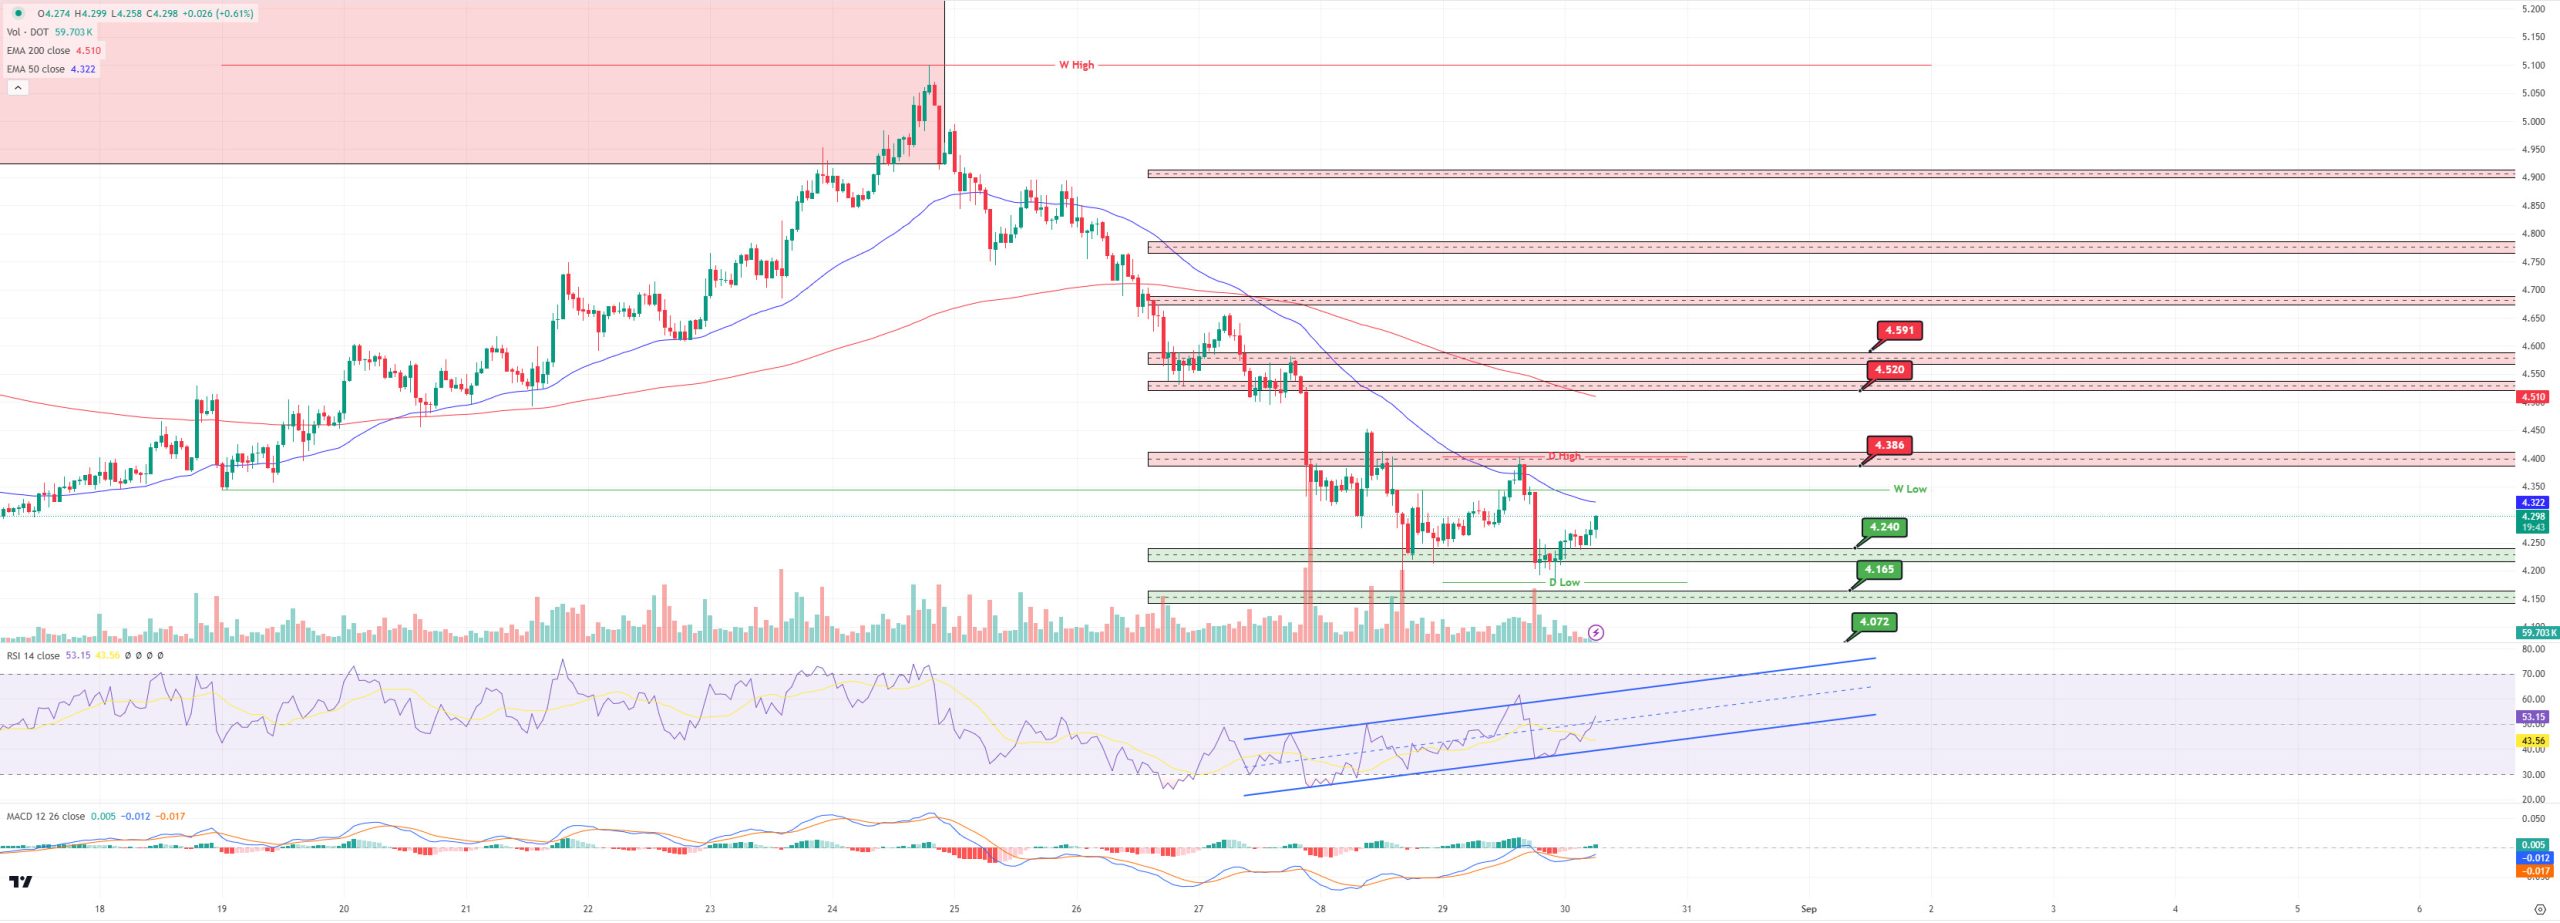
As for the Polkadot chart, DOT, which fell sharply with increasing selling pressure at 4,386 levels, the first resistance level, retreated to support at 4,240 levels. Selling pressure on MACD seems to have decreased. RSI has risen to the middle band of the rising channel. In the positive scenario, with the increase in buyer pressure, the price may retest 4.386 levels from here. In the negative scenario, the price may fall from here to 4,240 levels with the decrease in buyer pressure. With a break down of the previous day’s low, a retracement to other support levels of 4,165 and 4,072 can be expected.
(Blue line: EMA50, Red line: EMA200)
Supports 4.240 – 4.165 – 4.072
Resistances 4.386 – 4.520 – 4.386
SHIB/USDT
Shiba Eternity will now be known as Shiba Inu Games and will operate under the name @PlayWithShib. The platform will add new games to the SHIB ecosystem. ‘Agent Shiboshi,’ unveiled today, is a new game about a Shiba Inu as an agent fighting enemies called ’Shadowcats.’ It will first be available on Web2 platforms and will be integrated into Shibarium in the future. In line with this news, investors may welcome the introduction of new games. For this reason, it may be a promising development for the expansion of the Shib Inu ecosystem and innovative projects.
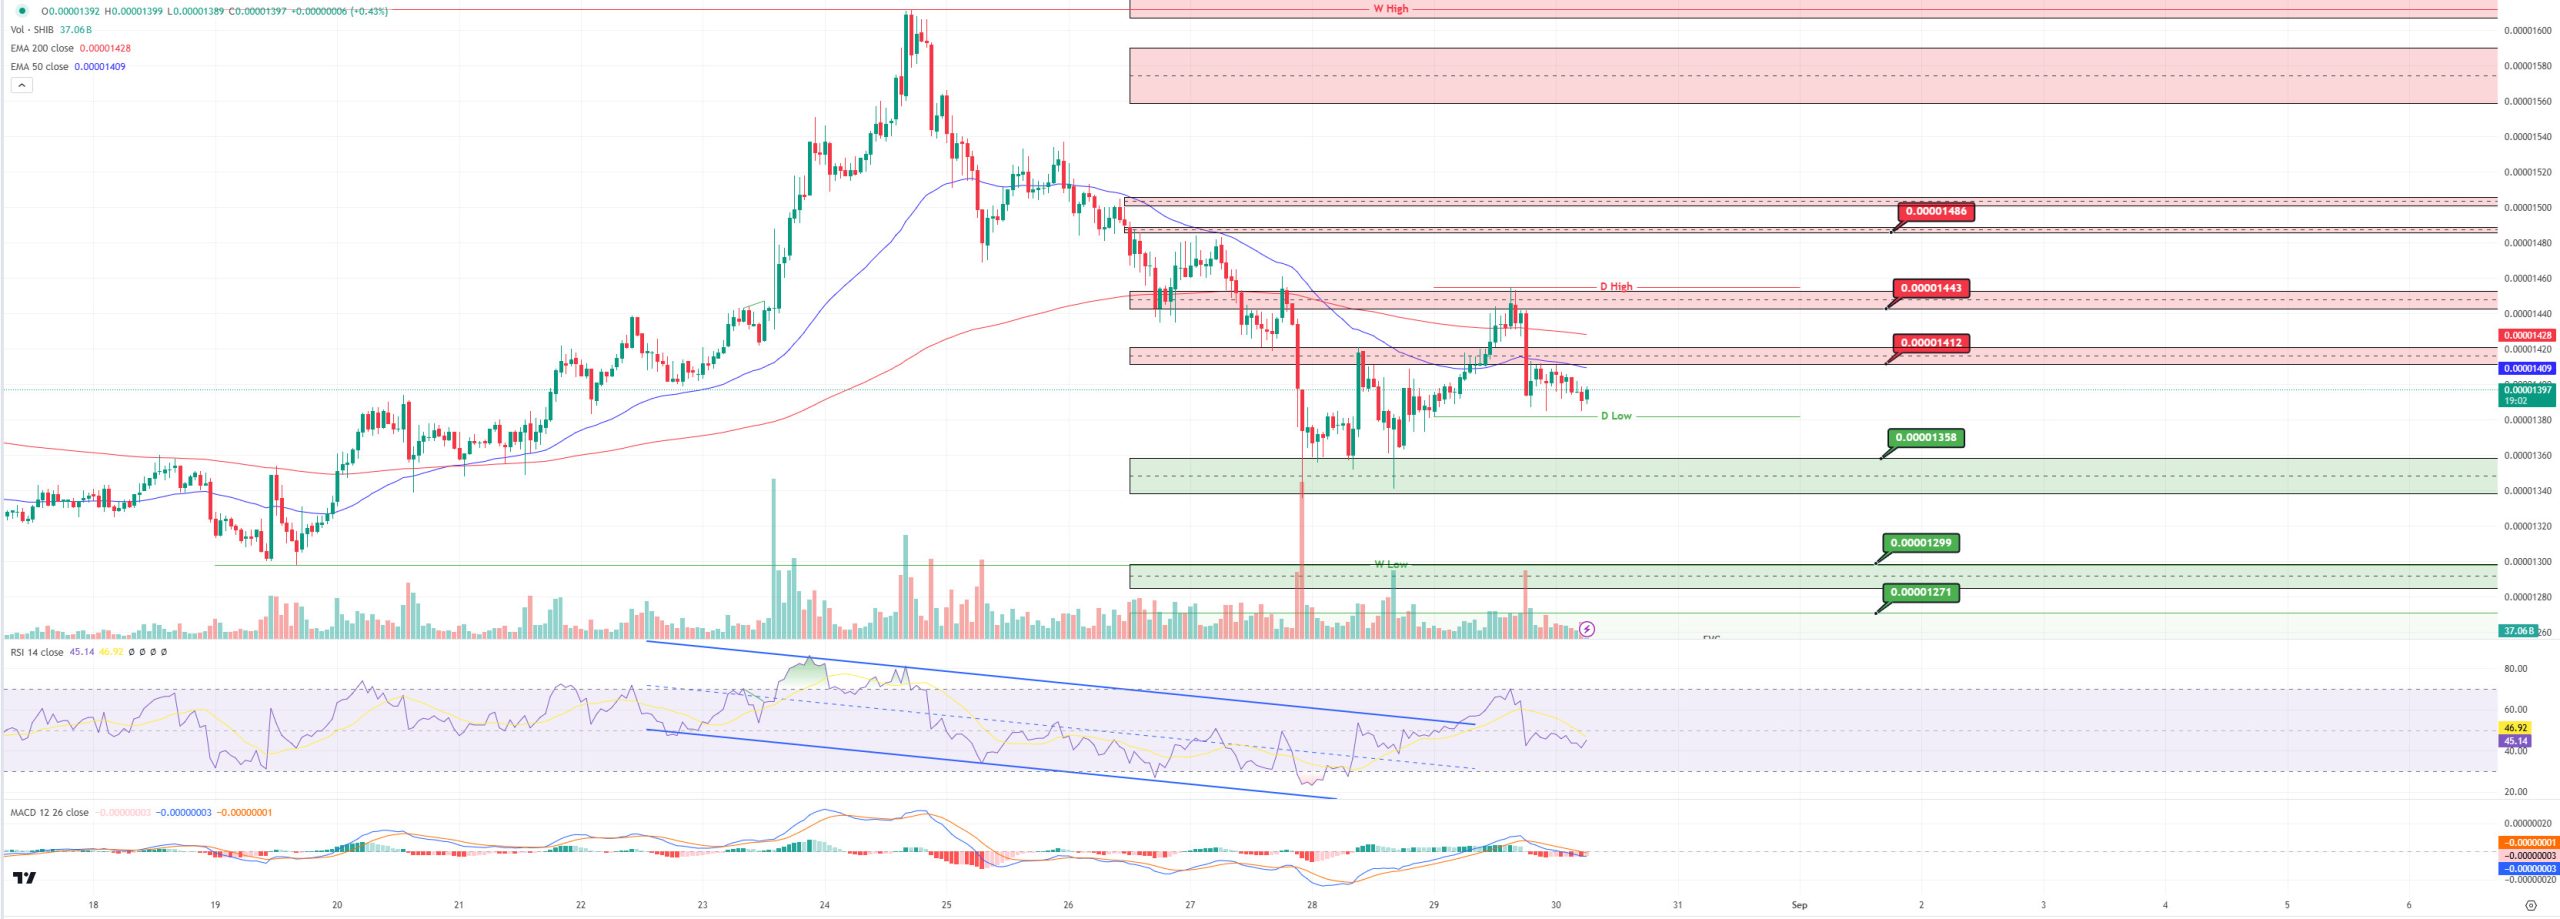
With the decrease in buyer pressure on the SHIB chart, the price was rejected at 0.00001443. The price is currently moving horizontally. We can say that the selling pressure on MACD has decreased. In the negative scenario, if the price breaks down the previous day’s low, we can expect it to retreat to the first support level of 0.00001358. In case the price is persistent above the previous day’s low, we can expect the price to test the 0.00001443 levels.
(Blue line: EMA50, Red line: EMA200)
Supports 0.00001358 – 0.00001299 – 0.00001271
Resistances 0.00001412 – 0.00001443 – 0.00001486
LEGAL NOTICE
The investment information, comments and recommendations contained herein do not constitute investment consultancy. Investment advisory services are provided by authorised institutions on a personal basis, taking into account the risk and return preferences of individuals. The comments and recommendations contained herein are general in nature. These recommendations may not be suitable for your financial situation and risk and return preferences. Therefore, making an investment decision based solely on the information contained herein may not produce results in accordance with your expectations.


