
MARKET SUMMARY
Latest Situation in Crypto Assets
| Assets | Last Price | 24h Change | Dominance | Market Cap |
|---|---|---|---|---|
| BTC | 105,095.58$ | 3.22% | 56.26% | 2,08 T |
| ETH | 3,959.16$ | 2.06% | 12.88% | 476,43 B |
| XRP | 2.400$ | -0.94% | 3.71% | 137,31 B |
| SOLANA | 222.58$ | 1.93% | 2.88% | 106,57 B |
| DOGE | 0.4045$ | 1.76% | 1.63% | 59,54 B |
| CARDANO | 1.0800$ | 1.41% | 1.02% | 37,89 B |
| TRX | 0.2838$ | 1.69% | 0.67% | 24,46 B |
| AVAX | 49.87$ | 1.90% | 0.56% | 20,44 B |
| LINK | 29.00$ | -0.89% | 0.50% | 18,15 B |
| SHIB | 0.00002748$ | 0.84% | 0.44% | 16,20 B |
| DOT | 8.854$ | 4.29% | 0.37% | 13,52 B |
*Prepared on 12.16.2024 at 07:00 (UTC)
WHAT’S LEFT BEHIND
Bitcoin Breaks Record by Reaching 106 Thousand Dollars
Bitcoin broke a new record by reaching 106,533 dollars in the rally that started after Trump’s election victory. It has gained 7.25% since the beginning of the month and 149% since the beginning of the year.
FASB’s Bitcoin Accounting Rules Take Effect
The FASB’s fair value accounting rules are effective as of today. This regulation paves the way for Bitcoin to be recognized as an institutional reserve asset.
Satoshi Nakamoto Becomes the 16th Richest Person in the World
With Bitcoin rising to $106,000, Satoshi Nakamoto’s fortune reached $106 billion. Nakamoto overtook Michael Bloomberg to become the 16th richest person in the world.
El Salvador’s Bitcoin Profit Increased 133%
The value of El Salvador’s bitcoin holdings exceeded $632 million, generating more than $360 million in profit from its initial investment. President Nayib Bukele announced a 133.95% return on this investment.
Trump Family’s World Liberty Crypto Project Grows
Trump family-owned World Liberty Fi increased its holdings and bought 251,826 AAVE worth $91,000. World Liberty Fi token address’s current altcoin holdings include: 78,387 LINK worth approximately $2.25 million, 6,137 AAVE worth approximately $2.2 million, and 596,650 ENA worth approximately $509,955. Also, 134,216 ONDO tokens were bought on Cow Protocol for 250,000 USDC.
HIGHLIGHTS OF THE DAY
Important Economic Calender Data
| Time | News | Expectation | Previous |
|---|---|---|---|
| – | FLOKI (FLOKI): MONKY Airdrop Snapshot | – | – |
| – | Sei (SEI): 55.56MM Token Unlock | – | – |
| – | Starknet (STRK): 64MM Token Unlock | – | – |
| – | Magic Eden (ME): Cross-Chain App Launch | – | – |
| 13:30 | US NY Empire State Manufacturing Index (Dec) | 6.4 | 31.20 |
| 14:45 | US Flash Manufacturing PMI (Dec) | 49.4 | 49.7 |
| 14:45 | US Flash Services PMI (Dec) | 55.7 | 56.1 |
INFORMATION
*The calendar is based on UTC (Coordinated Universal Time) time zone.
The economic calendar content on the relevant page is obtained from reliable news and data providers. The news in the economic calendar content, the date and time of the announcement of the news, possible changes in the previous, expectations and announced figures are made by the data provider institutions. Darkex cannot be held responsible for possible changes that may arise from similar situations.
MARKET COMPASS
Global markets started the critical week with Bitcoin hitting a new record high amid the ongoing “Trump” effect. In his recent statements, the president-elect argued that the US should hold Bitcoin as a strategic reserve and mentioned again that he would take steps to do so.
Meanwhile, Asia-Pacific indices started on a downtrend due to China’s macro indicators that failed to meet expectations. In Europe, index futures contracts are in negative territory ahead of the PMI data to be monitored today. Moreover, political developments in France and Germany will remain under the spotlight.
With the statements of the new President Trump, we can state that the Bitcoin movement in digital assets has diverged and that we have not seen as deep a rise in other major currencies as the BTC movement. Nevertheless, we maintain our expectation that the rise will continue in general. While Bitcoin may see a respite and divergence during European transactions, other digital assets may also find investor interest.
From the short term to the big picture.
The victory of former President Trump on November 5, which was one of the main pillars of our bullish expectation for the long-term outlook in digital assets, produced a result in line with our predictions. Afterwards, the appointments made by the president-elect and the expectations of increased regulation of the crypto ecosystem in the US continued to take place in our equation as a positive variable. Although Powell gave cautious messages in his last speech, the continuation of the FED’s interest rate cut cycle and the volume in BTC ETFs indicating an increase in institutional investor interest (in addition to MicroStrategy’s BTC purchases, BlackRock’s BTC ETF options started trading…) support our upward forecast for the big picture for now.
In the short term, given the nature of the market and pricing behavior, we think it would not be surprising to see occasional pauses or pullbacks in digital assets. However, at this point, it is worth emphasizing again that the fundamental dynamics continue to be bullish.
TECHNICAL ANALYSIS
BTC/USDT
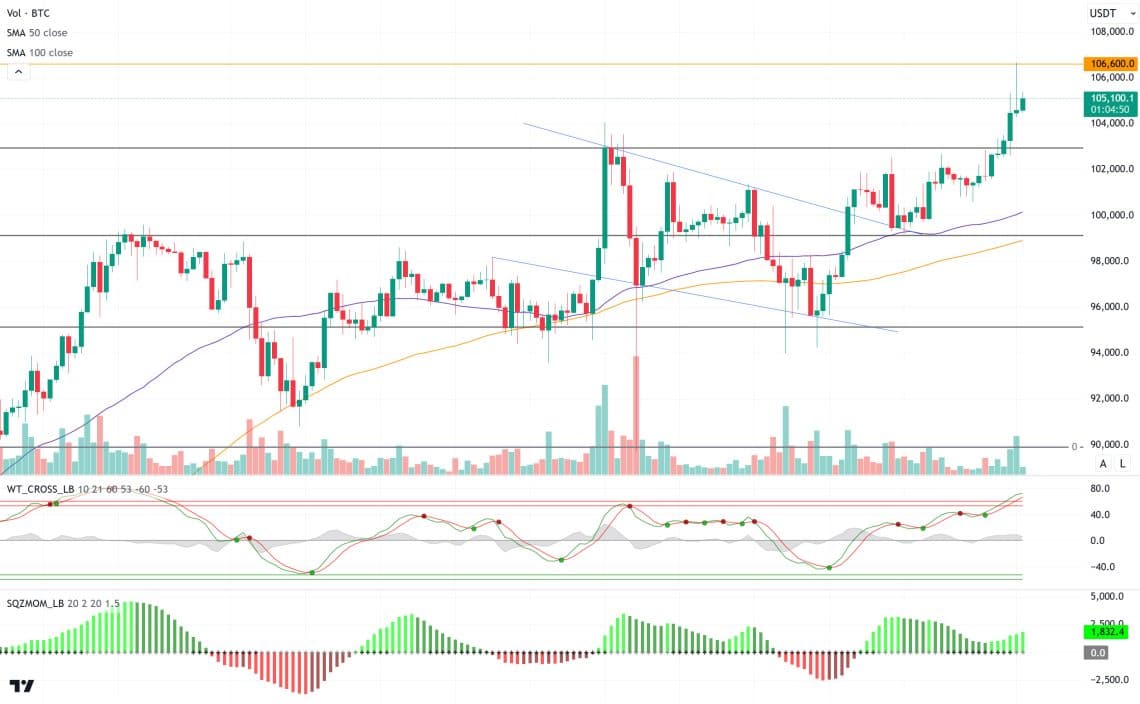
Bitcoin continues its steady rise. Unlike previous bull periods, institutional investors’ intense interest in Bitcoin spot ETFs is supporting the upward movement of the market by limiting declines. Between December 9-13, Bitcoin spot ETFs saw net inflows totaling $2.17 billion, which continued for five consecutive trading days. The total net asset value of Bitcoin spot ETFs reached $114.969 billion, accounting for 5.71% of Bitcoin’s total market capitalization. This data shows that institutional investor interest continues to be a key driver of Bitcoin.
With all these developments, when we look at the BTC technical outlook, the strong closes above the 100,000 level, breaking the minor falling trend channel last week, brought the new ATH 106,488 level. Currently trading at 105,100, BTC’s technical oscillators are weakening but maintaining a buy signal, while the momentum indicator is trying to regain strength. In the continuation of the rise, the ATH level is our resistance level, but if it is exceeded, the 110,000 level can be targeted. In a possible pullback, we will follow the 102,900 support level.
Supports 102,900 – 101,400 – 100,000
Resistances 106,488 – 110,000 – 115,000
ETH/USDT
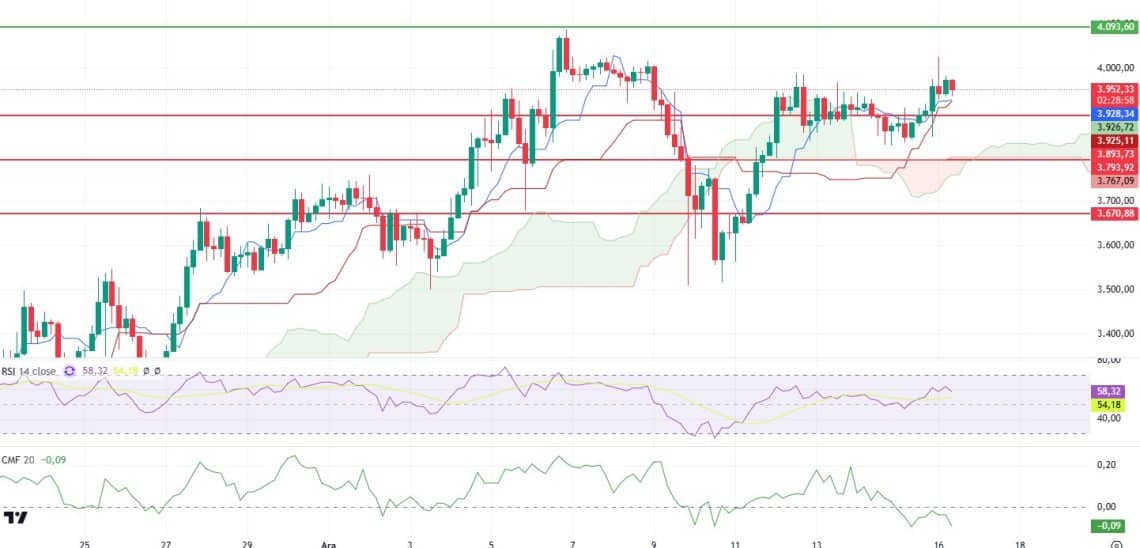
ETH recently managed to surpass the $4,000 level with its latest rally but faced significant selling pressure, pulling back to $3,950. Looking at technical indicators, the Relative Strength Index (RSI) aligns with the upward movement, indicating a healthy structure. However, the Chaikin Money Flow (CMF) has turned negative and continues to decline, signaling increased selling pressure in the market.
The Ichimoku indicator shows that the price remains above the cloud, but the convergence of Tenkan and Kijun levels suggests the possibility of a pullback.
Additionally, an analysis of Cumulative Volume Delta (CVD) reveals that the rally was primarily driven by spot market activity.
In summary, these indicators suggest that ETH is currently in a zone of uncertainty. Pullbacks may continue throughout the day. Nevertheless, as long as the critical support level at $3,893 holds, the price could recover and push back above $4,000. Conversely, a break below $3,893 could trigger a deeper decline.
Supports 3,893 – 3,793 – 3,670
Resistances 4,093 – 4,299 – 4,440
SOL/USDT
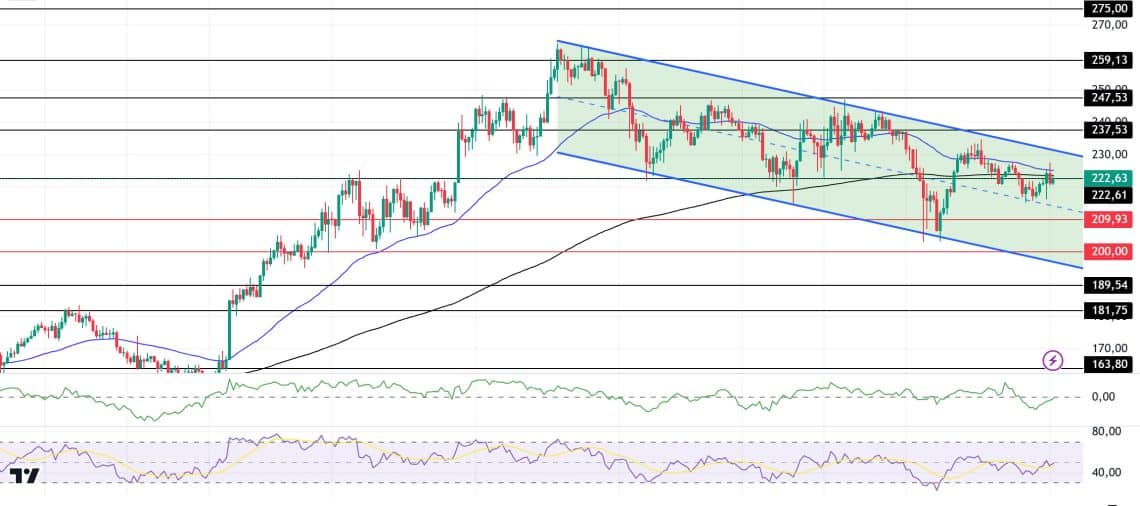
According to PANews, recent data from Glassnode reveals that investors holding Solana (SOL) tokens for a period of 6 to 12 months currently own 27% of the total supply. This significant share shows strong confidence among buyers who expect a rebound in 2024. It is trading at $222.94, up about 1.57% in the last 24 hours with a daily trading volume of $3.55 billion. With increased activity in decentralized applications (dApps) and non-fungible tokens (NFTs), Solana’s expanding ecosystem is increasing its utility. On the other hand, SOL, worth $32.54 million, was delisted from exchanges.
Looking at the chart, SOL seems to have lost its upward momentum. The volume remains low in the asset, which is in the middle of a broad downtrend. This means that neither buyers nor sellers are ready for a sharp move. On the 4-hour timeframe, the 50 EMA (Blue Line) is above the 200 EMA (Black Line). Although there is an upward acceleration from the support level, the volume started to fall again, making the 200 EMA support and the 50 EMA resistance. When we examine the Chaikin Money Flow (CMF)20 indicator, money inflows have increased and reached the neutral level. However, Relative Strength Index (RSI)14 is at the neutral zone level. The 237.53 level stands out as a very strong resistance point in the rises driven by both the upcoming macroeconomic data and the news in the Solana ecosystem. If it breaks here, the rise may continue. In case of retracements for the opposite reasons or due to profit sales, support levels 189.54 and 181.75 can be triggered again. If the price hits these support levels, a potential bullish opportunity may arise if momentum increases.
Supports 222.61 – 209.93 – 200.00
Resistances 237.53 – 247.53 – 259.13
XRP/USDT
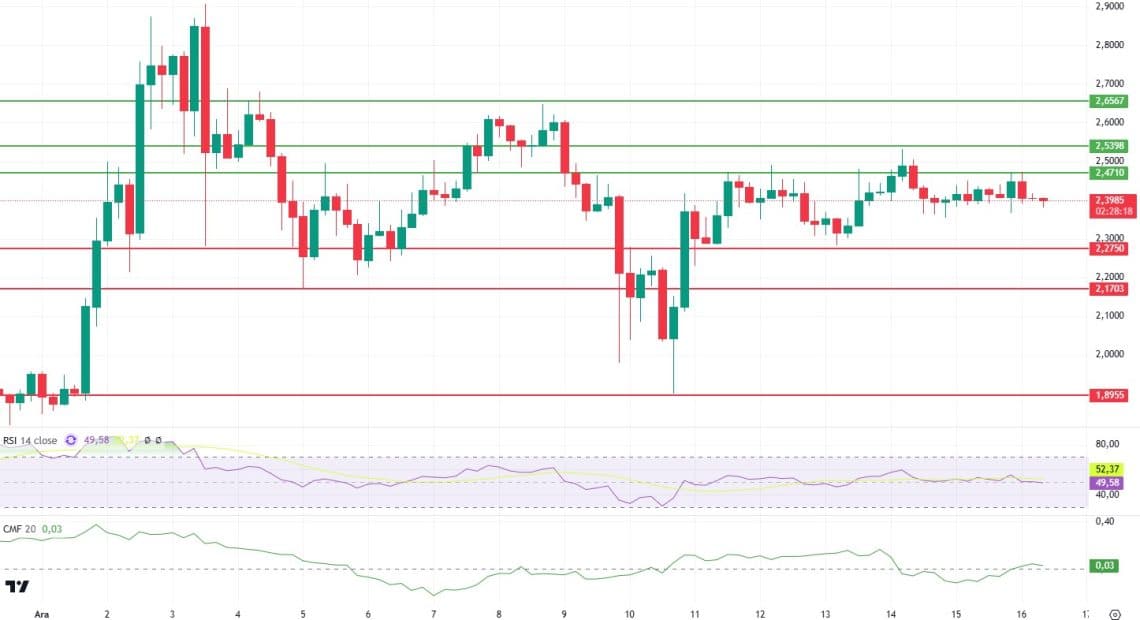
XRP experienced a notable rally last night, coinciding with BTC reaching its all-time high, climbing to as high as $2.47. However, at this resistance level, it faced significant selling pressure, leading to a pullback to around $2.38. Both volume data and the Chaikin Money Flow (CMF) indicate that XRP is struggling to attract sufficient spot buyers at these levels.
If the price continues to decline towards the $2.28 level and closes below it, the likelihood of further downside increases. Additionally, the formation of a Head and Shoulders pattern, along with signals from the Relative Strength Index (RSI), underscores the potential for a bearish scenario.
This technical setup suggests that XRP is at a critical juncture, and a decisive break below $2.28 could pave the way for deeper corrections. Conversely, holding this level may provide the opportunity for buyers to regain momentum.
Supports 2.2750 – 1.1703– 1.8955
Resistances 2.4710 – 2.5398 – 2.6567
DOGE/USDT
The Dogecoin (DOGE) ecosystem has seen a significant shift in the last 24 hours. Despite a bullish market cycle that saw Bitcoin surge above $100,000, DOGE continued to see slight declines. Notably, Dogecoin investors suffered a total loss of $20.17 million in liquidations. In parallel, data from IntoTheBlock reflects a gradual increase in DOGE’s large trading volume, which rose from $6.1 billion to $23.3 billion. This indicates increased demand from whales as Dogecoin consolidated from around 0.4000.
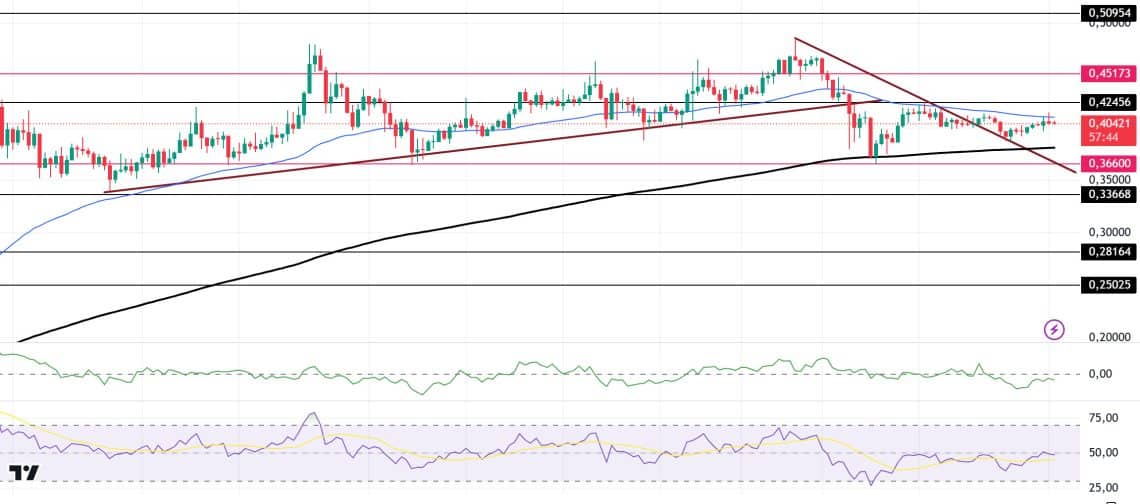
Looking at the chart, we can see that DOGE has successfully unwound from overbought levels. The Relative Strength Index (RSI) 14 on the chart returned to the neutral 50 zone. This suggests that the token has relieved the overbought pressure and paved the way for another potential leg upwards. Since December 8, the asset, which has been in a downtrend since December 8, has reversed its downtrend due to BTC’s usual market rallies and is moving sideways. This led it to test the 0.42456 level and hit resistance from the 50 EMA (Blue Line) and lost some momentum. On the 4-hour timeframe, the 50 EMA (Blue Line) is above the 200 EMA (Black Line). On the other hand, when we look at the Relative Strength Index (RSI) 14 indicator, it is deployed at a neutral level. However, when we examine the Chaikin Money Flow (CMF)20 indicator, there is a small amount of money outflows and suppresses the price. The level of 0.50954 appears to be a very strong resistance place in the rises driven by both the upcoming macroeconomic data and the innovations in the Doge coin. If DOGE maintains its momentum and rises above this level, the rise may continue strongly. In case of possible retracements due to macroeconomic reasons or negativities in the ecosystem, the 0.33668 support level is an important support level. If the price reaches these support levels, a potential bullish opportunity may arise if momentum increases.
Supports 0.36600 – 0.33668 – 0.28164
Resistances 0.42456 – 0.45173 – 0.50954
LEGAL NOTICE
The investment information, comments and recommendations contained herein do not constitute investment advice. Investment advisory services are provided individually by authorized institutions taking into account the risk and return preferences of individuals. The comments and recommendations contained herein are of a general nature. These recommendations may not be suitable for your financial situation and risk and return preferences. Therefore, making an investment decision based solely on the information contained herein may not produce results in line with your expectations.
